SPY Options Are Pricing a $10.86 Move for November 4: Walls, Max Pain and Three Defined-Risk Trades
The options market implies a $743.49–$765.21 range for SPY into the November 4 expiration. Heavy put buying looks more like hedging than conviction, and premium is unusually rich against what SPY has actually delivered.
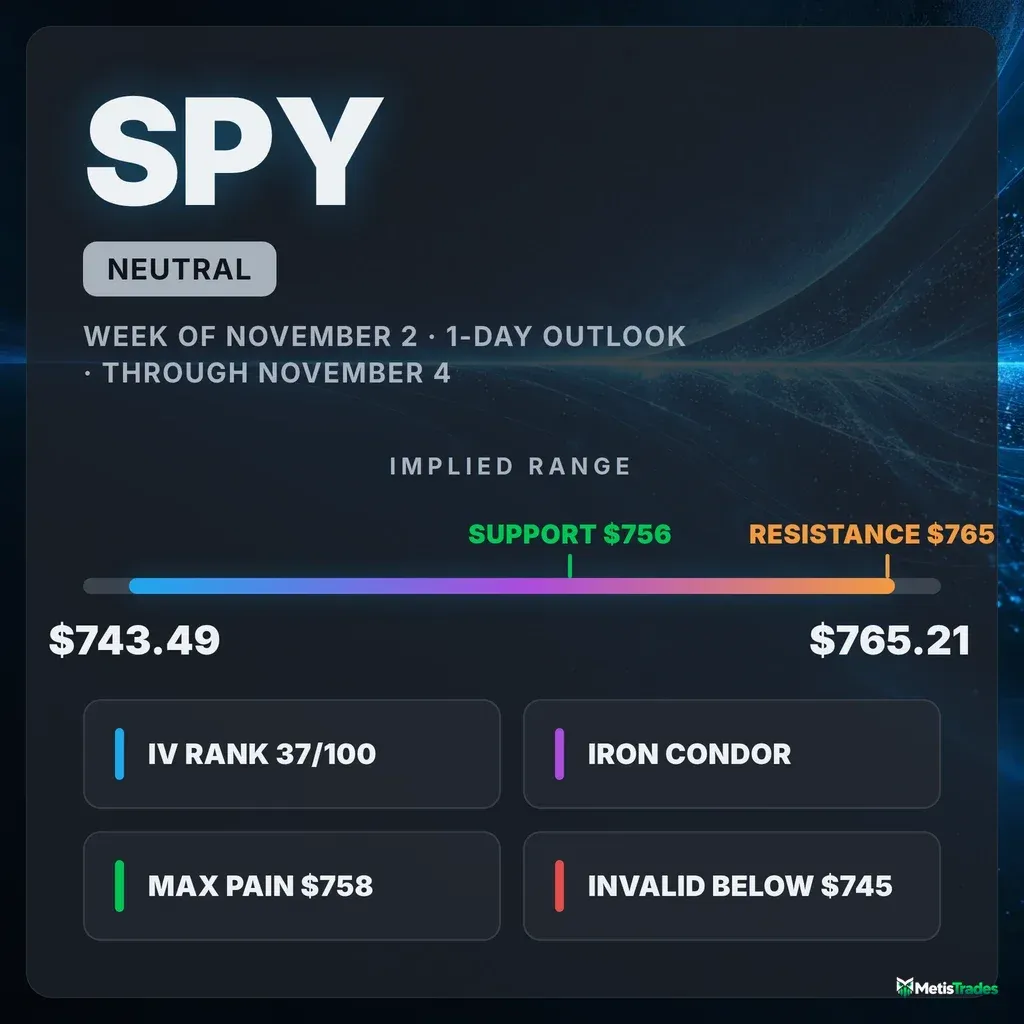
The options market implies a $743.49–$765.21 range into the November 4 expiration. Here is what's driving that range and three defined-risk ways to trade it.
Published Tuesday, November 3, 2026 · Data as of Tuesday, November 3, 2026 close
Explore the live SPY options data in the Detailed Options Analyzer →
Quick answer
| Item | Answer |
|---|---|
| Market bias | Neutral |
| Options-implied range (into November 4) | $743.49 – $765.21 (±$10.86, ±1.44%) |
| Major support | $756.00 put wall for the November 4 expiration (spot sits just below it); the whole chain's heaviest put strike is $750.00 |
| Major resistance | $765.00 call wall for the November 4 expiration |
| Max pain (November 4) | $758.00 |
| Dealer gamma regime (estimate) | Negative: hedging tends to amplify moves. Flip level ≈ $735 |
| Volatility condition | Rising. IV rank 36.62/100, ATM IV 16.75%. Premium is rich: options are priced about 5.6 vol pts above delivered movement |
| Technical check | Mixed (bearish chart model, 2-day horizon; target $751.80, range $744.50–$761.00) |
| Best-fitting strategy | November 4 iron condor (745/742 puts, 763/766 calls), but only if you accept one-session gap risk |
| Analysis invalidated if | SPY closes below $745.00 |
1 · What matters today
Our read for tomorrow's session (November 4) is neutral. Traders bought a lot of puts today, but after a roughly 2% slide over five sessions, that pattern looks more like protection-buying than a fresh bet on a crash. The options market is pricing a move of about $10.86 either way. That puts SPY somewhere between $743.49 and $765.21 by tomorrow's close.
SPY closed at $754.35. That is just under the biggest pile of puts expiring tomorrow, at $756, and below the strike where the most option value would expire worthless, at $758. Those two levels pull upward, while short-dated sentiment pulls down.
The level that changes the picture is $745. A close below it breaks the range thesis.
The chart-based technical model leans mildly lower, with a $751.80 target, but that target still sits well inside the options range.
2 · What the options market is pricing
What changed this week
SPY is down 1.99% over five trading days and 3.18% over twenty. Options traders reacted by piling into protection.
- Put/call open interest jumped. Put/call open interest compares contracts currently held open on each side. It went from about 1.08 to 1.77 over five sessions, so there are now nearly 1.8 puts held open for every call. That is above its 7-day average of 1.66 and its 14-day average of 1.58.
- Implied volatility rose. Implied volatility (IV) is the market's estimate of how much SPY will move, baked into option prices. It rose 18.4% over five days, though it eased 1.4% today.
- The biggest new position was in mid-November puts. The November 13 $745 puts added 56,668 contracts, lifting open interest to 72,530. Traders are paying for downside insurance a week and a half out.
- Some protection was cashed in. The November 20 $750 puts shed 48,912 contracts.
- Into today's settled expiration, flow was put-heavy. The November 3 $756 puts traded more than 362,000 contracts and roughly $59 million in premium. That is now history.
The short-term trend read is bearish over the past week, while the roughly one-month and two-month reads are flat. The downturn is a near-term story layered on a bigger picture that hasn't broken.
Expected move
The expected move is the move the options market is pricing in, derived from what straddles cost. For the November 4 expiration it is ±$10.86 (±1.44%) around $754.35. Here is how that widens with time:
| Expiration | Implied move | Range around $754.35 |
|---|---|---|
| November 4 | ±1.44% | $743.49 – $765.21 |
| November 5 | ±1.79% | $740.85 – $767.85 |
| November 6 | ±2.12% | $738.36 – $770.34 |
| November 13 | ±3.17% | $730.44 – $778.26 |
| December 4 | ±4.91% | $717.31 – $791.39 |
The one-day rung is unusually steep for SPY. November 4's at-the-money options carry a blended IV of about 27.6%, versus roughly 16.3% at the 60-day point. Tomorrow's contracts are priced for a jumpier-than-usual session.
Volatility
At-the-money IV is 16.75%. It is well above its 30-day average of 13.6% and its 90-day average of 13.5%, and up 40.7% over the past 30 sessions.
IV rank shows where today's IV sits versus the past year. At 36.62/100, today's IV is a bit over a third of the way up its 52-week range. Most of the year was spent at the low end of that range, though, so today's reading is higher than about 81% of the past year's daily readings.
The front-month read is unavailable today because it was an expiry day, so the usual near-versus-far slope comparison (comparing option prices across expiration dates) is missing.
Movement has picked up too. Over the last five days, realized volatility is running about 1.2 times its 20-day pace. That is somewhat above SPY's own recent norm, where "norm" means compared against this fund's own history, not the broader market.
Premium is rich. The volatility risk premium is the gap between how much movement options are priced for and how much SPY has actually delivered. When it's positive, option sellers have been collecting more than realized movement cost them. Today SPY options are priced about 5.6 vol points above the stock's 20-day realized volatility of 11.2%. Its percentile places today's gap against SPY's own recent readings: at 92/100, the premium is richer than 92% of them.
The gap dipped to about 3.2 points on October 29, then rebounded with the selloff. IV rank in the 30s plus a 92nd-percentile premium favors collecting premium rather than buying it. The catch is that one-day short-premium trades can still be gapped.
Skew and sentiment
Skew means puts and calls the same distance from the stock price don't cost the same. When puts are pricier, traders are paying up for crash protection.
- Skew is stretched. Puts are running 6.8 vol points over calls (25-delta put IV 20.8% versus call IV 14.0%), against a 60-day norm of 3.7 points. That is about as steep as SPY's skew has been in recent memory, relative to its own history.
- Put/call volume is near normal. It measures how much put activity there is relative to calls, and above 1 means puts dominate. It reads 1.07, close to its 7-day average of 1.11.
- Overall volume was light. Total option volume was only 0.84 times its 20-day average. This was steady hedging, not a stampede.
- Short-dated sentiment is aggressively bearish. Sentiment in 0–7 day options scored −51, against a 7-day average of −12. The 7–30 day window scored −47, against −31. The overall picture reads as aggressive front-end put demand.
- Call positioning grew a little. Net open contracts tilted toward calls since yesterday, which is unusually call-leaning for this name.
Our read: when protection gets this expensive this quickly, after only a 2% drop and with the longer trend intact, it usually reflects hedging demand that is already in place rather than a new wave of selling.
The key levels map
| Level | Price | Why it matters |
|---|---|---|
| 52-week high | $781.62 | SPY is 3.49% below it |
| Swing resistance | $776.26 | Upper price-structure ceiling |
| 20-day moving average | $768.09 | Price is 1.79% below it |
| 50-day moving average | $767.04 | Medium-term trend line, now overhead |
| Call wall (November 4) | $765.00 | Biggest pile of calls expiring tomorrow; also a top gamma strike; sits right at the implied-range edge |
| Call wall (whole chain) | $760.00 | Heaviest call strike across all expirations |
| 100-day moving average | $759.65 | Longer-trend reference |
| Swing resistance | $758.23 | Recent pivot cluster |
| Max pain (November 4) | $758.00 | The price where the most option value would expire worthless; expirations sometimes gravitate toward it |
| Technical resistance | $757.00 | The chart model's line; a close above it voids its bearish setup |
| Put wall (November 4) | $756.00 | Biggest pile of puts expiring tomorrow (12,846 contracts), almost all built today |
| Gamma strike | $755.00 | Heavy two-sided open interest just above spot |
| Spot | $754.35 | Tuesday's close |
| Put wall (whole chain) / technical support | $750.00 | Largest gamma strike in the chain, with about 223,000 puts open |
| Swing support | $746.81 | Nearest price-structure floor |
| Gamma strike | $745.00 | Big put base, including the 72,530 November 13 puts; our invalidation line |
| Gamma flip (estimate) | $735.00 | One rough estimate of where hedging flips from cushioning to accelerating |
| Swing support | $734.61 | Deeper floor |
| 200-day moving average | $729.47 | Long-term uptrend line, still 3.41% below price |
| 52-week low | $629.28 | Distant reference |
Positioning and unusual flow
Market makers hedge the options they've sold. In a negative-gamma regime, their hedging tends to amplify moves rather than dampen them. One rough estimate puts both the whole chain and the November 4 expiration on its own in that negative regime. That supports the steep one-day pricing: the market expects moves to travel, not stall.
The flow worth knowing about:
- November 4 $756 puts. Open interest went from 448 to 12,846 in one session, on 33,818 contracts traded and about $17.2 million in premium. This created tomorrow's put wall from scratch. Because spot is below $756, these puts are already about $1.65 in the money, so they act more as a hedge being held than as a floor under price.
- November 4 $754 puts. Volume of 42,166 against open interest of just 1,344, a turnover of about 31 times. Most of that was intraday trading rather than new positions held overnight.
- November 4 $755 calls. 49,387 contracts traded, roughly $20.2 million in premium. This was the call side of the same at-the-money battle. Both sides of the strike were busy, which fits a contested one-day pin rather than a one-way bet.
3 · Technical check
The next-session chart model, published the same evening, is bearish. It targets $751.80 with a projected range of $744.50 to $761.00 over its two-day horizon. Its reference price of $754.41 matches our close within a few cents.
Its case rests mainly on two signals. First, a fresh bearish MACD cross alongside a descending-triangle-style coil above $750. Second, a weak trend reading: ADX is near 22 and falling, which caps conviction.
The model's key levels are support at $750 and resistance at $757. Its dominant scenario is invalidated by a close above $757.
Against our options read, this is Mixed. The direction leans lower than our neutral view, but the target sits comfortably inside the implied range. The model's projected range is also nearly the same width as what options are pricing.
Model vs. Market: The options market implies $743.49 – $765.21; the 2-day technical model targets $751.80. That is only $2.55 below the close, about a quarter of the expected move. The chart is describing a drift within the range, not a break out of it.
The technical read nudged our bullish spread's short strike down to $750, where the model and the chain's largest put pile agree on support. It also shaped the bearish debit spread's break-even, which lands at the model's target.
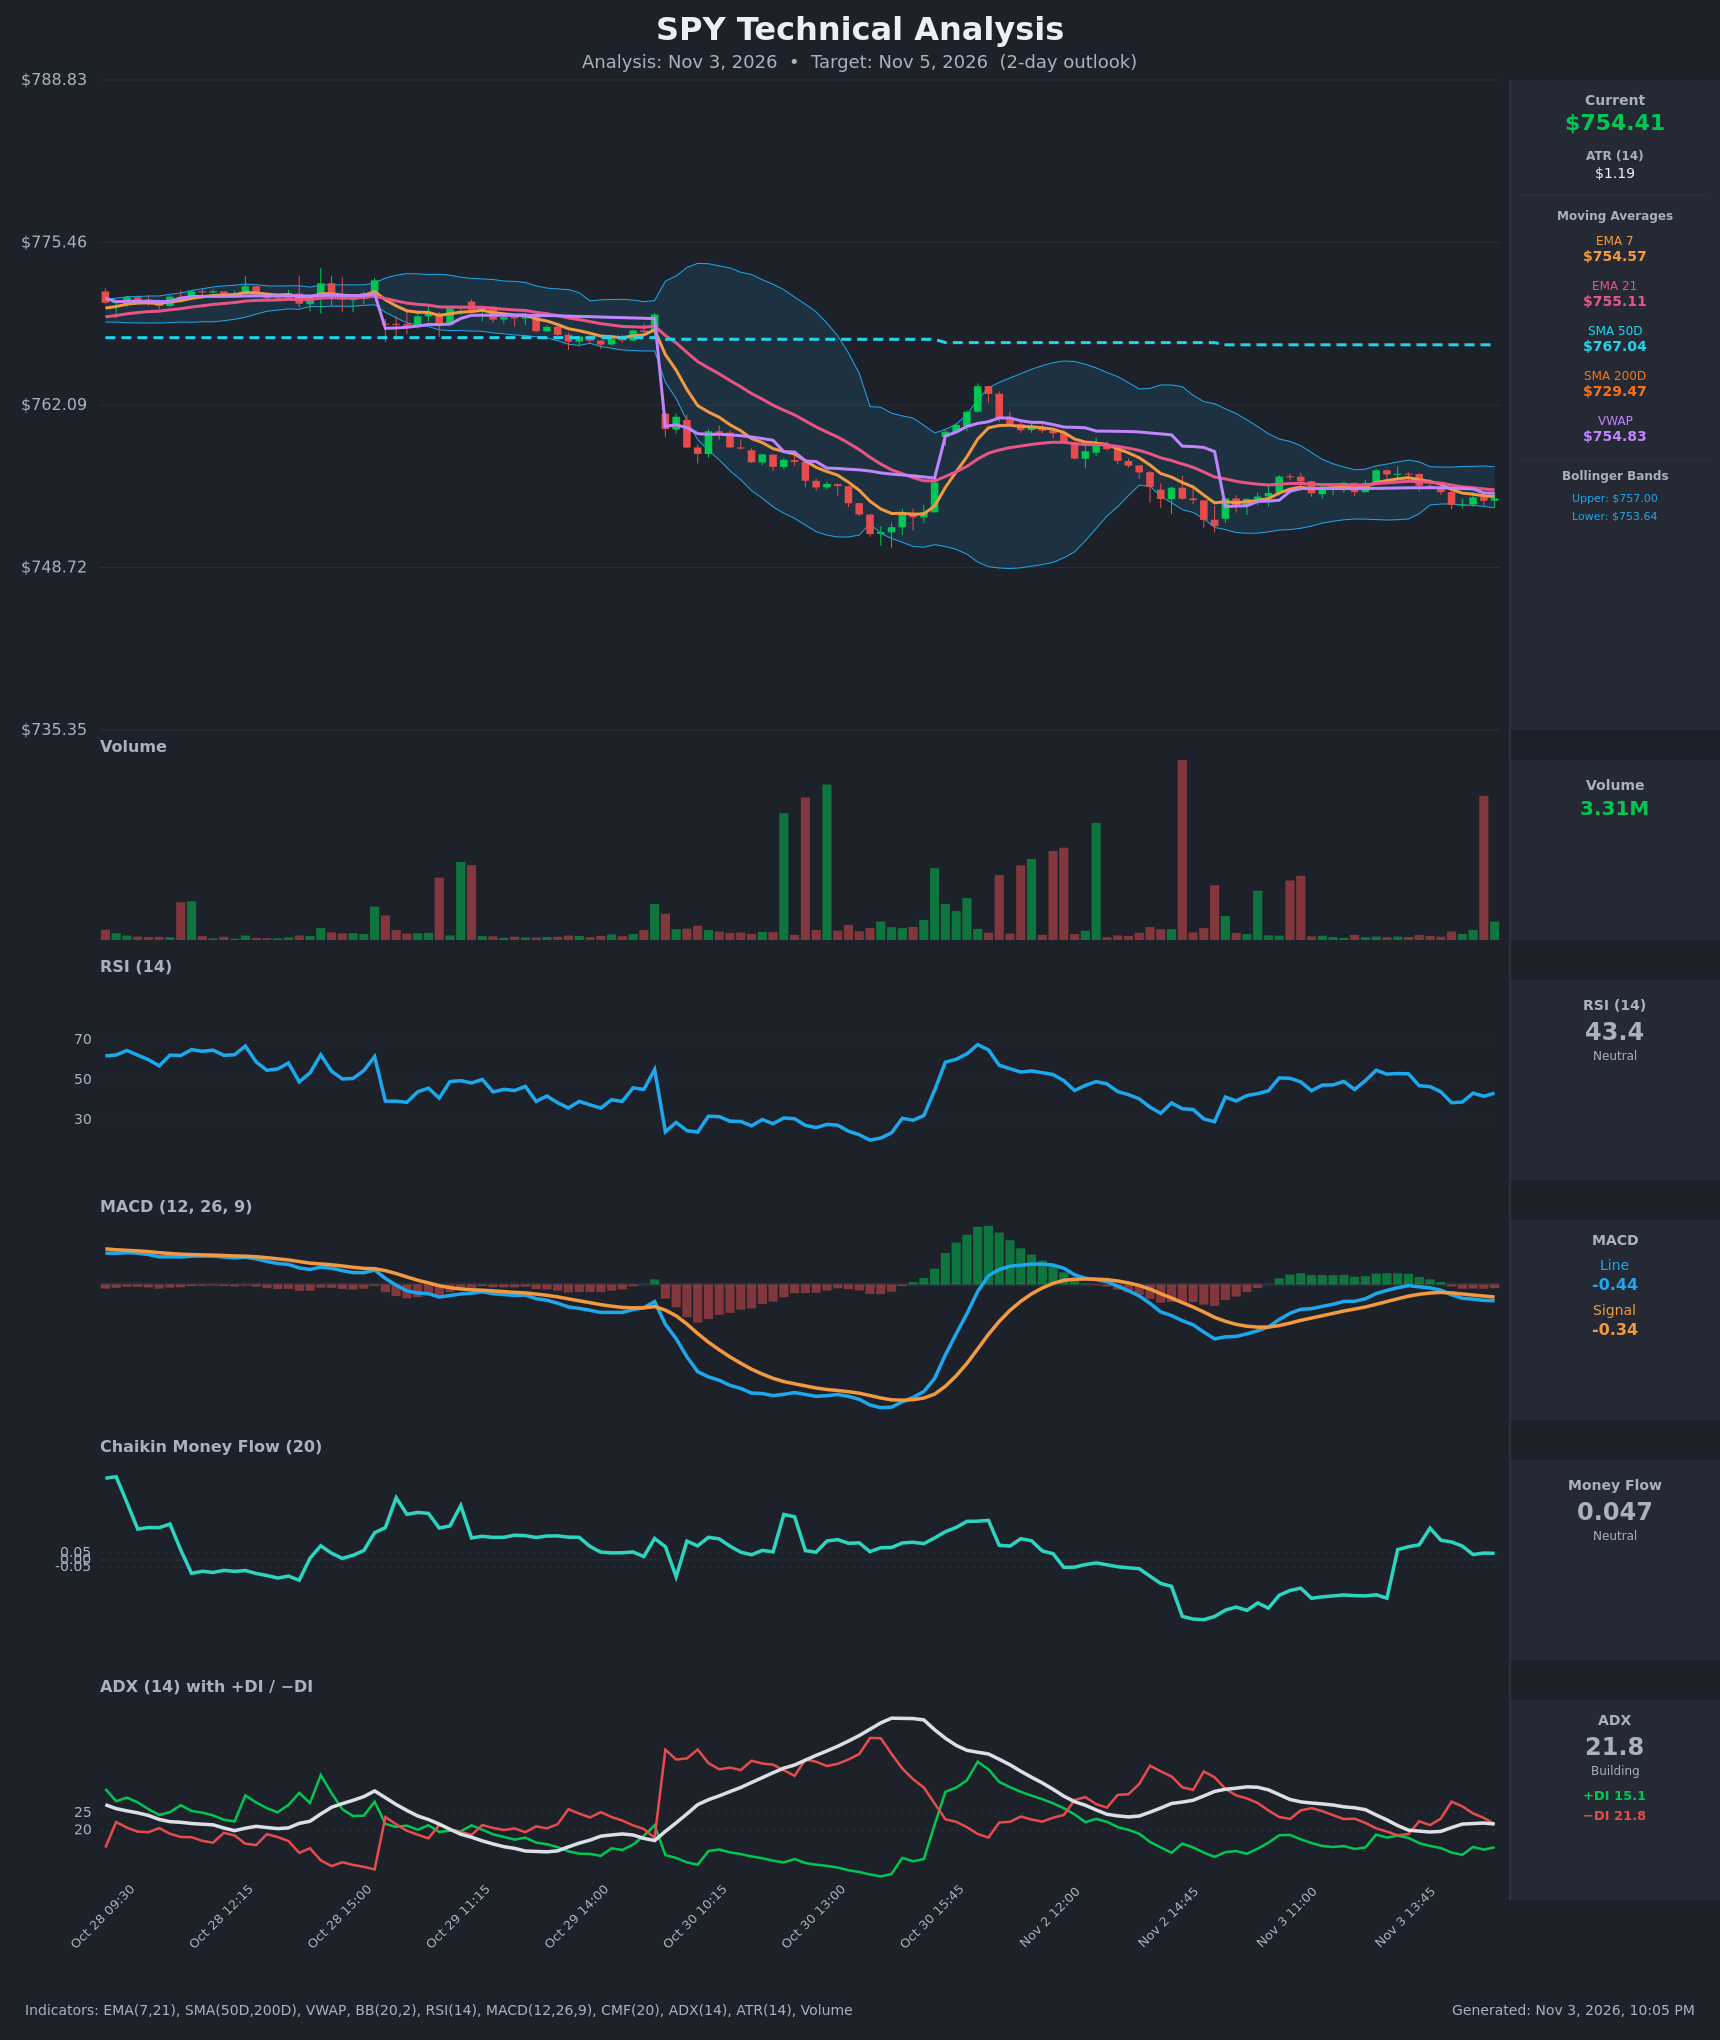
Full technical write-up: Next-session report →
4 · Three ways the session can go
If SPY pushes above the call wall ($765.00): That would mean a move through the top of the implied range and past tomorrow's largest call pile. A rally there would also have to fight the 50-day and 20-day averages stacked at $767–$768. In a negative-gamma setting a squeeze can run, but positioning thins out quickly above $766.
If SPY reclaims the put wall and drifts toward max pain ($756–$758): This is the pin case. Spot is less than $2 below the freshly built $756 put wall and less than $4 below max pain at $758. Expiring open interest often tugs price toward those strikes into the close. A recovery to that zone is the path of least resistance for tomorrow's option holders.
If SPY stays under the put wall and slides toward $750: This is the acceleration case. Below $756, the next real cushion is the chain's heaviest put strike at $750, which is also the chart model's support. Beneath that sit swing support at $746.81 and the big $745 put base. With hedging estimated in the amplifying regime, a break of $750 could travel quickly toward $745. The gamma flip estimate of about $735 is far below and isn't in play for one session.
5 · Three defined-risk structures
Prices are end-of-day midpoints as of November 3, 2026. All structures are hypothetical unless flagged as an entered position. Verify live prices before trading, because these will be stale by the open.
With premium richer than 92% of SPY's recent readings, the premium-selling structure leads here.
If you expect the range to hold: November 4 iron condor
- Trade: Sell the November 4 $745/$742 put spread and sell the November 4 $763/$766 call spread. You collect a credit and are betting SPY finishes between the short strikes.
- Credit: $1.04 ($0.475 put side + $0.565 call side)
- Max profit: $104
- Max loss: $196
- Break-evens: $743.96 and $764.04
- Why it fits: Both break-evens sit just inside the $743.49–$765.21 implied range. The short call is below the $765 call wall, and the short put is at the $745 put base. Premium is priced about 5.6 vol points over delivered movement.
- Makes sense only if: You accept that a negative-gamma session can blow through one side, and that max loss is nearly twice the credit.
- Invalidated if: SPY closes below $745.00, or above $763.
- Managing it: Take profits around 50% of the credit if the morning is quiet. If price touches either short strike, close rather than hope. Exit by the final hour regardless.
- Liquidity note: Quoted spreads are tight. The $745 puts trade 3¢ wide, the $742 puts 2¢, the $763 calls 3¢, and the $766 calls 2¢.
- Analyze this position →
If you lean bullish: November 4 $750/$747 put credit spread
- Trade: Sell the November 4 $750 put and buy the $747 put. You collect a credit and win if SPY stays above $750.
- Credit: $0.84
- Max profit: $84
- Max loss: $216
- Break-even: $749.16
- Why it fits: $750 is the chain's heaviest put strike and the chart model's support. You are selling puts while skew makes them unusually expensive.
- Makes sense only if: You think the put buying is hedging that's already in place, and that SPY drifts back toward max pain at $758.
- Invalidated if: SPY closes below $750.
- Managing it: Close at about 50% of the credit. If SPY trades through $750 intraday, close the spread rather than wait for the settlement print.
- Liquidity note: The $750 puts trade 1¢ wide and the $747 puts 3¢ wide, so fills are easy.
- Analyze this position →
If you lean bearish: November 4 $754/$748 put debit spread
- Trade: Buy the November 4 $754 put and sell the $748 put. You pay a debit and profit if SPY falls toward $748.
- Debit: $2.15
- Max profit: $385 (at or below $748)
- Max loss: $215
- Break-even: $751.85
- Why it fits: Selling the $748 put recovers part of the expensive put premium. The break-even sits on the chart model's $751.80 target, and max profit lands just above $746.81 swing support. The past week's weakness against flat longer trends argues for short-dated exposure like this.
- Makes sense only if: You trust the short-dated put demand and the model's coil-breakdown pattern more than the pull from the put wall and max pain.
- Invalidated if: SPY closes above $757.
- Managing it: Take profits near $749–$750 rather than holding for the full width. Cut the trade if SPY reclaims $756.
- Liquidity note: The $754 puts trade 2¢ wide and the $748 puts 4¢ wide.
- Analyze this position →
If none of these: no trade
Rich premium is a reason to consider selling, not a requirement. Standing aside is reasonable for three reasons:
- The risk is lopsided. The one-day condor risks almost $2 to make $1.04, so one bad session erases two good ones.
- Hedging could amplify a move. The estimated negative-gamma regime means a move that starts is more likely to keep going.
- Skew is stretched. Some of the premium reflects real tail-risk demand, not free money.
If you can't watch the position during the session, a one-day expiration is the wrong place to be short premium. A slightly longer-dated look after tomorrow's settlement loses nothing.
6 · Quick FAQ
What is SPY's expected move for November 4? About ±$10.86 (±1.44%), or $743.49 to $765.21, per straddle pricing as of the November 3 close.
Is SPY expected to go up or down tomorrow? Options positioning as of November 3 reads neutral. Put buying is heavy, but spot sits below the $756 put wall and $758 max pain, which tend to pull upward. That is a read of what traders have done, not a forecast. The actionable map is the $743.49–$765.21 range and the $756/$765 walls.
Are SPY options expensive right now? Yes, on two counts. IV rank is 36.62/100, and IV is higher than about 81% of the past year's daily readings. On top of that, options are running about 5.6 vol points above the movement SPY has actually delivered, richer than 92% of its own recent readings.
Where are SPY's biggest options support and resistance levels? For November 4, the put wall is $756.00 and the call wall is $765.00. Across the whole chain, the heaviest put strike is $750 and the heaviest call strike is $760.
What invalidates this read? A close below $745.00.
Methodology & disclosures. Data: end-of-day options-chain snapshot for SPY, 2026-11-03, generated 2026-11-03T22:05:30.259Z. Prices shown are midpoints and will differ from live markets. Momentum/positioning scores and volatility-premium comparisons are descriptive measurements of past option flow and past price movement — not investment advice, signals, forecasts, or guarantees. All trade structures are hypothetical. Every structure shown has a defined maximum loss; you can lose the entire max-loss amount. Options involve substantial risk and are not suitable for all investors.