SPY Options Are Pricing a $13.93 Move for November 6, but Our Read Sees a Hedging-Driven Range
After a 4.4% one-day drop, SPY options imply a $719.07 to $746.93 range into the November 6 expiration. Here is why the put-heavy flow reads as hedging rather than conviction, plus three defined-risk ways to trade the next session.
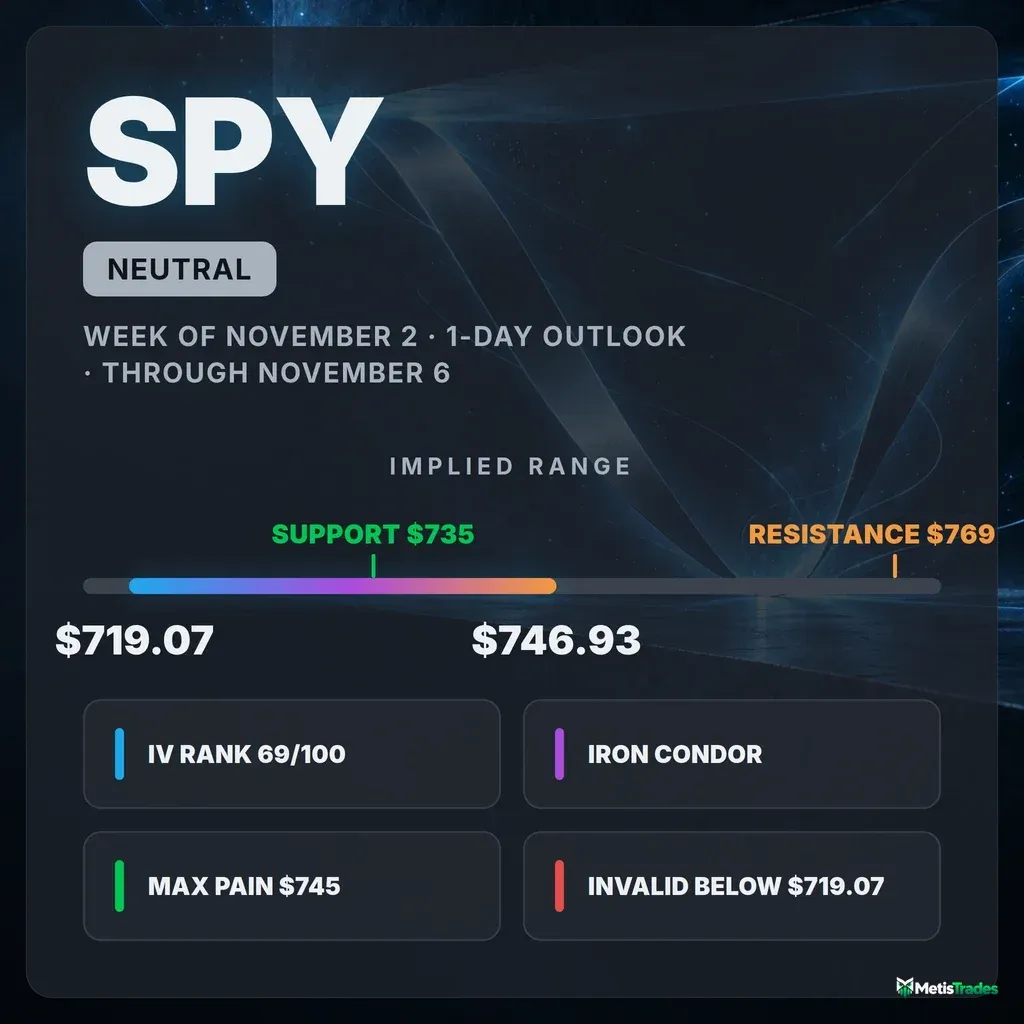
The options market implies a $719.07 to $746.93 range into the November 6 expiration. Here's what's driving it, and three defined-risk ways to trade the next session.
Published Thursday, November 5, 2026 · Data as of Thursday, November 5, 2026 close · Nightly update covering tomorrow's session (2026-11-06)
Explore the live SPY options data in the Detailed Options Analyzer →
Quick answer
| Item | Answer |
|---|---|
| Market bias | Neutral: heavy put buying reads as hedging after the drop, not as a fresh directional bet |
| Options-implied range (into Nov 6, 2026) | $719.07 – $746.93 (±$13.93, ±1.90%) |
| Major support | $735.00 put wall for Nov 6. Spot closed just below it, so the SMA200 at $730.15 is the nearest structural floor. |
| Major resistance | $769.00 call wall for Nov 6. Max pain at $745.00 is the nearer magnet. |
| Max pain (Nov 6, 2026) | $745.00 |
| Dealer gamma regime (estimate) | Negative: hedging tends to amplify moves. Flip level ≈ $715 (whole-chain estimate). |
| Volatility condition | Rising. IV rank 69/100 (ATM IV 21.86%). Premium is thin: options are priced only ~1.5 vol pts above delivered movement. |
| Technical check | Mixed (bullish, 2-day horizon, target $737.50 inside the implied range) |
| Best-fitting strategy | Narrow Nov 6 iron condor (721/724/742/745), only if you accept that the short strikes sit inside the expected move |
| Analysis invalidated if | SPY closes below $719.07 |
1 · What matters today
SPY fell about 4.4% in one session to close at $733.00. Options traders reacted by buying protection at the fastest pace this name has seen in a long while. Our read for tomorrow's session (2026-11-06) is neutral.
The flow is extremely put-heavy, but after a drop this sharp it looks like insurance being bought, not a fresh bet on more downside. The options market is pricing a move of about $13.93 either way, which puts the range at $719.07 to $746.93. That figure is the move implied by what at-the-money straddles cost.
The single most important level is $735, the biggest pile of put contracts expiring tomorrow. SPY closed just under it. A close below $719.07 would break the range thesis and point to a market where selling feeds on itself.
The one technical report we use agrees on the zone but leans a little higher, targeting $737.50.
2 · What the options market is pricing
What changed this week
Almost everything changed in one session. SPY is down 4.73% over five trading days and 5.29% over twenty, and most of that came in the move from roughly $767 on November 4 to $733.00 at the close. Share volume ran 2.69 times its 20-day average.
At-the-money implied volatility jumped 60.7% in a day, from about 13.6% to 21.86%. That is up 64.6% over five sessions and far above its 30-day average of 13.82%.
The put/call open-interest ratio, meaning how many put contracts are held open for every call, hit 5.17. Its 7-day average is 2.17 and its 14-day average is 1.82.
Our options-flow composite swung to deeply negative, versus a 7-day average that was only mildly negative. That is a one-day lurch, not a slow grind.
Among contracts that existed both days and haven't expired, the cleanest new build was the December 18 $730 puts, which added 10,573 contracts of open interest on 23,483 traded. The November 20 $725 puts shed 10,773, which looks like holders cashing in protection that had just paid off.
The short-term and month-long trend reads agree on a bearish tilt. The ~50-day read is flat, so this is a sharp pullback inside a longer trend that hasn't turned.
VIX, which tracks SPY's own implied volatility almost one-for-one, closed at 28.18, up from 16.61 the prior session. That sits in the upper sixth of its 52-week range.
Expected move
The expected move is the move the options market is pricing in, derived from what straddles cost. For the November 6 expiration it is ±$13.93 (±1.90%) around $733.00.
| Expiration | Implied move | Range around $733.00 |
|---|---|---|
| Nov 6, 2026 (next session) | ±1.90% | $719.07 – $746.93 |
| Nov 9, 2026 | ±2.69% | $713.28 – $752.72 |
| Nov 13, 2026 | ±4.06% | $703.24 – $762.76 |
| Dec 4, 2026 (~1 month) | ±6.15% | $687.92 – $778.08 |
The one-day rung is unusually large relative to the others:
- The November 6 options carry about 36% implied volatility.
- Next week's run closer to 25–27%.
- The December 4 options sit near 22%.
The market is concentrating its stress pricing right at the front of the curve.
Volatility
Implied volatility (IV) is the market's estimate of how much SPY will move, baked into option prices. At 21.86%, ATM IV sits with an IV rank of 69/100, about 69% of the way up its 52-week range. Its IV percentile is 96: today's reading is higher than about 96% of the past year's daily readings.
IV rose 60.7% on the day, 64.6% over five days, and 69.3% over thirty. The current level is well above both the 30-day average (13.82%) and the 90-day average (13.52%).
The usual front-month vs. two-month comparison is unavailable today. Comparing option prices across expiration dates directly, the near expirations are clearly priced richer than the ~60-day read of 20.35%. That inverted shape is typical of stress.
Measured against this stock's own recent history, realized movement is running far above normal:
- 20-day realized volatility is 20.36%.
- 10-day realized volatility is 27.07%.
- The last five sessions moved about 1.8 times faster than the past month's pace. That acceleration is unusually high for SPY.
Premium rich or cheap? The volatility risk premium is the gap between how much movement options are priced for and how much SPY has actually delivered. When it's positive, option sellers have been collecting more than realized movement cost them. Today, options are priced only about 1.5 vol points above SPY's 20-day realized movement. On the VRP percentile, which compares today's gap with this stock's own recent readings, that is richer than only about 39% of them.
The path matters. The gap was near 5.6 points on November 2–3, then collapsed to under 1 point on November 4 as realized movement caught up with implied. In the "vs its own norm" readings, the gap is a bit thinner than usual.
So the verdict is mixed. IV rank 69 says option prices are high in absolute terms, but a 39th-percentile premium over delivered movement says they are not especially rich relative to how violently SPY is actually moving. That argues for small, defined-risk credit structures rather than aggressive premium selling.
Skew and sentiment
Skew means puts and calls the same distance from the stock price don't cost the same. When puts are pricier, traders are paying up for crash protection.
- Skew level: 25-delta puts are trading at 28.54% IV against 17.55% for 25-delta calls. Puts are running 11.0 vol points over calls, against a 60-day norm of about 3.7 points for this name. The 7-day average is 5.9.
- Vs its own norm: that steepness is among the most extreme readings in SPY's recent history.
- Put/call volume: 2.20, meaning more than twice as many puts traded as calls. The 7-day average is 1.30 and the 14-day average is 1.16. Today's put-tilted volume is unusually heavy for SPY.
- Short-dated sentiment: sentiment in 0–7 day options scored −31, against a 7-day average of −15. The 7–30 day bucket scored −41, against −31.
- Overall regime: broadly bearish, with every maturity leaning the same way.
In plain terms, traders are paying up hard for downside protection across the whole curve. Total option volume ran at a normal 1.00 times its 20-day average. The shift came from what was traded, not how much.
The key levels map
| Level | Price | Why it matters |
|---|---|---|
| 52-week high | $781.62 | SPY sits 6.2% below it, still in the upper third of its yearly range |
| Whole-chain heaviest call strike | $770 | 21,313 call contracts open across all expirations; longer-dated overhead supply |
| Call wall (Nov 6, 2026) | $769.00 | The strike with the most open call contracts expiring tomorrow (7,905); far outside the implied range |
| 50-day / 20-day moving averages | $766.40 / $765.53 | Where SPY traded before the break; now ~4.3% overhead |
| Swing resistance | $759.20 | Heuristic pivot cluster from recent trading |
| Swing resistance | $747.69 | Pivot cluster just above the implied range's upper edge |
| Upper implied edge (Nov 6) | $746.93 | Top of the ±1σ expected move |
| Max pain (Nov 6, 2026) | $745.00 | The price where the most option value would expire worthless; expirations sometimes gravitate toward it |
| Whole-chain put wall / largest gamma strike | $740 | 239,783 put contracts across all expirations; the chain's heaviest hedging node |
| Put wall (Nov 6, 2026) | $735.00 | The biggest pile of puts expiring tomorrow (23,652); spot closed $2 below it |
| Swing resistance | $734.61 | Nearest pivot overhead, nearly on top of spot |
| Close | $733.00 | Latest close |
| 200-day moving average | $730.15 | Last major long-term trend support, $2.85 below |
| Large gamma strike | $730 | Second-heaviest gamma node in the chain |
| Large gamma strike | $725 | Another dense put-OI cluster (177,806 puts across the chain) |
| Lower implied edge (Nov 6) | $719.07 | Bottom of the ±1σ expected move; our invalidation line |
| Gamma flip (estimate) | $715 | One rough estimate of the level below which market-maker hedging tends to accelerate selling rather than cushion it |
Note that tomorrow's expiration has its own walls at $769 (calls) and $735 (puts). The whole chain's heaviest strikes sit at $770 and $740. For the next session, the November 6 levels are the ones that apply.
Positioning and unusual flow
Market makers hedge the options they've sold. One rough estimate puts both the whole chain and the November 6 expiration in a negative-gamma regime, where their hedging tends to amplify moves rather than dampen them. Treat that as an estimate built on an assumed dealer convention, not observed inventory. It is consistent with how violent the November 4–5 move was.
Three items stand out among live contracts:
- November 6 $769 calls: 19,894 traded and open interest rose by 4,866 to 7,905. They're priced at about $0.045 with near-zero odds of finishing in the money. That looks like cheap lottery tickets or closing activity, not a real upside call. It is also what makes $769 tomorrow's call wall.
- November 9 $760 calls: 13,951 contracts traded against only 1,551 open, roughly nine times the existing position. Someone is paying small premiums for a sharp rebound early next week.
- November 9 $730 puts: 11,992 traded against 2,461 open. That is heavy for its peer group (90th percentile) and adds near-dated protection right at the SMA200.
The mix of heavy near-dated puts and scattered cheap calls fits a market buying insurance while leaving a small bet on a snap-back.
3 · Technical check
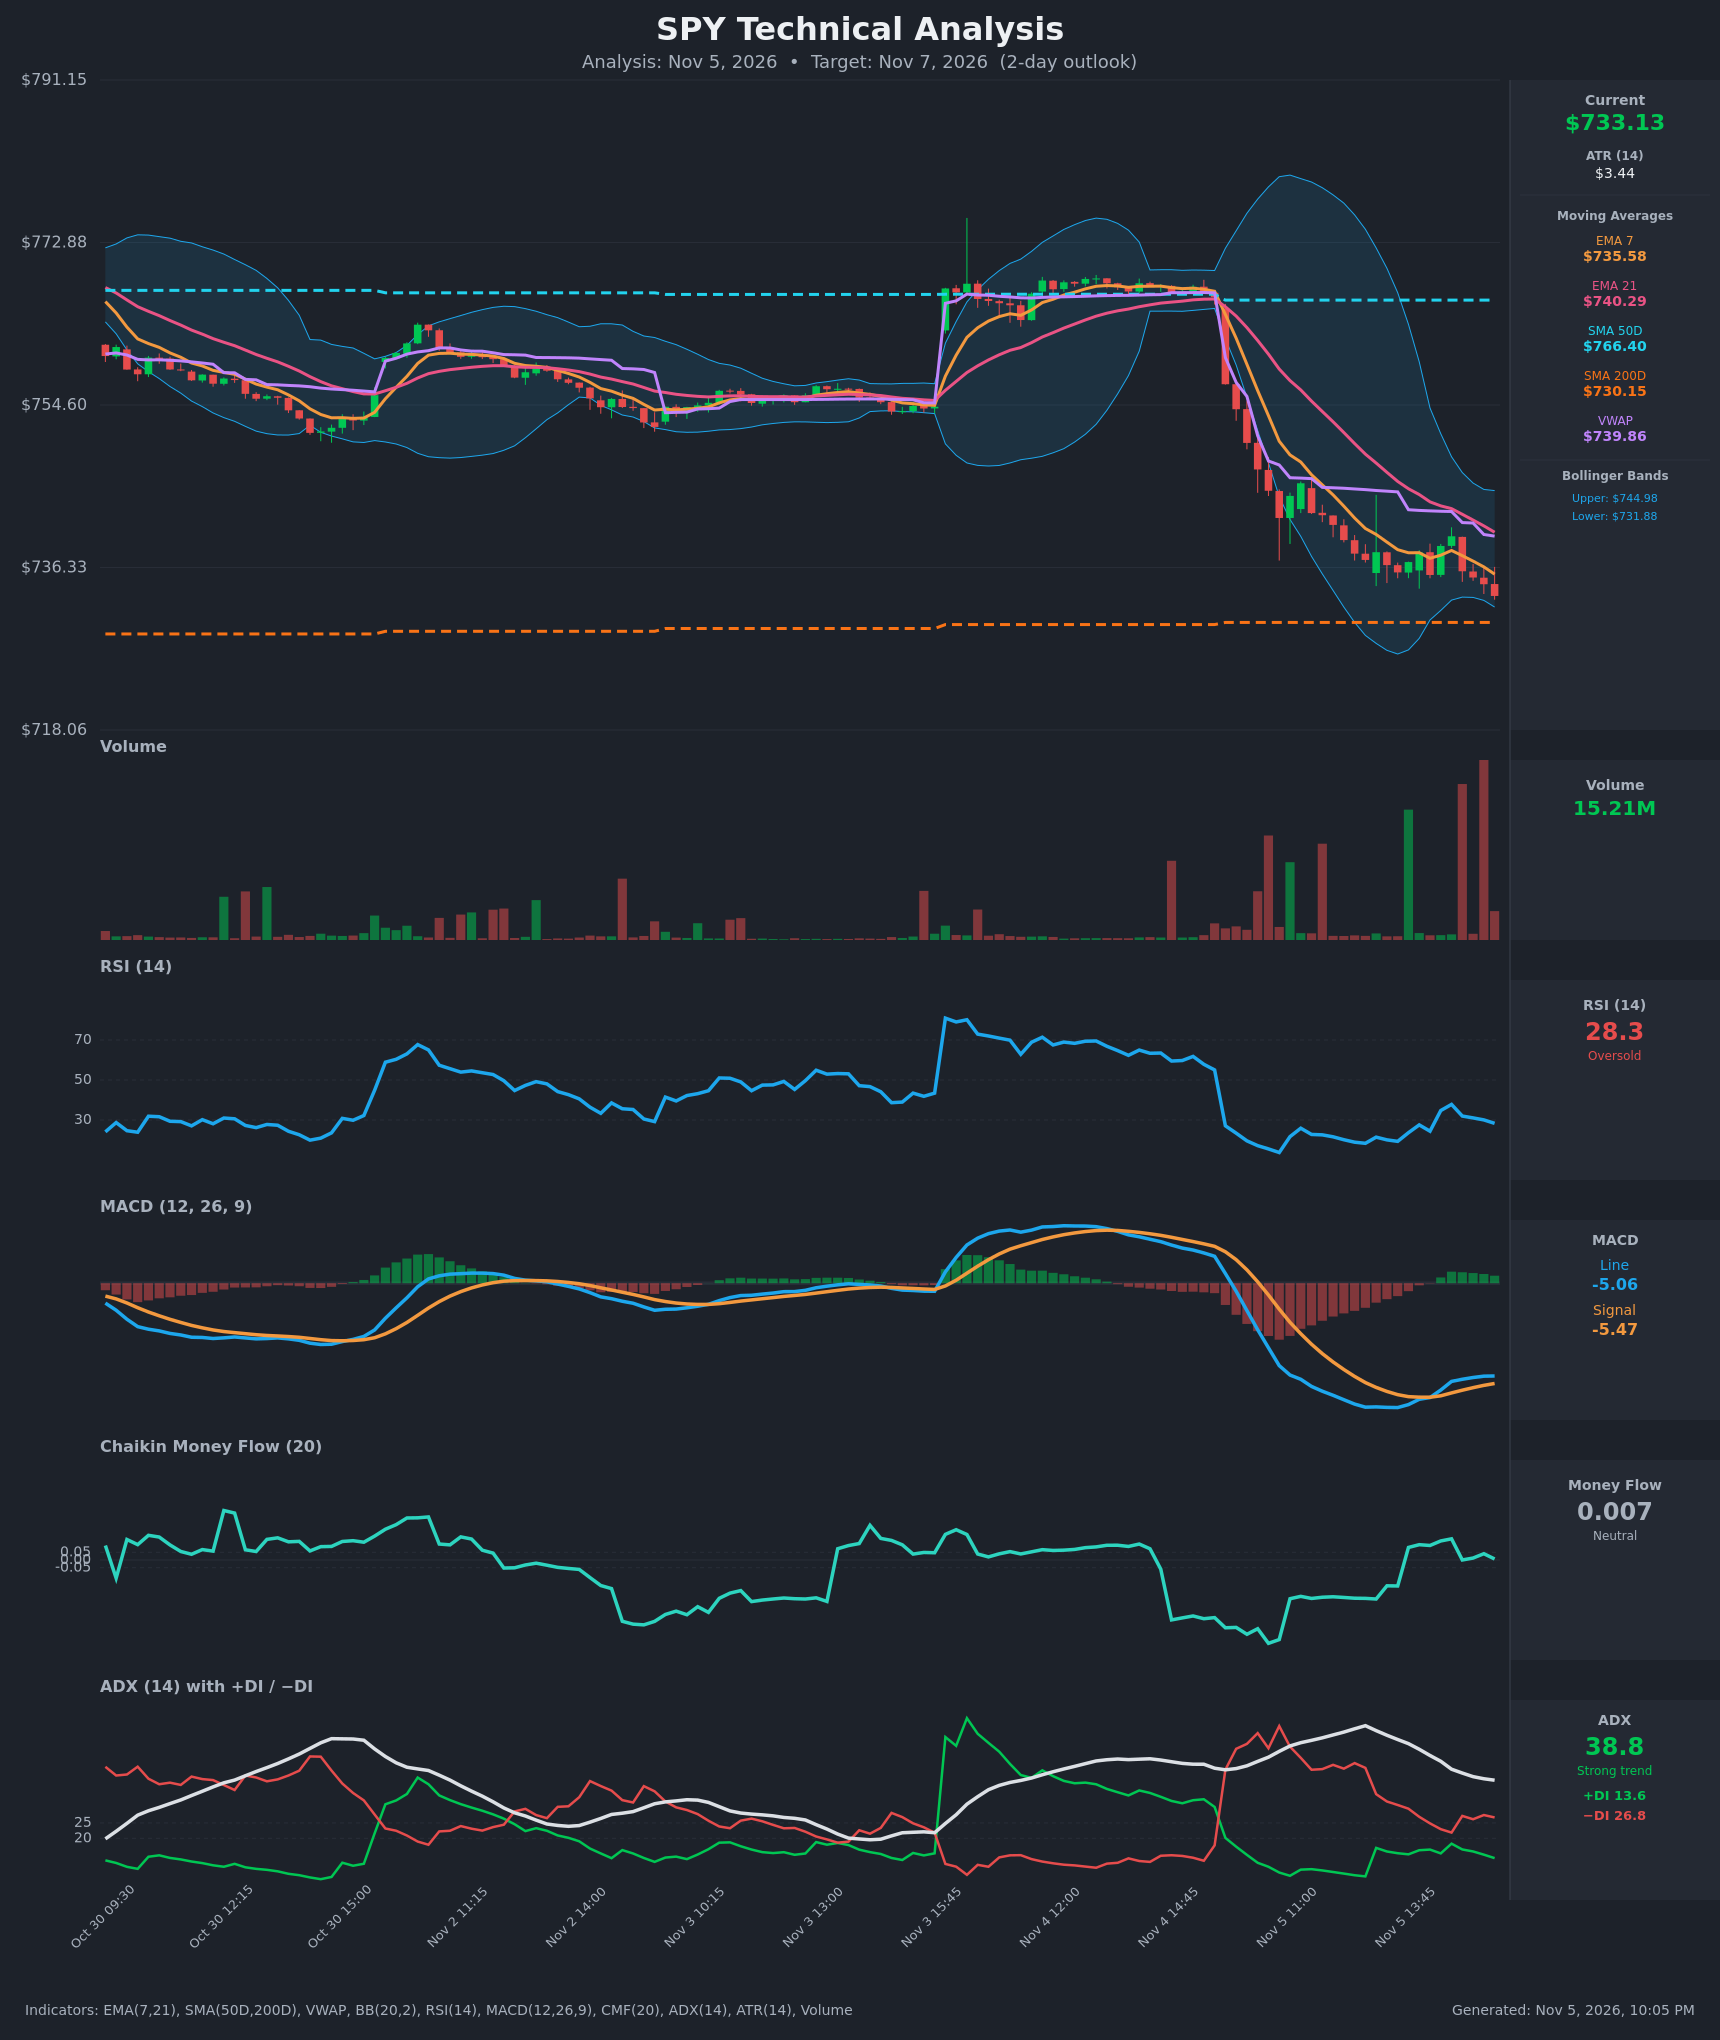
The one technical report for this window (2-day horizon, generated the same evening off a $733.13 reference) is bullish. It targets $737.50 with a projected range of $723.00 to $745.00.
Its case rests on oversold momentum right on top of the SMA200:
- RSI is near 28 and made a higher low while price made a lower low.
- MACD just crossed up.
- ADX near 39 with sellers' DI still dominant shows the downtrend hasn't been reversed.
It flags support at $730.15 and resistance at $740.29 (EMA21/VWAP). Its dominant bounce scenario is invalidated on a close below $730.15.
Against our neutral read, this is Mixed. The direction leans higher than ours, but the target sits comfortably inside the options-implied range, and the model's own range ($723 to $745) nests almost entirely inside the market's $719.07 to $746.93. Both readings describe a range-bound session with a slight pull toward the $735–$745 zone, where the put wall and max pain sit.
Model vs. Market: The options market implies $719.07 to $746.93; the 2-day technical model targets $737.50. The gap is small, about $4.50 above spot and well inside one expected move, so the two agree that a range is more likely than a breakout. A close back above the $735 put wall would tilt the session toward the model's target.
Full technical write-up: next-session report →
The TA nudged strike selection in one place. The condor's call side is shaded up to a $742 short strike so the model's $737.50 target sits safely inside the profit zone.
4 · Three ways the next session can go
If SPY pushes back above the put wall and toward max pain ($735 to $745): Reclaiming $735 would put spot back above tomorrow's heaviest put strike. Hedgers who bought that protection may start unwinding, and that unwinding can feed a relief move. Max pain at $745 sits near the top of the implied range. Above the $746.93 upper edge, positioning thins out until swing resistance at $747.69 and then $759.20. The $769 call wall is too far away to matter for one session.
If SPY drifts between $730 and $735: This is the pin case. Spot is wedged between the SMA200 ($730.15) and the November 6 put wall ($735), with a heavy gamma node at $730. Expiring open interest at those strikes can hold price in a tight band into the close. That is the outcome a narrow condor is built for.
If SPY breaks below the SMA200 and the implied floor ($730.15, then $719.07): This is the acceleration case. The estimated negative-gamma regime means market-maker hedging tends to add to selling rather than absorb it. The dense put clusters at $725 and below can turn from cushions into fuel. A close under $719.07 would take SPY outside the market's one-sigma range and toward the rough $715 gamma-flip estimate. That breaks our neutral read.
5 · Three defined-risk structures
Prices are end-of-day midpoints as of November 5, 2026. All structures are hypothetical. Verify live prices before trading, because these will be stale by the open. Every structure expires November 6, 2026, so each one is a one-session trade with fast time decay and high sensitivity to small moves.
If you lean bullish: Nov 6 $735/$740 call debit spread
A debit spread means you pay up front and profit if SPY rises toward the short strike.
- Trade: Buy Nov 6 $735 call ($4.385), sell Nov 6 $740 call ($2.385)
- Debit: $2.00 · Max profit: $3.00 ($300 per spread) · Max loss: $2.00 ($200) · Break-even: $737.00
- Why it fits: it pays if SPY reclaims the $735 put wall and drifts toward max pain at $745. The TA target of $737.50 sits just above break-even.
- Makes sense only if: SPY holds above the SMA200 at the open and starts working back above $735.
- Invalidated if: SPY closes below $730.15.
- Managing it: take profits near $740 rather than waiting for expiration. If SPY loses $730 intraday, close the spread instead of hoping for a late bounce. With the short-term trend still pointing down, early profit-taking beats holding to the bell.
- Liquidity note: the $735 calls quoted 3¢ wide ($4.37/$4.40) and the $740 calls 5¢ wide ($2.36/$2.41), so fills are easy.
- Analyze this position →
If you expect the range to hold: Nov 6 $721/$724/$742/$745 iron condor
An iron condor means you collect a credit and keep it if SPY stays between the two short strikes through expiration.
- Trade: Sell Nov 6 $724 put ($2.56) / buy $721 put ($1.925); sell Nov 6 $742 call ($1.795) / buy $745 call ($1.13)
- Credit: $1.30 · Max profit: $1.30 ($130) · Max loss: $1.70 ($170) · Break-evens: $722.70 and $743.30
- Why it fits: IV rank 69 and puts priced 11 vol points over calls make the put side well paid. The profit zone covers the SMA200, the $735 put wall and the TA target. The long $745 call sits on max pain.
- Makes sense only if: you accept that both short strikes sit inside the ±$13.93 expected move. The chain doesn't list November 6 puts below $721, which limits how far out the put side can go. This is a tight-range bet, not a wide one. Premium over delivered movement is also thin (39th percentile), so you are not being overpaid for that risk.
- Invalidated if: SPY closes below $719.07 or above $746.93.
- Managing it: close at about 50% of the credit if SPY settles into the $730–$738 band early. If either short strike ($724 or $742) trades intraday, close the threatened side rather than ride a negative-gamma move.
- Liquidity note: the $724 puts quoted 4¢ wide, the $721 puts 5¢, the $742 calls 7¢ (about 3.9% of mid), and the $745 calls 2¢. Work the order near mid.
- Analyze this position →
If you lean bearish: Nov 6 $730/$725 put debit spread
You pay up front and profit if SPY falls toward the short put.
- Trade: Buy Nov 6 $730 put ($4.39), sell Nov 6 $725 put ($2.80)
- Debit: $1.59 · Max profit: $3.41 ($341) · Max loss: $1.59 ($159) · Break-even: $728.41
- Why it fits: it targets the break of the SMA200 into the dense $725 gamma node. Selling the $725 put recovers some of the steep skew you'd otherwise pay for, and in an estimated negative-gamma regime a break can travel quickly.
- Makes sense only if: SPY fails to reclaim $735 and slips back under $730.
- Invalidated if: SPY closes above $735.00.
- Managing it: take profits near $725 instead of holding for the full width. Exit if SPY reclaims the $735 put wall. The short-term trend favors this side, but the ~50-day read is flat, so don't overstay.
- Liquidity note: the $730 puts quoted 6¢ wide ($4.36/$4.42) and the $725 puts 6¢ wide ($2.77/$2.83), so fills are tight.
- Analyze this position →
If none of these: no trade
Standing aside is a legitimate call tomorrow. All three structures are one-day trades in a regime where hedging is estimated to amplify moves. Realized movement is running at roughly 1.8 times its own monthly pace.
The premium on offer over delivered movement is thin, so sellers aren't getting a cushion. The skew makes downside bets expensive.
If you can't watch the screen through the session, the gap risk on a single expiration outweighs the edge. Waiting for next week's expirations, priced at lower implied volatility, is a reasonable alternative.
6 · Quick FAQ
What is SPY's expected move for the next session? About ±$13.93 (±1.90%) into the November 6, 2026 expiration. That is a range of $719.07 to $746.93, per straddle pricing as of the November 5 close.
Is SPY expected to go up or down tomorrow? Options positioning as of November 5 reads neutral. Put buying is extreme, but it looks like protection after a 4.4% drop rather than a fresh bearish bet. That is a read of what traders have done, not a forecast. The actionable map is the $719.07 to $746.93 range, with the $735 put wall and $745 max pain as the levels to watch.
Are SPY options expensive right now? IV rank 69/100 puts option prices about 69% of the way up their past-year range. They're running only about 1.5 vol points above the movement SPY has actually delivered, richer than just 39% of its own recent readings. They are expensive in absolute terms but not rich relative to how hard SPY is moving.
Where is SPY's biggest options support and resistance for November 6? The put wall is $735.00, which spot closed just below. The call wall is $769.00. Max pain is $745.00.
What invalidates this read? A close below $719.07, the bottom of the options-implied range.
Methodology & disclosures. Data: end-of-day options-chain snapshot for SPY, 2026-11-05, generated 2026-11-05T22:05:41.372Z. Prices shown are midpoints and will differ from live markets. Momentum/positioning scores and volatility-premium comparisons are descriptive measurements of past option flow and past price movement — not investment advice, signals, forecasts, or guarantees. All trade structures are hypothetical. Every structure shown has a defined maximum loss; you can lose the entire max-loss amount. Options involve substantial risk and are not suitable for all investors.