SPY Options Outlook: Will the $775 Call Wall Cap Tomorrow's Session?
SPY options price a ±$3.95 move into the October 6 expiration, a $770.88–$778.78 range, with the stock parked right at that expiration's $775 call wall. Options flow leans slightly bullish while the chart model leans the other way. Here is the level map and three defined-risk ways to trade the next session.
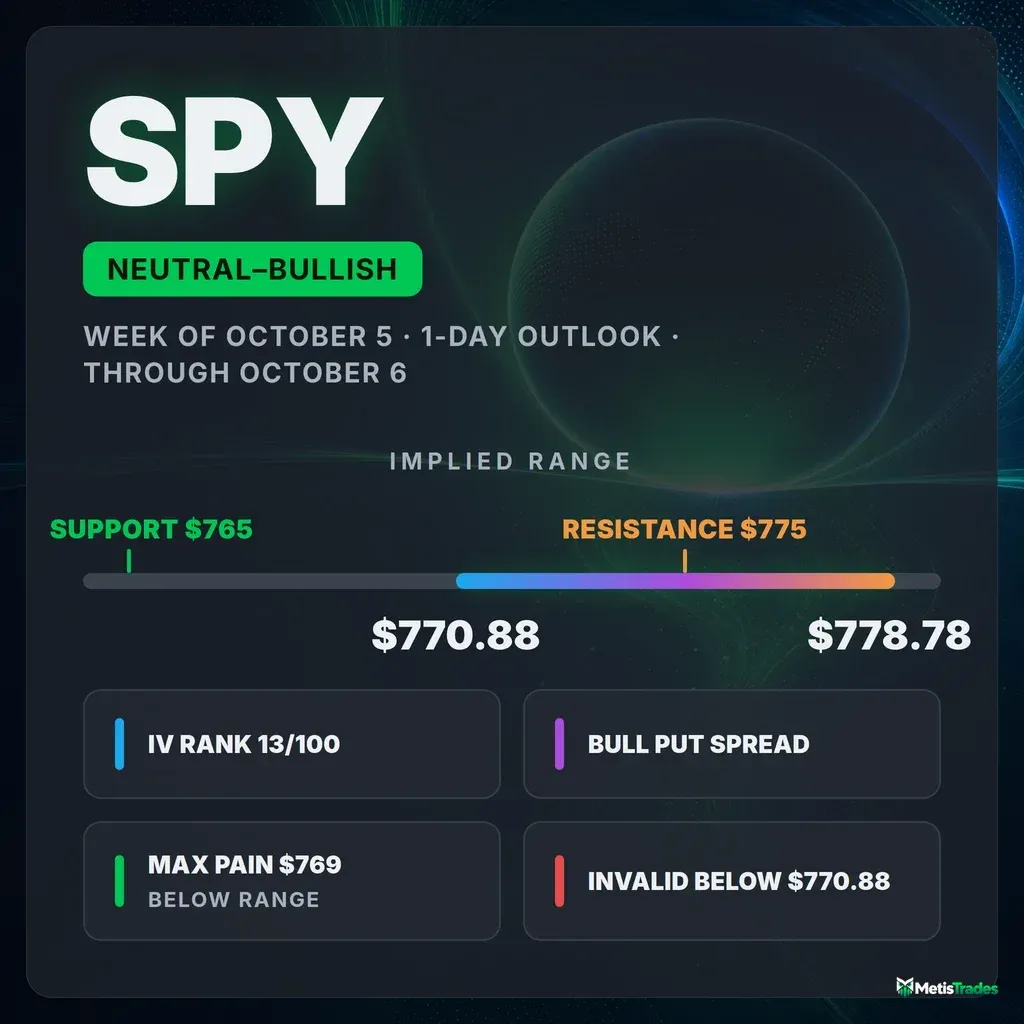
The options market implies a $770.88–$778.78 range into the October 6 expiration. Here's what's driving it, and three defined-risk ways to trade the next session.
Published Monday, October 5, 2026 · Data as of Monday, October 5, 2026 close
Explore the live SPY options data in the Detailed Options Analyzer →
Quick answer
| Item | Answer |
|---|---|
| Market bias | Neutral with a bullish tilt |
| Options-implied range (into October 6) | $770.88 – $778.78 (±$3.95, ±0.51%) |
| Major support | $765.00 (October 6 put wall) |
| Major resistance | $775.00 (October 6 call wall) |
| Max pain (October 6) | $769.00 |
| Dealer gamma regime (estimate) | Positive: hedging tends to dampen moves. Flip level ≈ $725 |
| Volatility condition | Neutral (slightly firmer over 5 days). IV rank 12.53/100. Premium is fair: options are priced about 2.5 vol pts above delivered movement |
| Technical check | Diverges (bearish, next-session chart model: target $772.90, range $767.00–$782.50) |
| Best-fitting strategy | Bull put credit spread below the expected-move floor (conditional on SPY holding $770.88) |
| Analysis invalidated if | SPY closes below $770.88 |
1 · What matters today
SPY closed at $774.83. Our read of options positioning is neutral with a bullish tilt: traders bought calls and let puts lapse over the past week, so the flow leans higher. The catch is location. SPY is sitting almost exactly on $775, the strike with the biggest pile of open call contracts for the October 6 expiration. Strikes like that often act like a ceiling.
The options market is pricing a move of about $3.95 either way for the next session, a range of $770.88 to $778.78. That figure is the expected move: the move the options market is pricing in, derived from what straddles cost.
The level that changes the picture is $770.88. A close below it breaks the bullish lean. The chart model points the other way, toward a dip to $772.90. Even that dip stays inside the priced range.
2 · What the options market is pricing
What changed this week
SPY rose 0.45% over the past five sessions. It climbed from $762.63 on September 30 to today's $774.83 and now sits less than 0.6% below its 52-week high of $779.37.
The bigger story is in open interest (contracts currently held open). The put/call open-interest ratio fell from 0.75 to 0.53 over five sessions. That means there are now about 0.53 puts open for every call, versus a 7-day average of 0.91 and a 14-day average of 1.02. Traders let downside protection roll off at a fast clip.
Implied volatility (the market's estimate of how much SPY will move, baked into option prices) firmed about 4.9% over five days. It is still below its 90-day average.
Two forward-looking open-interest moves stand out, both in the October 9 puts:
- The $765 puts added 10,943 contracts, to 13,199.
- The $767 puts added 10,031, to 46,642.
So even as overall put interest thinned, someone built a protective floor just under the market for later this week.
Today's headline call build of roughly 388,000 contracts includes the October 9 $787 call. That contract line wasn't in the prior snapshot, so treat its jump cautiously rather than as pure new buying. Into today's settled October 5 expiration, the $772 calls had added 12,328 contracts of open interest, now settled history.
The short-, medium- and long-term trend reads all agree on "flat": no clear trend, just a grind that has added about 5% over the past two and a half months.
Expected move
For the October 6 expiration, at-the-money options imply a move of ±0.51%, or about ±$3.95 from $774.83. That gives a range of $770.88 to $778.78. Note that this one-day expiration's own at-the-money IV is only about 9.8%, well below the 12.97% headline IV.
| Expiration | Implied move | Range around $774.83 |
|---|---|---|
| October 6 | ±0.51% | $770.88 – $778.78 |
| October 7 | ±0.75% | $769.02 – $780.64 |
| October 9 | ±1.14% | $766.00 – $783.66 |
| November 6 (~1 month) | ±3.89% | $744.69 – $804.97 |
The ladder widens smoothly with time, with no sudden step-up. That says the options market isn't bracing for any single scheduled shock inside the next few sessions.
Volatility
Headline at-the-money IV is 12.97%. IV rank is 12.53/100 (where today's IV sits versus the past year), meaning implied volatility is cheaper than about 87% of the past year's readings. The IV percentile of 19 tells the same story.
Direction is mixed:
- IV edged up 0.3% on the day and 4.9% over five days.
- It is down 2.6% over 30 days.
- It sits about level with its 30-day average (12.85%) and below its 90-day average (13.79%).
The front-month term-structure read (comparing option prices across expiration dates) is unavailable today because the nearest contract expired this session. The ~2-month IV sits at 13.64%, a little above today's headline figure.
Realized movement has quieted. Measured against this stock's own recent history, the past week's moves have been noticeably calmer than the past month's. Ten-day realized volatility is 8.3%, versus 10.5% over 20 days.
Premium rich or cheap? Look at the volatility risk premium: the gap between how much movement options are priced for and how much SPY has actually delivered. When it's positive, option sellers have been collecting more than realized movement cost them.
- Options are priced about 2.5 vol points above SPY's 20-day realized volatility of 10.5%.
- That gap sits at the 59th percentile, richer than 59% of this stock's own recent readings. That's close to typical for SPY, not stretched.
- The gap has drifted down from about 3.3 points on October 1.
The combination of IV rank 12.53 and a middle-of-the-pack premium over delivered movement is a fair, not generous, environment for selling premium. Credit structures work, but they don't pay much. Defined risk and tight strikes matter more than usual.
Skew and sentiment
Skew means that puts and calls the same distance from the stock price don't cost the same; when puts are pricier, traders are paying up for crash protection.
- Skew is flatter than normal. Puts priced 25 delta out-of-the-money carry about 13.7% IV versus 10.7% for comparable calls, a gap of 3.1 vol points. SPY's 60-day norm is 3.8 points. Traders are paying a bit less than usual for crash protection, which reads as calm, even complacent, positioning.
- Volume leans to calls. The put/call volume ratio (how much put activity there is relative to calls; above 1 means puts dominate) was 0.90. That is below its 7-day average of 0.98 and its 14-day average of 0.99.
- Call sweeps were unusually heavy. The number of call contracts trading at unusually heavy volume compared with similar contracts outpaced puts 30 to 21. That's an unusually call-heavy reading for SPY versus its own recent history. "Unusual" here means unusual for SPY, not versus the broader market.
- Short-dated sentiment leans mildly bullish, but the curve is mixed. The 0–7 day expirations score +24 and the 7–30 day expirations +16, both in line with their 7-day averages of +25 and +16. The 30–60 day expirations lean bearish at −38, where put open interest and put-side flow dominate. The near term leans up; the further-out window carries more hedging.
The key levels map
| Level | Price | Why it matters |
|---|---|---|
| Whole-chain call wall | $787 | Heaviest call open interest across all expirations (mostly October 9); a distant upside magnet |
| Largest gamma strike | $785 | Most hedging-sensitive strike in the chain |
| Gamma strike | $780 | Third-largest gamma concentration; heavy October 9 call interest |
| 52-week high | $779.37 | The ceiling of the year's range, just above the implied top |
| Expected-move top (October 6) | $778.78 | Upper edge of what options price for the session |
| Swing resistance | $776.14 | Recent pivot high; the chart model's rejection zone |
| Call wall (October 6) | $775 | Biggest open call stack for the session; spot is pinned just under it |
| Spot | $774.83 | Today's close |
| Expected-move floor (October 6) | $770.88 | Lower edge of the priced range; this article's invalidation level |
| Gamma strike | $770 | Large combined call and put open interest |
| Max pain (October 6) | $769 | Where the most option value would expire worthless; expirations sometimes gravitate toward it |
| Whole-chain put wall | $767 | Heaviest put open interest across all expirations, led by the October 9 $767 puts |
| Put wall (October 6) | $765 | Biggest open put stack for the session; also near the 20-day average ($765.06) |
| 50-day moving average | $764.42 | Intermediate trend support |
| Swing support | $757.76 | Nearest recent pivot low |
| 100-day moving average | $754.74 | Deeper trend support |
| Gamma flip (estimate) | $725 | One rough estimate of where hedging shifts from cushioning to amplifying moves |
| 200-day moving average | $720.95 | Long-term trend line |
The October 6 walls ($775 call, $765 put) differ from the whole-chain walls ($787 call, $767 put). For the next session, the October 6 levels are the ones that matter.
Positioning and unusual flow
Market makers hedge the options they've sold. One rough estimate puts both the October 6 expiration and the chain as a whole in positive dealer gamma, a regime where their hedging tends to dampen moves. The estimated gamma-flip level (below which hedging tends to accelerate selling rather than cushion it) sits around $725, far below spot. That backdrop favors a contained, pin-prone session.
The notable flow:
- Same-day-style put trading at the money for October 6. About 75,800 of the $774 puts (roughly $9.2 million in premium) and 74,800 of the $775 puts (about $12.2 million) traded against only a few hundred contracts of open interest each. The $776 puts traded 37,376 against 86 open. That is short-term hedging and trading around the call wall, not long-dated bearish conviction.
- October 9 upside calls. The $785 calls traded 242,768 contracts (about $11.5 million) and carry 109,589 open. Someone is positioned for an upside test later in the week.
- October 9 put floor. The $765 and $767 puts added roughly 10,000–11,000 contracts each. This is defined downside protection right where the walls sit.
3 · Technical check
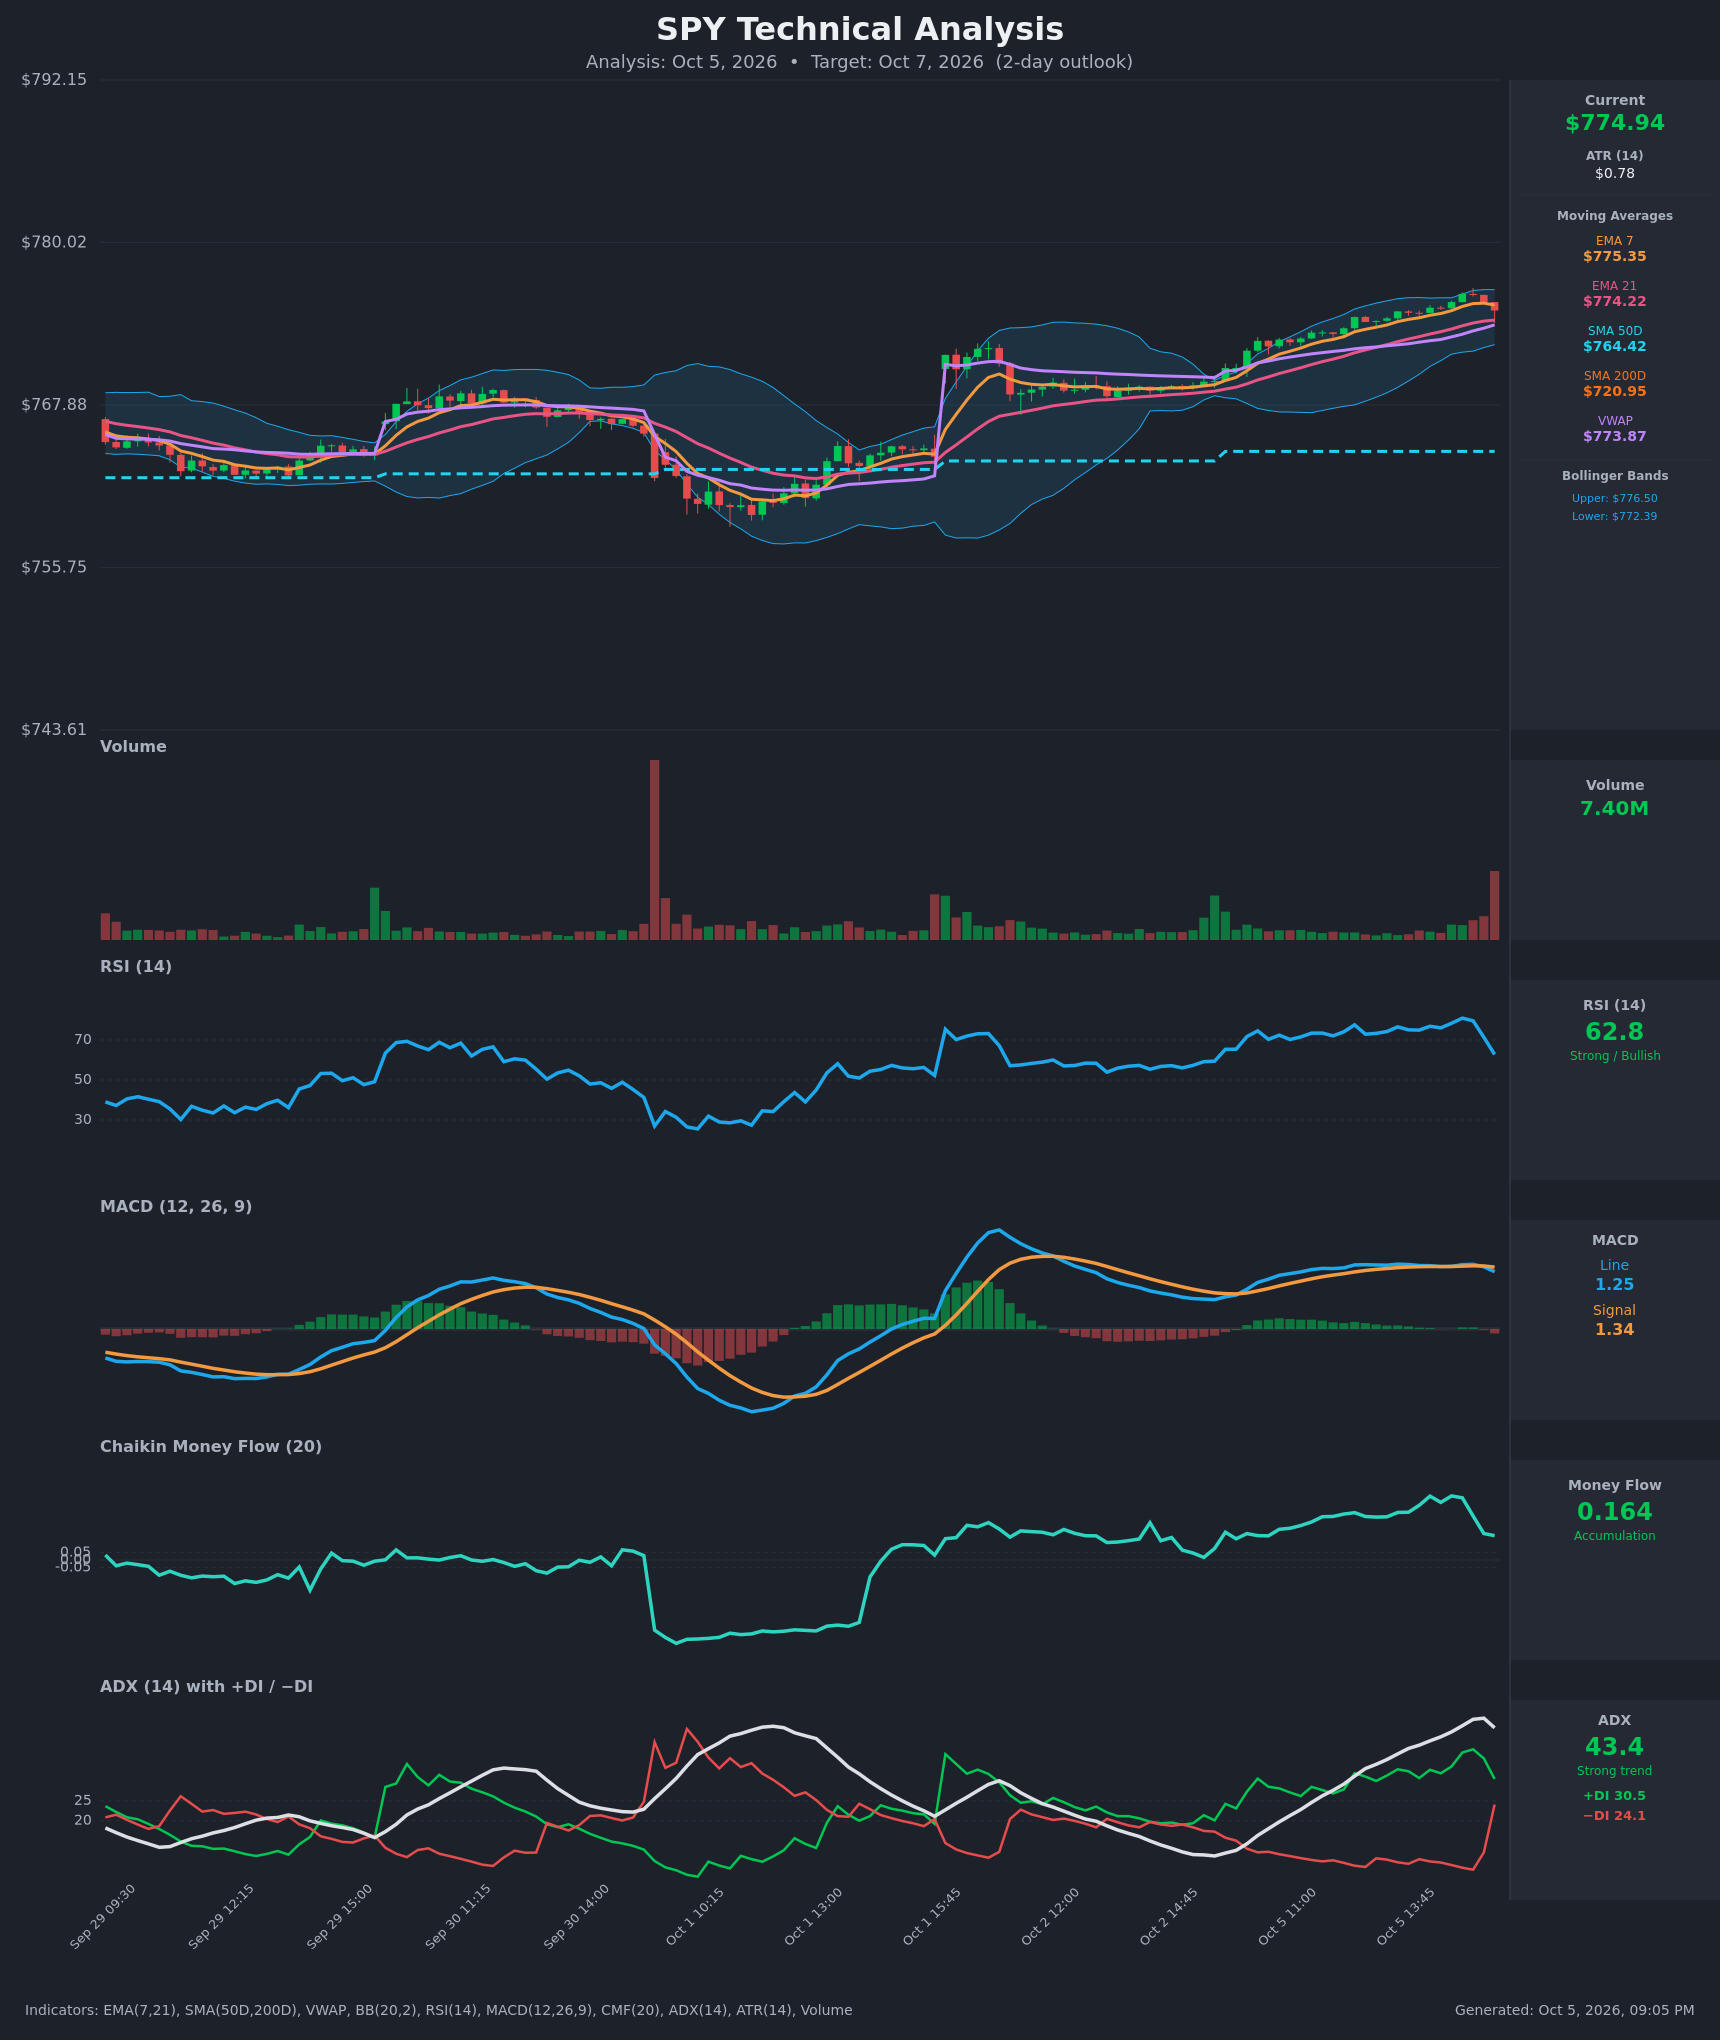
The next-session technical model, aimed at October 6, is bearish. It targets $772.90 within a projected range of $767.00 to $782.50. That diverges from the options lean on direction. The target itself still lands inside the options-implied $770.88–$778.78 band, so the disagreement is about tilt, not magnitude.
The two most decisive reads:
- A fresh bearish MACD crossover.
- A fast slide in RSI from overbought (about 81 down to 63), capped by a high-volume down bar near the session high.
The model's levels are support at $774.22 (with VWAP at $773.87 and the lower band at $772.39 beneath) and resistance at $776.50. Its dominant pullback scenario is invalidated by a reclaim of $776.20 on solid volume.
Model vs. Market: The options market implies $770.88–$778.78 into October 6; the next-session technical model targets $772.90. A dip to $772.90 would be an ordinary day by options standards. It would also bring the bull put spread below within $2 of its short strike, so the gap is worth respecting: a close under $770.88 would mean the chart model was right and the flow lean was wrong.
This divergence shaped strike selection. The bullish structure's short strike sits at $771, below the chart model's $772.90 target rather than at it. The bearish spread's short strike sits near the model's lower-band extension.
Full technical write-up: next-session report →
4 · Three ways the session can go
If SPY pushes above the call wall ($775): The heaviest October 6 call stack sits right at spot, and in a positive-gamma regime that open interest tends to slow rallies. A clean push through leaves swing resistance at $776.14, the expected-move top at $778.78 and the 52-week high at $779.37 as the next markers. Beyond that sits the heavy October 9 call interest at $780 and $785.
If SPY drifts between the walls: This is the pin case. With dealer hedging estimated to dampen moves and spot hugging $775, the path of least resistance on an expiration day is a quiet drift. Max pain at $769 sits below spot and could exert a mild downward pull toward the close, though it is outside the expected-move range on the downside.
If SPY breaks below the put wall ($765): That would require a move roughly two and a half times the priced expected move. Below $765, the 50-day average at $764.42 and swing support at $757.76 come into play. The gamma-flip estimate (~$725) is far enough away that, by one rough estimate, hedging should still cushion rather than amplify selling. A break would still mean the week's put buyers at $765–$767 were right.
5 · Three defined-risk structures
Prices are end-of-day midpoints as of October 5, 2026. All structures are hypothetical unless flagged as an entered position. Verify live prices before trading; these will be stale by the open.
If you lean bullish: bull put credit spread
Mechanics: you collect a premium up front and keep it if SPY stays above the short strike at expiration.
- Trade: Sell the October 6 $771/$769 put credit spread (sell the $771 put at $0.465, buy the $769 put at $0.255)
- Credit: $0.21 ($21 per spread) · Max profit: $21 · Max loss: $179 · Break-even: $770.79
- Why it fits:
- Put open interest thinned sharply (put/call open-interest ratio down to 0.53).
- Call sweeps were unusually heavy.
- Dealer hedging is estimated to dampen moves.
- The short strike sits just below the $770.88 expected-move floor and below the chart model's $772.90 target, with max pain at $769 as the long strike.
- Makes sense only if: SPY holds above $770.88 through the session.
- Invalidated if: SPY closes below $770.88.
- Managing it:
- Close at about 50% of the credit if SPY firms early.
- With one day to expiration, exit before the final hour rather than gamble on the settlement print.
- If SPY trades through $771, close rather than hope.
- Liquidity note: The $771 puts quoted $0.46/$0.47 and the $769 puts $0.25/$0.26. Both are a penny wide, though that penny is about 4% of the cheaper leg's mark, so use limit orders at the midpoint.
- Analyze this position →
If you expect the range to hold: iron condor
Mechanics: you sell a put spread and a call spread at the same time, collecting premium. You profit if SPY finishes between the two short strikes.
- Trade: Sell the October 6 $770/$768 put spread ($0.345 / $0.195) and the October 6 $779/$781 call spread ($0.295 / $0.105)
- Credit: $0.34 ($34 per condor) · Max profit: $34 · Max loss: $166 · Break-evens: $769.66 and $779.34
- Why it fits:
- Both short strikes sit just outside the $770.88–$778.78 expected move.
- The positive-gamma estimate and the $775 call wall argue for a contained, pin-prone expiration.
- Premium over delivered movement is fair (59th percentile), not thin.
- Makes sense only if: SPY stays inside its priced range, with no expansion in volatility overnight.
- Invalidated if: SPY closes below $770.88 or above $778.78.
- Managing it: Take 50% of the credit if it's available. Close the threatened side if SPY touches either short strike. Don't hold into the final minutes.
- Liquidity note: The $770 puts ($0.34/$0.35) and $779 calls ($0.29/$0.30) are a penny wide. The $781 calls ($0.10/$0.11) and $768 puts ($0.19/$0.20) are also a penny wide, but that penny is about 5–10% of their marks. Expect some slippage and enter as a single four-leg limit order.
- Analyze this position →
If you lean bearish: bear put debit spread
Mechanics: you pay a premium up front for a put spread that gains value if SPY falls toward the lower strike.
- Trade: Buy the October 6 $774 put ($1.215), sell the October 6 $771 put ($0.465)
- Debit: $0.75 ($75 per spread) · Max profit: $225 · Max loss: $75 · Break-even: $773.25
- Why it fits:
- The chart model targets $772.90.
- Spot is pinned under the $775 call wall.
- Max pain at $769 sits below.
- Cheap IV (rank 12.53) makes buying premium inexpensive.
- Makes sense only if: SPY fails at $775 and slips toward VWAP and the chart model's lower band.
- Invalidated if: SPY closes above $776.14.
- Managing it:
- Take profits near $772 rather than waiting for the full $771.
- Cut the trade if SPY reclaims $776.
- Exit by midday if nothing has happened, because time decay on one-day options is steep.
- Liquidity note: The $774 puts quoted $1.21/$1.22 (a penny wide, under 1% of mark) and the $771 puts $0.46/$0.47. Fills should be easy.
- Analyze this position →
If none of these: no trade
Standing aside is a legitimate call here, for three reasons:
- Thin pay. IV rank of 12.53 means credit structures pay little. The bull put spread risks $179 to make $21, and a single gap through the short strike erases many winning sessions.
- Mixed signals. The options lean is only a tilt, and the chart model points the other way.
- Location. Spot is sitting on the call wall the day before expiration, where one-day options swing quickly in either direction.
If you don't have a view on whether $775 caps or breaks, waiting for the October 9 expiration, where the walls are farther apart, may offer better risk/reward than forcing a one-session trade.
6 · Quick FAQ
What is SPY's expected move for the next session? About ±$3.95 (±0.51%) into the October 6 expiration, a $770.88–$778.78 range, per straddle pricing as of the October 5 close.
Is SPY expected to go up or down tomorrow? Options positioning as of October 5 leans neutral with a bullish tilt, because put open interest thinned and call sweeps were heavy. That's a read of what traders have done, not a forecast. The actionable map is the $770.88–$778.78 range, $765 support and $775 resistance.
Are SPY options expensive right now? No. IV rank of 12.53/100 means option prices are lower than about 87% of the past year's readings. They're running about 2.5 vol points above the movement SPY has actually delivered, which is richer than 59% of this stock's own recent readings: fair, not rich.
Where is SPY's biggest options support and resistance? For the October 6 expiration, the put wall is $765 and the call wall is $775. Max pain is $769.
What invalidates this read? A close below $770.88.
Methodology & disclosures. Data: end-of-day options-chain snapshot for SPY, 2026-10-05, generated 2026-10-05T21:05:13.259Z. Prices shown are midpoints and will differ from live markets. Momentum/positioning scores and volatility-premium comparisons are descriptive measurements of past option flow and past price movement — not investment advice, signals, forecasts, or guarantees. All trade structures are hypothetical. Every structure shown has a defined maximum loss; you can lose the entire max-loss amount. Options involve substantial risk and are not suitable for all investors.