SPY Options Price a $3.90 Move Into the Oct. 7 Expiry: Key Levels and Defined-Risk Trade Ideas
SPY options imply a $775.19–$782.99 range into the October 7 expiration, with a $782 call wall overhead and a $772 put wall below. Our positioning read is neutral, and the next-session chart model leans modestly lower.
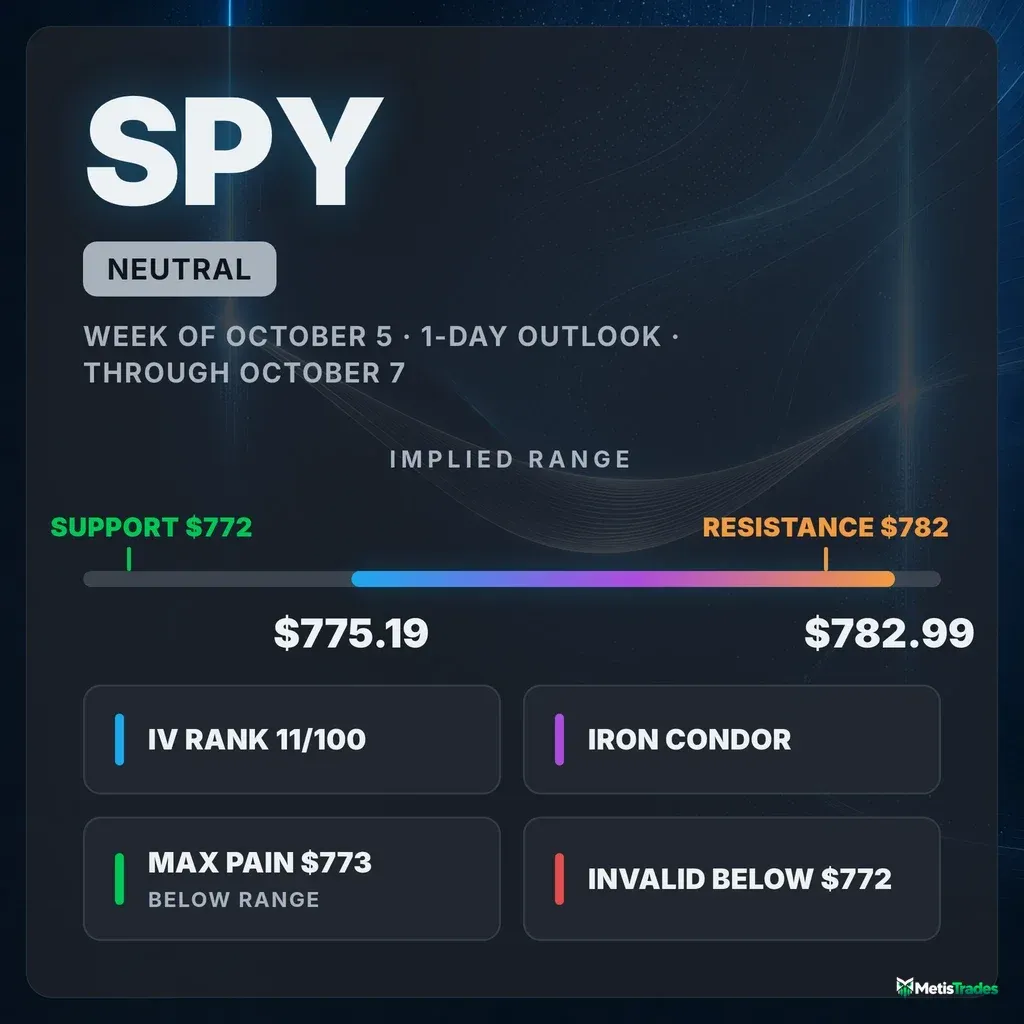
The options market implies a $775.19–$782.99 range into the October 7 expiration. Below is what's driving it and three defined-risk ways to trade it.
Published Tuesday, October 6, 2026 · Data as of Tuesday, October 6, 2026 close
Explore the live SPY options data in the Detailed Options Analyzer →
Quick answer
| Item | Answer |
|---|---|
| Market bias | Neutral |
| Options-implied range (into October 7) | $775.19 – $782.99 (±$3.90, ±0.50%) |
| Major support | $772.00 (put wall, October 7 expiration) |
| Major resistance | $782.00 (call wall, October 7 expiration) |
| Max pain (October 7) | $773.00 |
| Dealer gamma regime (estimate) | Positive: hedging tends to dampen moves. Flip level ≈ $725 |
| Volatility condition | Falling. IV rank 11/100, ATM IV 12.73%. Premium is fair: options are priced about 2.3 vol pts above delivered movement |
| Technical check | Mixed (bearish, 2-day chart model targeting $777.50 by October 7) |
| Best-fitting strategy | Iron condor on the October 7 expiration (short strikes just outside the implied range) |
| Analysis invalidated if | SPY closes below $772.00 |
1 · What matters today
SPY closed at $779.09, a whisker under its 52-week high of $781.62. Our read of options positioning for tomorrow's session (2026-10-07) is neutral.
The single biggest reason is that the October 7 expiration is boxed in by open interest (contracts currently held open):
- The heaviest call strike sits at $782 and the heaviest put strike at $772.
- A rough estimate of market-maker positioning suggests their hedging currently dampens moves rather than amplifying them.
The options market is pricing about a $3.90 move either way, for a range of roughly $775.19 to $782.99. That figure is the expected move: the move the market is pricing in, derived from what straddles cost.
The level that changes the picture is $772. A close below it means the put-side floor gave way.
The short-term chart model leans modestly lower, toward $777.50, which is still inside the options range.
2 · What the options market is pricing
What changed this week
SPY gained 1.95% over the past five sessions and is now within a third of a percent of its 52-week high.
Implied volatility (IV) is the market's estimate of how much SPY will move, baked into option prices. It moved the opposite way from price:
- At-the-money IV fell 6.6% over five days to 12.73%.
- IV rank slipped to 11, against a 7-day average of about 14.
The put/call open-interest ratio dropped to 0.59. In plain terms, there are about 0.59 puts held open for every call. That compares with a 7-day average of 0.84 and a 14-day average of 0.95, so traders spent the week shedding downside protection as the rally extended.
Today's session cut the other way at the margin. Net call open interest fell by about 87,000 contracts while puts added about 57,000, and the near-dated expirations saw the largest put building.
The single biggest change was the October 9 $787 calls, which shed 200,738 contracts of open interest (from 234,105 to 33,367). That was a large overhead call position cleared out.
Our options-flow momentum gauge reads +21, against a 7-day average of +11. The flow has warmed but is not stretched. The short- and long-term trend reads broadly agree: the past week is up, and the past month and two months are flat-to-firm.
Expected move
The October 7 options, one day to expiry, carry an ATM IV of just 9.46%. That translates into a one-session expected move of ±$3.90 (±0.50%) around the $779.09 snapshot price, or $775.19 to $782.99.
| Expiration | Implied move | Range around $779.09 |
|---|---|---|
| October 7 | ±0.50% | $775.19 – $782.99 |
| October 8 | ±0.75% | $773.25 – $784.93 |
| October 9 | ±0.96% | $771.61 – $786.57 |
| October 16 | ±1.80% | $765.07 – $793.11 |
| November 6 | ±3.74% | $749.95 – $808.23 |
The ladder widens smoothly with time, and the near-dated rungs are priced at lower IV than the month-out contracts. Front-month IV is priced in single digits to low teens, while the ~60-day read sits at 13.44%. The options market sees tomorrow as a quiet session relative to the weeks ahead.
Volatility
SPY's ATM IV of 12.73% has an IV rank of 11/100. IV rank shows where today's IV sits versus the past year: 11/100 means cheaper than 89% of the past year's range. Its percentile is 15.
The direction of travel:
- IV dipped 1.8% on the day and 6.6% over five days.
- It is up only 1.1% over 30 days.
- It sits just under its 30-day average (12.84%) and well under its 90-day average (13.77%).
Front-month read unavailable today (expiry day). Today's October 6 contracts expired, so the interpolated front-to-60-day slope isn't computed. The per-expiration figures above show an upward-sloping curve.
Realized movement has been subdued even against SPY's own quiet baseline. The past week's movement is running at only about 60% of the past month's pace, which is unusually depressed compared against this stock's own recent history. "Unusually" here means unusual for SPY, not versus the broader market.
Premium rich or cheap? The volatility risk premium is the gap between how much movement options are priced for and how much SPY has actually delivered. When it's positive, option sellers have been collecting more than realized movement cost them.
- Options are priced about 2.3 vol points above SPY's 20-day realized volatility of about 10.4%.
- Its percentile is 59/100. That gap is richer than about 59% of SPY's own recent readings: middle of the pack.
- The gap has narrowed from roughly 3.3 points on October 1.
Put together, IV rank 11 and a 59th-percentile premium over delivered movement make premium fair, not rich. Sellers get paid a little, but not generously, and buyers aren't getting a bargain either.
Skew and sentiment
Skew means that puts and calls the same distance from the stock price don't cost the same. When puts are pricier, traders are paying up for crash protection.
- SPY's 25-delta puts trade at 13.62% IV versus 10.44% for the matching calls, a gap of about 3.2 vol points.
- The 60-day norm is 3.8 points, so downside protection is slightly cheaper than usual. That is mild complacency, not alarm.
The put/call ratio measures how much put activity there is relative to calls; above 1 means puts dominate.
- Put/call volume came in at 0.82, versus a 7-day average of 0.95 and 14-day average of 0.97.
- That is an unusually call-heavy session for SPY versus its own recent norm.
- The count of calls clearing a high unusual-volume bar (28 calls vs 21 puts) was also well above typical.
Sentiment in short-dated options is split:
- The 0–7 day bucket leans slightly bearish (−11), driven by put open interest building into this week's expirations.
- The 7–30 day bucket leans modestly bullish (+17), helped by calls being relatively richer than usual.
- The overall read is Mixed: the buckets disagree and no regime dominates.
The key levels map
| Level | Price | Why it matters |
|---|---|---|
| Whole-chain call wall / largest gamma strike | $785 | Heaviest call open interest across all expirations (219,088 contracts); a strong magnet/barrier beyond tomorrow |
| Implied range top (October 7) | $782.99 | Upper edge of the one-session expected move |
| Call wall (October 7) | $782 | Biggest pile of open calls for tomorrow's expiry (6,200); tends to cap rallies into expiration |
| 52-week high | $781.62 | Price structure ceiling; no swing resistance above it |
| Gamma strike | $780 | Second-largest gamma concentration in the chain; a pinning candidate |
| Spot | $779.09 | Tuesday's close |
| Swing support | $776.14 | Nearest heuristic support from recent pivots |
| Implied range bottom (October 7) | $775.19 | Lower edge of the one-session expected move |
| Gamma strike | $775 | Third-largest gamma concentration |
| Max pain (October 7) | $773 | Where the most option value would expire worthless; sits below spot, a mild downward pull into expiry |
| Put wall (October 7) | $772 | Biggest pile of open puts for tomorrow (4,897); the session's floor and our invalidation level |
| Whole-chain put wall / gamma strike | $770 | Heaviest put open interest across all expirations (91,739) |
| 20-day moving average | $765.72 | Short-term trend line, 1.75% below |
| 50-day moving average | $765.22 | Intermediate trend line |
| 100-day moving average | $755.11 | Deeper trend support |
| Gamma flip (estimate) | ~$725 | One rough estimate of where hedging turns from cushioning to accelerating; far below |
| 200-day moving average | $721.49 | Long-term trend line, about 8% below |
The October 7 walls ($782/$772) sit tighter than the whole-chain walls ($785/$770). For tomorrow's expiration, the tighter pair applies.
Positioning and unusual flow
Market makers hedge the options they've sold. In a positive-gamma regime, their hedging tends to dampen moves: they buy dips and sell rips. Under the standard assumption that dealers are long calls and short puts, the estimate for both the whole chain and the October 7 expiration alone is positive.
The gamma flip level is the price below which market-maker hedging tends to accelerate selling rather than cushion it. That estimate sits near $725, far from today's price. Treat this as an estimate, not observed dealer inventory.
The heaviest flow was at-the-money and largely intraday:
- October 7 $780 puts: 115,057 contracts traded against open interest that rose only to 515, about $20.4 million in premium.
- October 7 $779 puts: 110,087 traded, open interest 542, about $14.3 million.
- October 14 $790 calls: 89,733 traded against 801 open, about $10.1 million. That is upside interest just above the whole-chain call cluster.
Open interest barely moved on the at-the-money puts, which means most of that put volume opened and closed the same day. It reads as active hedging and day-trading around the strike, not a fresh bearish stockpile.
3 · Technical check
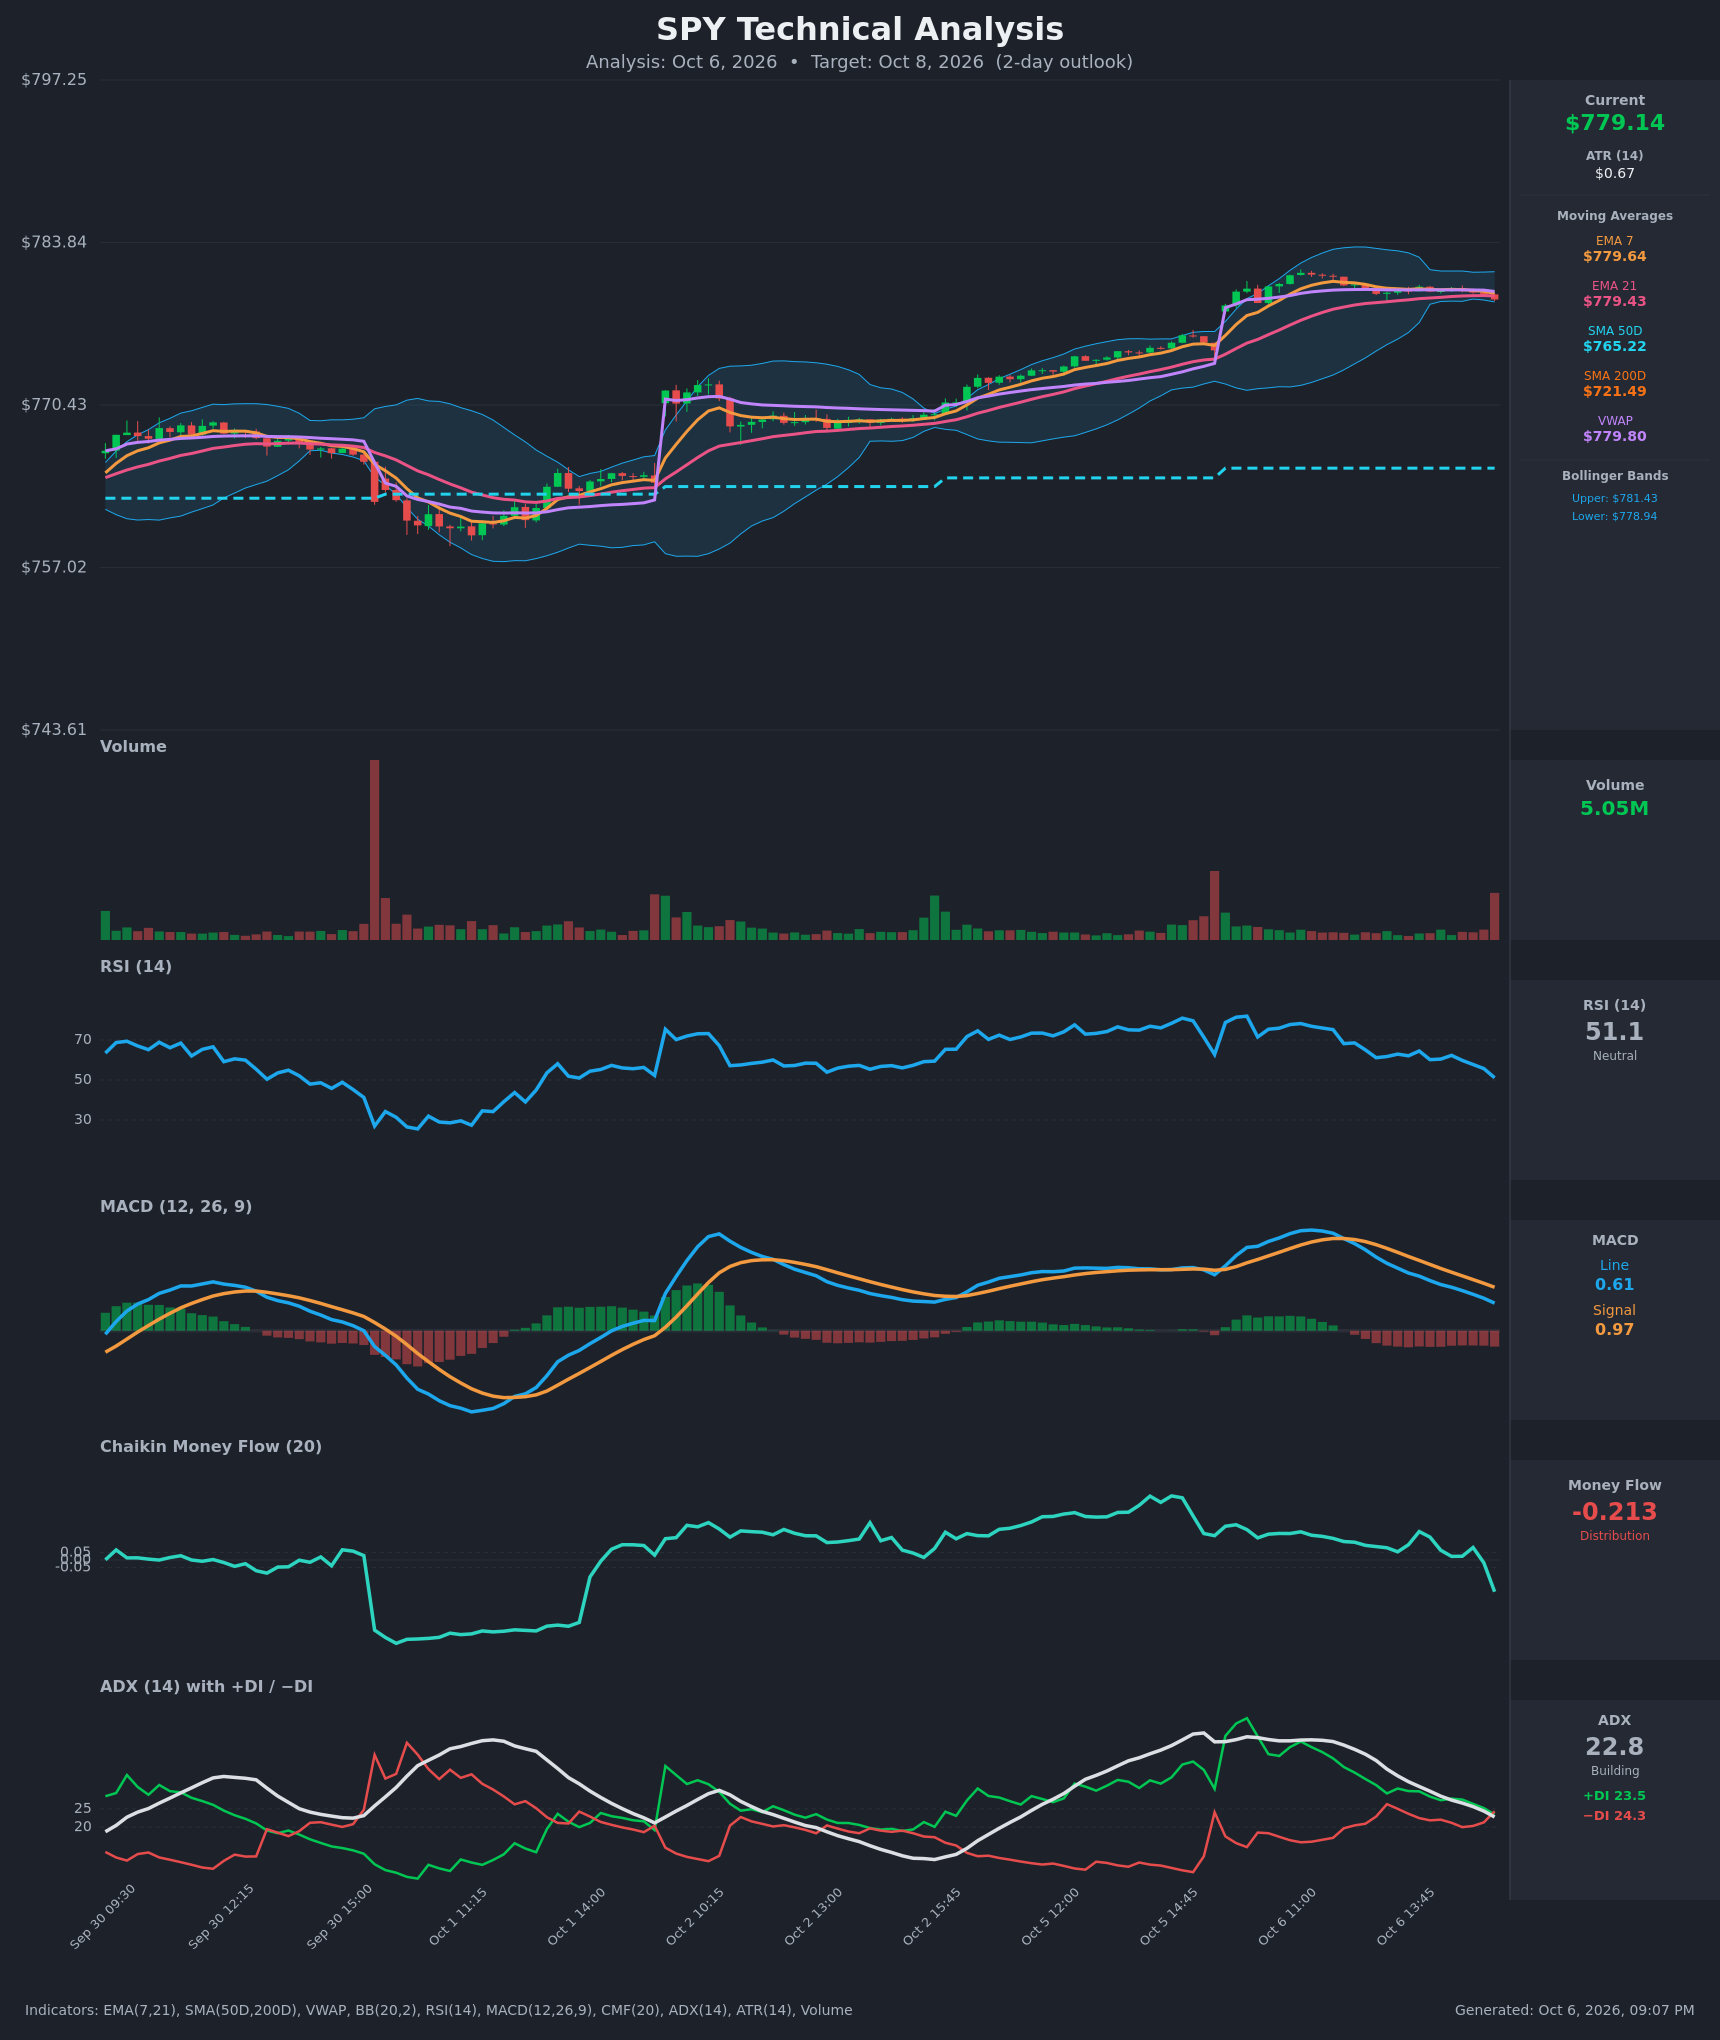
We have one technical report for this window: a 2-day chart model aimed at October 7.
- It is bearish, targeting $777.50 with a predicted range of $769.80 to $785.50.
- The model cites a MACD bearish crossover, Chaikin Money Flow at −0.213 (distribution), and −DI edging above +DI on a fading ADX.
- It names support at $778.94 and resistance at $779.80.
- Its dominant scenario, a breakdown out of a tight squeeze, is invalidated on a reclaim of $779.80 and a close above $780.40.
We classify the check as Mixed. The model's direction leans lower than our neutral read. However, its $777.50 target sits comfortably inside the options-implied range, so it describes a modest drift, not a break. The model's own range is about twice as wide as what options price, which reflects its 2-day horizon.
Model vs. Market: The options market implies $775.19–$782.99 into October 7; the 2-day technical model targets $777.50. The two agree that a move beyond the walls is unlikely. The disagreement is only about which half of the box SPY spends tomorrow in, and a hold above $780.40 would settle it in the options market's favor.
The bearish lean nudged the bearish structure's short strike to $775, near the model's extended target. It also kept the condor's short put outside the implied range rather than closer to spot.
Full technical write-up: Next-session report →
4 · Three ways the session can go
If SPY pushes above the call wall ($782): The heaviest October 7 call open interest sits right there, just above the $781.62 52-week high. In a positive-gamma setting, rallies into a dense call strike tend to slow as hedging sells strength. A clean break would leave the whole-chain $785 cluster as the next big wall.
If SPY drifts between the walls: This is the base case the positioning describes. Positive gamma, unusually quiet realized movement and large strikes at $780 and $775 tend to pin price inside the $772–$782 box. Max pain at $773 sits below spot, so expiring open interest exerts a mild pull lower rather than higher. That lines up with the chart model's $777.50 target.
If SPY breaks below the put wall ($772): Losing the October 7 put wall would put the whole-chain $770 put cluster in play, then the 20- and 50-day averages near $765. The gamma flip estimate (~$725) is far away, so even a break would land in territory where hedging is still estimated to cushion rather than accelerate selling. A close below $772 invalidates the neutral, range-bound read.
5 · Three defined-risk structures
Prices are end-of-day midpoints as of 2026-10-06. All structures are hypothetical unless flagged as an entered position. Verify live prices before trading; these will be stale by the open.
Premium is middle-of-the-road this session (59th percentile), so the bias sets the order and the range trade leads.
If you expect the range to hold: October 7 iron condor
An iron condor combines a put credit spread and a call credit spread. You collect premium and are betting SPY finishes between the short strikes.
- Trade: Sell the October 7 $775/$772 put spread and sell the $783/$786 call spread.
- Credit: $0.50 ($0.21 put side + $0.29 call side)
- Max profit: $50
- Max loss: $250
- Break-evens: $774.50 / $783.50
- Why it fits: Both short strikes sit just outside the $775.19–$782.99 implied range and bracket the $772 put wall and $782 call wall. Estimated positive gamma and unusually quiet realized movement favor a pin.
- Makes sense only if: You accept a 1-to-5 reward-to-risk ratio. With IV rank at 11, the market isn't paying much for this.
- Invalidated if: SPY closes below $772 or above $785.
- Managing it: Close at ~50% of the credit if SPY holds the middle into midday. If either short strike trades through, close rather than hope. There is no time left to recover.
- Liquidity note: The $775 puts and $783 calls trade a penny wide. The $772 puts ($0.12/$0.13) and $786 calls ($0.07/$0.08) are also a penny wide, but that is 8–13% of their tiny marks. Enter as a single package order at mid to limit slippage.
- Analyze this position →
If you lean bullish: October 7 $779/$782 call debit spread
A debit spread means you pay up front, and the trade gains if SPY rises toward the short strike.
- Trade: Buy the October 7 $779 call, sell the October 7 $782 call.
- Debit: $1.235
- Max profit: $176.50
- Max loss: $123.50
- Break-even: ~$780.24
- Why it fits: Low IV rank makes buying options relatively cheap. The past week's flow has been call-heavy with puts thinning. The short strike sits exactly at the $782 call wall, where rallies tend to stall.
- Makes sense only if: SPY reclaims $780 early. That is the area the chart model flags as resistance.
- Invalidated if: SPY closes below $776.14.
- Managing it: Take profits near $781–$782 rather than waiting for the final minutes. Exit if SPY slips under $778.94 support intraday.
- Liquidity note: The $779 calls traded $1.80/$1.82 and the $782 calls $0.57/$0.58, so fills should be easy.
- Analyze this position →
If you lean bearish: October 7 $779/$775 put debit spread
- Trade: Buy the October 7 $779 put, sell the October 7 $775 put.
- Debit: $0.96
- Max profit: $304
- Max loss: $96
- Break-even: $778.04
- Why it fits: Max pain sits below spot at $773, and today's net put open interest building tilts the near term lower. The chart model targets $777.50, extending to $775.50. The $775 short strike captures that path at roughly a 3-to-1 payoff.
- Makes sense only if: SPY loses $778.94 and fails to reclaim $779.80.
- Invalidated if: SPY closes above $782.
- Managing it: Take most of the gain near $776–$775. If SPY reclaims $780.40, the technical breakdown case is void, so cut it.
- Liquidity note: The $779 puts traded $1.29/$1.30 and the $775 puts $0.33/$0.34, so the spreads are tight.
- Analyze this position →
If none of these: no trade
Standing aside is a perfectly reasonable choice for this session:
- The bias is neutral, so neither debit spread has a positioning edge behind it.
- IV rank of 11 means the condor pays just $50 to risk $250. A single directional gap through either wing erases several winning sessions.
- Premium isn't rich enough to compensate for that asymmetry: it sits only 2.3 points over delivered movement, around the middle of SPY's own range.
If you don't have a view on which half of the $772–$782 box SPY settles in, flat is a legitimate position.
6 · Quick FAQ
What is SPY's expected move for the October 7 expiration? ±$3.90 (±0.50%), for a range of $775.19 to $782.99, based on straddle pricing as of the October 6 close.
Is SPY expected to go up or down tomorrow? Options positioning as of October 6 is neutral. The October 7 walls bracket price and estimated dealer hedging dampens moves, but that's a read of what traders have done, not a forecast. The actionable map is the $775.19–$782.99 range and the $772/$782 levels.
Are SPY options expensive right now? No. IV rank of 11/100 says option prices are cheaper than 89% of the past year's range. They're running about 2.3 vol points above the movement SPY has actually delivered, which is middling (59th percentile) for SPY's own recent history.
Where is SPY's biggest options support and resistance? For the October 7 expiration, the put wall is $772 and the call wall is $782. Across all expirations, the heaviest strikes are $770 (puts) and $785 (calls).
What invalidates this read? A SPY close below $772.00.
Methodology & disclosures. Data: end-of-day options-chain snapshot for SPY, 2026-10-06, generated 2026-10-06T21:06:58.569Z. Prices shown are midpoints and will differ from live markets. Momentum/positioning scores and volatility-premium comparisons are descriptive measurements of past option flow and past price movement — not investment advice, signals, forecasts, or guarantees. All trade structures are hypothetical. Every structure shown has a defined maximum loss; you can lose the entire max-loss amount. Options involve substantial risk and are not suitable for all investors.