SPY Options Are Pricing a $7.04 Move for November 13 — Our Positioning Read Tilts Lower
SPY options are pricing a ±$7.04 move into the November 13 expiration, a $750.08–$764.16 range. Heavy front-end put demand gives the setup a modest bearish tilt, with $760 overhead and $745 below.
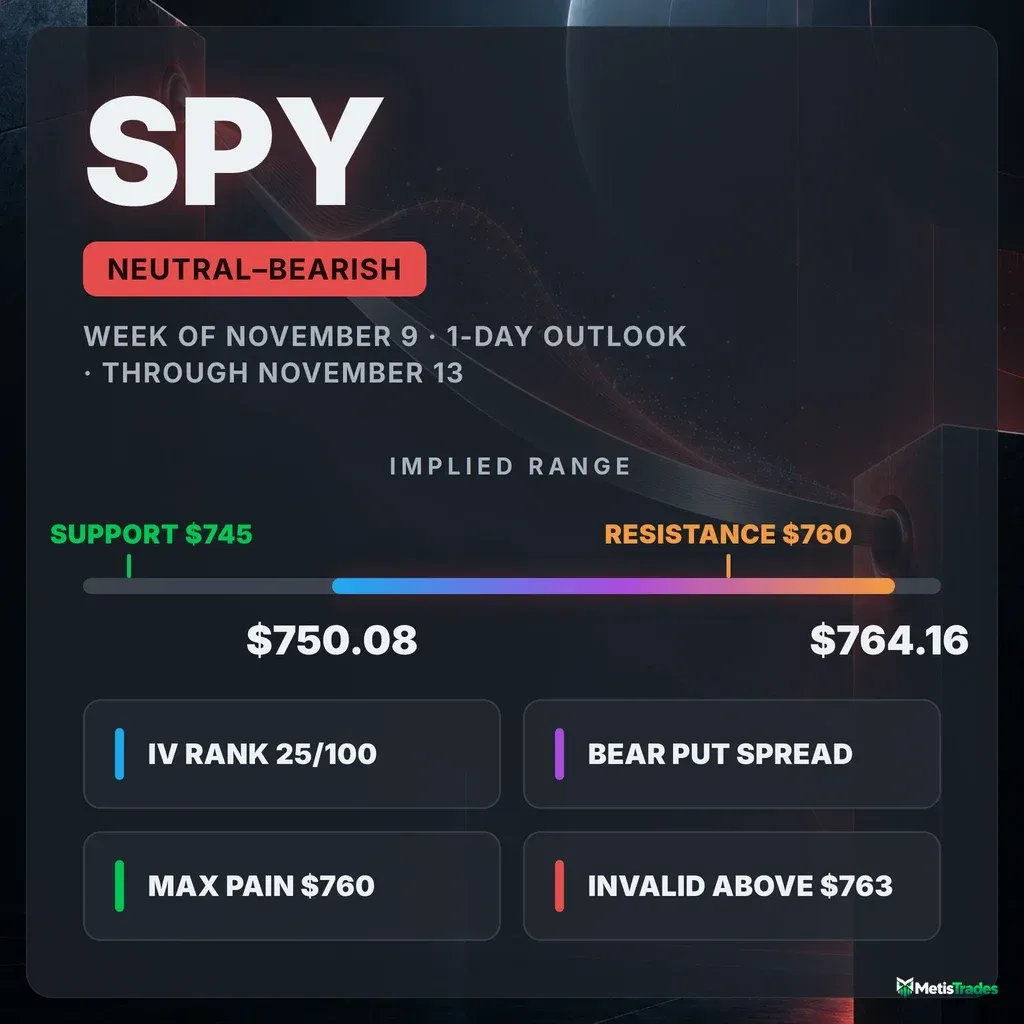
The options market implies a $750.08–$764.16 range into the November 13 expiration. Here is what is driving it, where the walls sit, and three defined-risk ways to trade the next session.
Published Thursday, November 12, 2026 · Data as of Thursday, November 12, 2026 close · Nightly update covering the next session (2026-11-13)
Explore the live SPY options data in the Detailed Options Analyzer →
Quick answer
| Item | Answer |
|---|---|
| Market bias | Neutral with a bearish tilt |
| Options-implied range (into November 13) | $750.08 – $764.16 (±0.93%, ±$7.04) |
| Major support | $745.00 (November 13 put wall); whole-chain put wall at $750 |
| Major resistance | $760.00 (November 13 call wall) |
| Max pain (November 13) | $760.00 |
| Dealer gamma regime (estimate) | Negative: hedging tends to amplify moves. Flip level: n/a (no estimate available today) |
| Volatility condition | Falling over five sessions (down about 32%), up 5.5% on the day. IV rank 25/100. Premium is thin: options are priced about 7.7 vol pts below delivered movement |
| Technical check | Confirms (bearish, next session; model target $754.50, model range $748.00–$763.50) |
| Best-fitting strategy | Bear put debit spread (November 13 $756/$750), only if $760 caps the session |
| Analysis invalidated if | SPY closes above $763 |
1 · What matters today
Our read for tomorrow's session (2026-11-13) is neutral with a bearish tilt. The main reason is the shortest-dated options. Traders piled into puts expiring this week and paid up for downside protection, even though SPY has bounced about 3.3% over five sessions. The options market is pricing a move of about $7 either way, which puts SPY between $750.08 and $764.16 by tomorrow's close. The $760 strike matters most. It holds the heaviest call open interest for this expiration and is also where the most option value would expire worthless, so it acts as a lid and a magnet at the same time. A close above $763 would break that ceiling and cancel the tilt. Below spot, $745 is the floor where put open interest is stacked. The chart-based technical model agrees: it leans bearish with a $754.50 target.
2 · What the options market is pricing
What changed this week
The past week reads as a recovery from a shock. SPY fell to about $733 on November 5. It closed at $757.12 on Thursday, November 12, up 3.29% over five sessions, though still down 1.90% over twenty. Implied volatility (IV) is the market's estimate of how much SPY will move, baked into option prices. It deflated hard, down about 32% over five sessions as the panic premium bled out. The put/call open-interest ratio tells the same story. It measures how many puts are held open (open interest = contracts currently held open) for every call. It has dropped from 5.17 at the November 5 extreme to 1.28 today, far below its 7-day average of 2.03.
The last 24 hours, however, pulled the other way. Call open interest fell by about 134,000 contracts while put open interest rose by about 266,000. That is a sizable one-day swing toward puts for this name. The largest single build in a still-live contract was the December 4 $775 calls, which added 27,682 contracts, so some traders are positioning for an upside run over a multi-week horizon. Into Thursday's own expiration, the settled November 12 $756 puts had added about 18,000 contracts of open interest before they expired. That is history now, not a live level.
The short-, medium- and long-term trend reads all register as flat, so no larger trend is fighting the near-term flow. One fresh wrinkle: the faster momentum line crossed back above the slower one on Thursday, even as front-end sentiment turned sharply put-heavy.
Expected move
The expected move is the move the options market is pricing in, derived from what straddles cost. For the November 13 expiration it is ±$7.04 (±0.93%) around the $757.12 snapshot price, a range of $750.08 to $764.16. A straddle is the at-the-money call plus put. If SPY finishes inside that band, straddle buyers lose. If it finishes outside, they win.
| Expiration | Implied move | Range around $757.12 |
|---|---|---|
| November 13 (next session) | ±0.93% (±$7.04) | $750.08 – $764.16 |
| November 16 | ±1.34% (±$10.15) | $746.97 – $767.27 |
| November 20 | ±2.32% (±$17.57) | $739.55 – $774.69 |
| December 11 (~1 month) | ±4.21% (±$31.87) | $725.25 – $788.99 |
The ladder widens about as fast as time alone would suggest. The one quirk is that November 13 carries a richer annualized IV (17.8%) than November 16 (12.8%). The market is paying extra for tomorrow's single session, which fits the put-heavy front end described below.
Volatility
At-the-money IV sits at 14.94%. IV rank shows where today's IV sits versus the past year. At 25/100, current option prices are cheaper than 75% of the past year's range, though IV is still above its 30-day average (14.56%) and its 90-day average (13.74%). Today's 5.5% uptick came after the 32% five-day slide, so volatility is rebuilding slightly off a sharp reset. The front-month read is unavailable today (expiry day), so we skip the usual term-structure comparison, which compares option prices across expiration dates. VIX, which tracks SPY's own IV almost one-for-one lately, closed at 18.75, in the lower third of its 52-week range.
Two observations put this against SPY's own recent norm. Here, "unusually high" means unusual for SPY, not versus the broader market. First, 20-day realized volatility of 22.6% is running far above SPY's typical level, because the November 5 selloff sits inside that window. Second, the stock's recent upward price push is unusually strong for this name.
Premium rich or cheap? The volatility risk premium (VRP) is the gap between how much movement options are priced for and how much SPY has actually delivered. When it is positive, option sellers have been collecting more than realized movement cost them. Today it is negative: options are priced about 7.7 vol points below SPY's 20-day delivered movement. The VRP percentile shows where today's gap sits versus SPY's own recent readings. Today's reading is 2/100, meaning thinner than 98% of them, which is about as cheap as this measure gets for SPY. The path matters here. The gap ran a healthy 3–5 points positive through late October, then flipped negative on November 9. That flip is largely mechanical: the violent November 5 drop entered the 20-day realized window and inflated the "delivered" side. That day will keep weighing on the comparison until it rolls out of the window in early December. Even with that caveat, an IV rank of 25 plus a 2nd-percentile premium favors owning premium over selling it for this session.
Skew and sentiment
Skew captures the fact that puts and calls the same distance from the stock price don't cost the same. When puts are pricier, traders are paying up for crash protection. Today 25-delta puts carry an IV of 18.0% versus 11.7% for equivalent calls, so puts run 6.3 vol points over calls, against a 60-day norm of 3.8. That is a clearly steeper-than-usual reading for SPY. Skew has eased from its post-selloff peak, but it remains well above the norm.
The put/call volume ratio measures put activity relative to calls; above 1 means puts dominate. It printed 1.08, puts edging out calls but below its 7-day average of 1.19. The sharper message comes from sentiment by expiration bucket. Options expiring in 0–7 days score −60, a heavily bearish read and well below that bucket's 7-day average of −20. Options expiring in 8–30 days score a milder −18. The one-phrase summary for the curve is "Bearish Capitulation": aggressive front-end put demand. In plain terms, traders are buying near-dated downside protection into a bounce, and they are doing so mostly in the nearest expirations.
The key levels map
| Level | Price | Why it matters |
|---|---|---|
| 52-week high | $781.62 | SPY sits 3.13% below it |
| November 20 call wall | $780 | Heaviest call OI next week (23,290 contracts) |
| Swing resistance | $776.19 | Upper heuristic pivot cluster |
| December 4 call build | $775 | Largest one-day OI add (+27,682 calls) |
| Large gamma strike | $765 | Fourth-largest gamma concentration in the chain |
| 50-day moving average | $764.80 | Overhead trend resistance, just above the implied range top |
| Implied range top (November 13) | $764.16 | +1σ for the next session |
| Gamma strike / invalidation | $763 | Fifth-largest gamma strike and November 16 max pain; a close above it cancels the tilt |
| 100-day moving average | $760.07 | Stacks right on the wall |
| Call wall + max pain (November 13) | $760.00 | Heaviest call OI for the expiration (12,801), the max-pain strike, and the chain's largest gamma strike |
| 20-day moving average | $759.47 | Price closed just under it |
| Swing resistance | $759.20 | Nearest heuristic overhead pivot |
| Spot (snapshot) | $757.12 | Thursday's close |
| Large gamma strike | $755 | Third-largest gamma concentration |
| Whole-chain put wall | $750 | 158,712 puts across all expirations; sits on the implied range floor ($750.08) |
| Swing support | $747.69 | Nearest heuristic floor |
| Put wall (November 13) | $745.00 | Heaviest put OI for the expiration (31,860) |
| Swing support | $732.34 | Near the November 5 low |
| 200-day moving average | $731.62 | Long-term uptrend still intact well below |
| Gamma flip (estimate) | n/a | No flip estimate was available today |
A call wall or put wall is the strike with the biggest pile of open call or put contracts; these often act like magnets or barriers. Note the disagreement: the November 13 put wall is $745, while the whole chain's put wall is $750. For tomorrow's session, the expiration-specific $745 is the relevant floor. On the call side the two agree at $760. Max pain is the price where the most option value would expire worthless, and expirations sometimes gravitate toward it. For November 13 it is also $760.
Positioning and unusual flow
Market makers hedge the options they've sold. By one rough estimate, SPY sits in a negative gamma regime, both for the November 13 expiration and across the whole chain. In this regime their hedging tends to amplify moves rather than dampen them. That estimate rests on an assumed convention about who is long and short. Still, it argues that a push through either wall could travel further than usual. No gamma-flip estimate was available today.
- November 13 $755 puts: open interest jumped by 14,431 contracts to 24,184 on 74,830 traded. This is fresh downside protection parked just $2 below spot for tomorrow's expiry.
- November 16 $763 puts: open interest rose by 19,902 on 37,312 traded, about $24.6 million in premium. These puts are already in the money, so this looks more like hedges or spread legs than outright bets on a crash.
- November 16 $766 puts: 16,095 traded against just 116 open, a volume-to-OI ratio near 139 and about $14.1 million in premium. Like the $763s, they sit deep in the money and are best read as structured hedging.
One caution: the November 13 $745 puts behind the put wall carry no prior-day open interest in the file. Treat the wall as an objective pile of contracts today, but not as proof of brand-new buying.
3 · Technical check
The next-session technical model leans bearish, with a $754.50 target and a $748.00–$763.50 projected range. It was generated on the same evening from a $757.19 reference, in line with our snapshot. Its target sits inside the options-implied $750.08–$764.16 band, and its direction matches our tilt, so we classify it as Confirms. Its projected range is a bit wider on the downside ($748.00 versus $750.08) and slightly tighter on top. The model sees a little more room below than the options market is pricing.
Two indicator reads stand out. The MACD line has crossed below its signal line and below zero, which points to downside momentum building. Money flow, however, has stayed positive throughout the pullback, a mild bullish divergence that suggests dip buyers are still active. The model lists $754 as support and $760 as resistance. Its dominant pullback scenario is invalidated by a reclaim of $760, the same level that holds the options call wall.
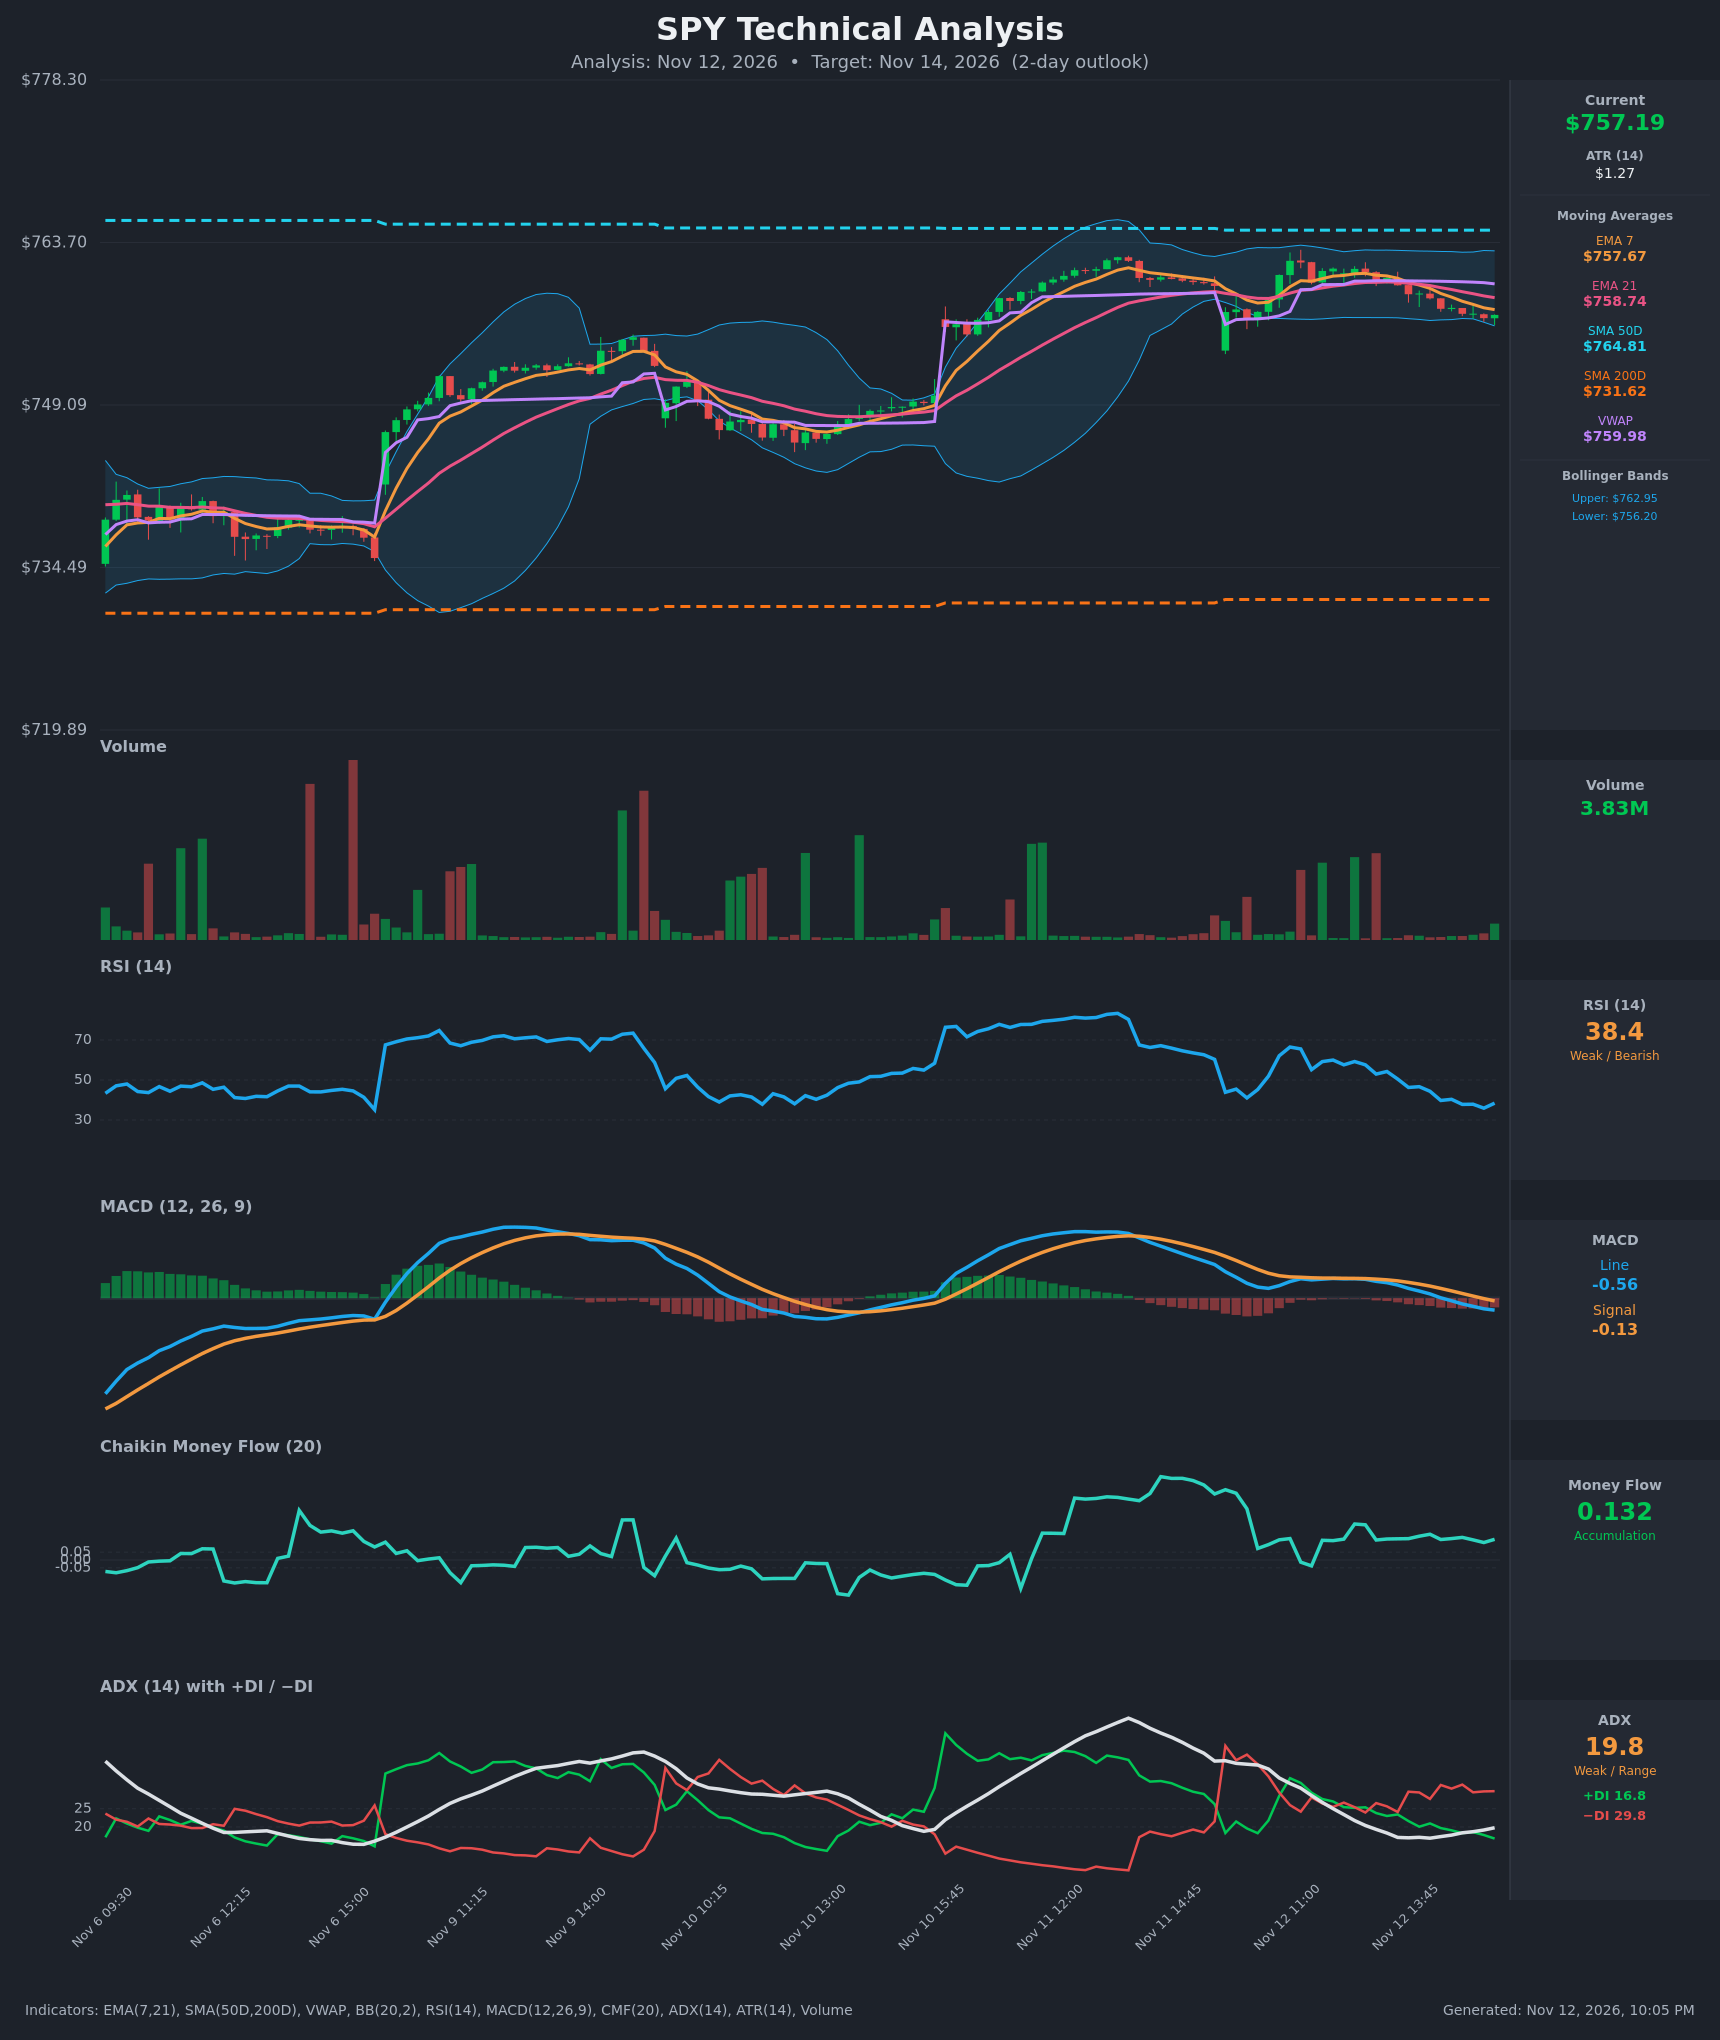
Model vs. Market: The options market implies $750.08–$764.16; the next-session technical model targets $754.50. Both sit on the same side of spot. The open question is whether the $760 call wall holds as a lid or acts as a max-pain magnet.
The TA's $754 support shaded the bearish spread's break-even zone below. We did not move any strike past the options walls.
Full technical write-up: Next-session report →
4 · Three ways the next session can go
If SPY pushes above the call wall ($760.00): The heaviest call open interest for the expiration, the 100-day average at $760.07 and max pain all sit here, so this strike tends to slow rallies. A clean break would run into the $763 gamma strike and then the $764.16 implied ceiling. In a negative-gamma regime, a close above $763 would leave little positioning in the way until the 50-day average at $764.80, and it would cancel our bearish tilt.
If SPY drifts between the walls: This is the base case for an expiration day. With $760 serving as both call wall and max pain, expiring open interest tends to pull price toward the upper half of the $755–$760 zone. Meanwhile, the fresh $755 put build gives the lower half a cushion. A drift here favors the defined-range structure and slowly bleeds directional debit spreads.
If SPY breaks below the put wall ($745.00): Getting there first means slicing through the whole-chain put wall at $750 and swing support at $747.69. That is a move beyond the expected range, but it is the scenario the front-end put buying is paying for. With dealer gamma estimated negative and no flip estimate to anchor it, one rough read suggests hedging would amplify the selling rather than cushion it. The $732.34 swing support would then be the next structural floor.
5 · Three defined-risk structures
Prices are end-of-day midpoints as of 2026-11-12. All structures are hypothetical. Verify live prices before trading; these will be stale by the open. Because premium is unusually thin versus delivered movement, the debit structures lead.
If you lean bearish: bear put debit spread
- Trade: Buy the November 13 $756 put ($1.975), sell the November 13 $750 put ($0.765). You pay a debit and profit if SPY falls below your long strike by expiration.
- Debit: $1.21 ($121 per spread) · Max profit: $479 · Max loss: $121 · Break-even: $754.79
- Why it fits: Front-end sentiment is at −60, skew is steep and puts are building. Buying premium also makes sense with VRP at its 2nd percentile. The short $750 strike sits on the whole-chain put wall and the implied range floor. The break-even sits right at the TA's $754 support zone.
- Makes sense only if: $760 caps the session and SPY can't reclaim the 20-day average.
- Invalidated if: SPY trades back above $760. Exit rather than hold into the close.
- Managing it: Take profits near $753 if reached early, roughly 50–60% of max value. Close by mid-afternoon if SPY is still pinned near $757, before decay finishes the job.
- Liquidity note: The $756 puts traded 1¢ wide and the $750 puts about 1¢ wide (roughly 1.3% of mark), so fills should be easy.
- Analyze this position →
If you lean bullish: bull call debit spread
- Trade: Buy the November 13 $758 call ($2.74), sell the November 13 $762 call ($0.995). You pay a debit and profit if SPY rallies through the $760 wall.
- Debit: $1.745 ($174.50) · Max profit: $225.50 · Max loss: $174.50 · Break-even: $759.75
- Why it fits: Puts have thinned sharply over five sessions, calls are being added for early December, and the momentum lines just turned up. Cheap premium lowers the cost of a bet on a break above the wall.
- Makes sense only if: SPY holds above $755 early and pushes through $760 with conviction.
- Invalidated if: SPY trades below $754.
- Managing it: The break-even sits just under the call wall, so this needs a genuine breakout. Close at about 50% gain if SPY tags $761. Exit early if price stalls at $760, where max pain could pin it.
- Liquidity note: The $758 calls traded 2¢ wide and the $762 calls 1¢ wide, which is tight.
- Analyze this position →
If you expect the range to hold: iron condor
- Trade: Sell the November 13 $750/$745 put spread and the November 13 $764/$769 call spread. You collect a credit and keep it if SPY settles between the short strikes.
- Credit: $0.83 ($83) · Max profit: $83 · Max loss: $417 · Break-evens: $749.17 and $764.83
- Why it fits: The short strikes sit just inside the ±$7.04 expected range. The long put sits at the $745 put wall, and the $760 max pain sits comfortably inside the profit zone. Be aware that you're selling premium that hasn't been rich lately, and options are priced below what SPY has actually delivered.
- Makes sense only if: The expiration-day pin around $755–$760 plays out.
- Invalidated if: SPY trades through $750 or $764.
- Managing it: Close at about 50% of the credit. In a negative-gamma regime, cut the tested side immediately if either short strike is touched rather than hoping for a reversal.
- Liquidity note: All four legs ($745 and $750 puts, $764 and $769 calls) traded 1¢ wide.
- Analyze this position →
If none of these: no trade
Standing aside is a real option tomorrow. The tilt is modest, and the max-pain pull toward $760 works against the bearish spread. The thin premium makes the condor's 1-to-5 payoff unattractive. A one-day expiration also leaves no time to repair a bad entry. If SPY opens between $755 and $759 with no follow-through, the cleanest choice is to let the pin play out without a position.
6 · Quick FAQ
What is SPY's expected move for November 13? About ±$7.04 (±0.93%), a $750.08–$764.16 range, per straddle pricing as of the November 12 close.
Is SPY expected to go up or down tomorrow? Options positioning as of November 12 leans neutral with a bearish tilt, because traders are buying near-dated puts into a bounce. That is a read of what traders have done, not a forecast. The actionable map is the $750.08–$764.16 range and the $745/$760 walls.
Are SPY options expensive right now? No. An IV rank of 25/100 means prices are lower than 75% of the past year's range. Options are also running about 7.7 vol points below the movement SPY has actually delivered, thinner than 98% of its own recent readings. That gap is partly inflated by the November 5 selloff sitting in the realized-volatility window.
Where is SPY's biggest options support and resistance? For the November 13 expiration, the put wall is $745 and the call wall is $760. The whole chain's put wall sits at $750.
What invalidates the next session's read? A close above $763.
Methodology & disclosures. Data: end-of-day options-chain snapshot for SPY, 2026-11-12, generated 2026-11-12T22:05:10.160Z. Prices shown are midpoints and will differ from live markets. Momentum/positioning scores and volatility-premium comparisons are descriptive measurements of past option flow and past price movement — not investment advice, signals, forecasts, or guarantees. All trade structures are hypothetical. Every structure shown has a defined maximum loss; you can lose the entire max-loss amount. Options involve substantial risk and are not suitable for all investors.