SPY Options Are Pricing a $9.55 Move Into November 17: Positioning Leans Lower, the Chart Model Sees a Bounce
The options market implies a $730.40–$749.50 range for SPY into the November 17 expiration, and positioning tilts bearish after a sharp jump in put buying. Options are priced below the movement SPY has actually delivered lately, which is why the lead trade idea is a defined-risk debit spread rather than a premium sale.
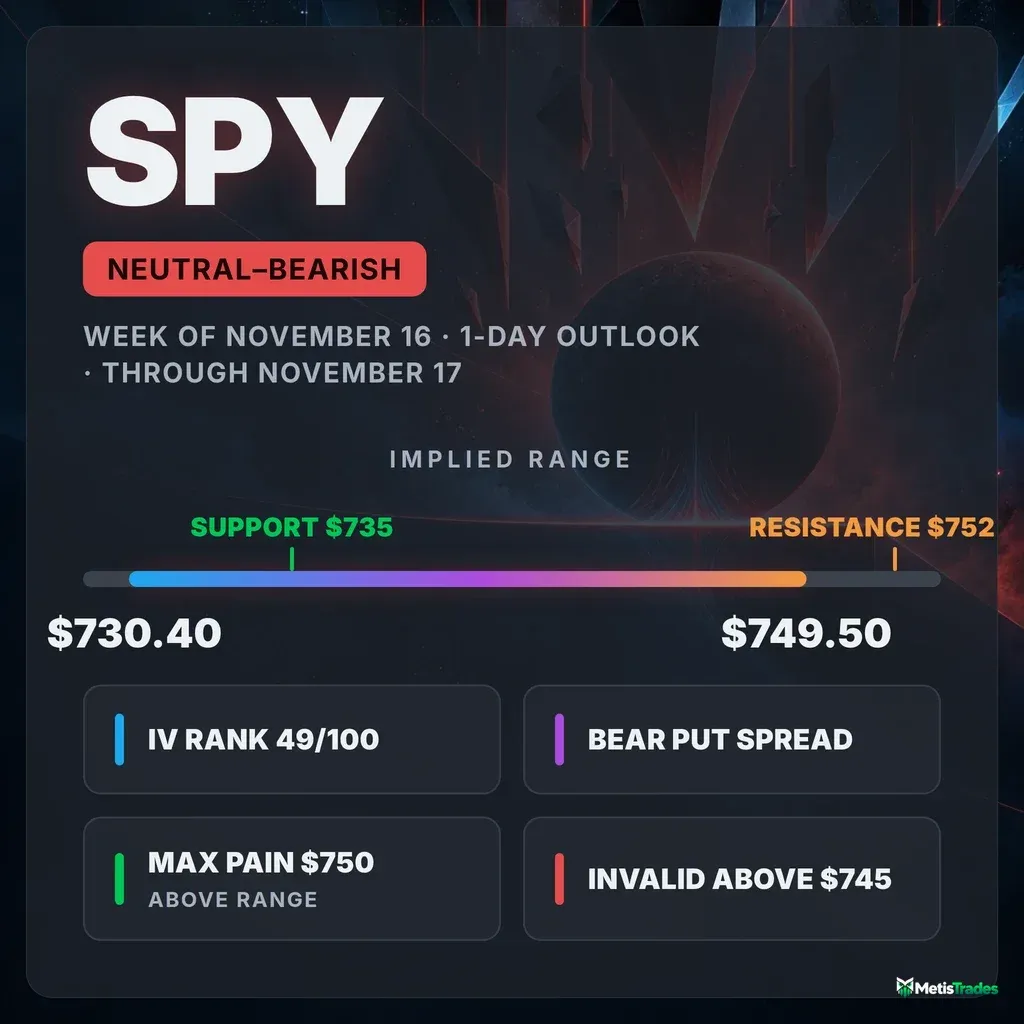
The options market implies a $730.40–$749.50 range into the November 17 expiration. Below is what's driving that range, the levels that matter, and three defined-risk ways to trade it.
Published Monday, November 16, 2026 · Data as of Monday, November 16, 2026 close · Nightly update covering the next session (2026-11-17)
Explore the live SPY options data in the Detailed Options Analyzer →
Quick answer
| Item | Answer |
|---|---|
| Market bias | Slightly bearish (neutral with a bearish tilt) |
| Options-implied range (into November 17) | $730.40 – $749.50 (±1.29%, ±$9.55) |
| Major support | $735 (put wall for the November 17 expiration); whole-chain put wall at $730 |
| Major resistance | $752 (call wall for the November 17 expiration); whole-chain call wall at $750 |
| Max pain (November 17) | $750 |
| Dealer gamma regime (estimate) | Negative: hedging tends to amplify moves. No flip level was estimated today. |
| Volatility condition | Rising. IV rank 49/100. Premium is thin: options are priced ~4.5 vol pts below delivered movement. |
| Technical check | Diverges (bullish, next-session). Model target $742.00, model range $732.50–$749.50. |
| Best-fitting strategy | Bear put debit spread (November 17 $740/$735), only if SPY fails to reclaim the low $740s |
| Analysis invalidated if | SPY closes above $745 |
1 · What matters today
Our read of SPY options leans slightly bearish for tomorrow's session (2026-11-17). The main reason is Monday's surge in put buying: traders bought far more puts than calls and paid an unusually high price for downside protection. The options market is pricing a move of about $9.55 either way, which puts SPY between roughly $730.40 and $749.50 at the November 17 expiration.
The level that changes the picture is $735, the strike with the biggest pile of open put contracts for that expiration. Holding above it keeps this a hedged pullback. Losing it opens the path toward $730 in a market where hedging flows tend to speed moves up rather than slow them down. A close back above $745 would cancel the bearish lean.
The chart-based technical model disagrees and sees a small bounce toward $742.
2 · What the options market is pricing
What changed this week
The past five sessions flipped the tone. SPY closed Monday at $739.95. That is down 1.69% over five trading days and 3.46% over twenty, and it includes a slide from $754.37 at the November 13 snapshot.
Option flow moved faster than price:
- Put/call open interest. This ratio compares put contracts held open with call contracts held open. It jumped from about 1.10 five sessions ago to 2.73 today, so there are now roughly 2.7 open puts for every open call. Its 7-day average is 1.74, so today is well above even the recent elevated baseline.
- Net new positions. Since the November 13 snapshot, calls shed about 337,700 contracts of open interest while puts added about 372,400. Traders were replacing upside bets with protection.
- Flow score. Our read of options flow swung from mildly positive late last week to deeply negative in a single session. That is a sharp shift, not a slow build.
Into Monday's same-day expiration, the November 16 $745 calls added 16,280 contracts of open interest. That expiration has now settled and is history, not a live level.
The biggest forward-looking build was in the November 20 $750 puts. They added 4,936 contracts to reach 60,113 open, on volume of more than 105,000 contracts and roughly $134 million in premium traded.
The short- and long-term trend reads agree. The roughly 20-day trend is bearish, and the past week and past two months are flat-to-soft. Monday's flow extends an existing drift rather than fighting one.
Expected move
The expected move is the move the options market is pricing in, derived from what straddles cost. For the November 17 expiration, one trading day out, that move is ±1.29%, or about $9.55 around the $739.95 snapshot price. The resulting range is $730.40 to $749.50.
| Expiration | Implied move | Range around $739.95 |
|---|---|---|
| November 17 (2026-11-17) | ±1.29% | $730.40 – $749.50 |
| November 18 (2026-11-18) | ±1.84% | $726.34 – $753.56 |
| November 20 (2026-11-20) | ±2.51% | $721.38 – $758.52 |
| December 18 (2026-12-18) | ±5.52% | $699.10 – $780.80 |
The near rungs are expensive for their length. The November 17 contracts carry an at-the-money implied volatility of about 24.7%, against roughly 18.6% for December 18. Traders are paying the most for protection over the next few sessions, not the next few weeks.
Volatility
Implied volatility (IV) is the market's estimate of how much SPY will move, baked into option prices.
- Level. SPY's at-the-money IV is 18.71%.
- IV rank: 49/100. IV rank shows where today's IV sits versus the past year. A 49 means today is cheaper than 51% of the past year's readings, so it sits near the middle of the range.
- IV percentile: about 88%. Today's IV is higher than about 88% of past-year days. The two numbers differ because the past year included a big spike that stretches the range. Most days were far calmer than today.
- Direction. IV rose about 22.7% in one session, 16% over five sessions, and 44% over thirty. It sits well above its 30-day average of 14.7% and its 90-day average of 13.8%. The roughly two-month read is 17.75%.
- Term structure. The front-month read is unavailable today (expiry day). The per-expiration table above shows the front end clearly richer than later months.
SPY's actual movement has also run hot. Twenty-day realized volatility is about 23.2%, well above this fund's own recent norm. The 10-day figure is near 31%, driven by the sharp early-November swings. A "vs its own norm" reading compares against SPY's own recent history, so "unusually high" here means unusual for SPY, not versus the broader market.
The VIX closed at 19.9, mid-range for its past year (rank about 37). SPY's implied volatility has been moving almost in lockstep with it.
Premium rich or cheap? The volatility risk premium is the gap between how much movement options are priced for and how much SPY has actually delivered. When it's positive, option sellers have been collecting more than realized movement cost them.
- The gap is negative. Options are priced about 4.5 vol points below what SPY has actually delivered over the past 20 days.
- It is near the bottom of SPY's own history. Its percentile, which compares today's gap with this fund's own recent readings, is 7/100. That is thinner than about 93% of recent readings and an unusually depressed reading for SPY.
- How it got here. The gap was positive through early November. It flipped negative on November 9 as the early-November drop moved into the 20-day realized window, bottomed near −8.4 points on November 11, and narrowed on Monday only because IV jumped.
- So what. An IV rank of 49 plus a 7th-percentile premium over delivered movement favors owning premium through defined-risk debit spreads rather than collecting it into tomorrow's session.
Skew and sentiment
Skew describes the fact that puts and calls the same distance from the stock price don't cost the same. When puts are pricier, traders are paying up for crash protection.
- Skew. SPY's 25-delta puts trade at about 24.2% IV versus 15.4% for matching calls. That puts them roughly 8.7 vol points over calls, against a 60-day norm of about 3.8 points and a 7-day average near 6.0. Skew is stretched well past its own norm: traders are paying a clear premium to protect against a drop.
- Put/call volume ratio: 1.63. This ratio measures put activity relative to calls, and above 1 means puts dominate. About 1.63 puts traded for every call on Monday, versus a 7-day average of 1.11. That pace is unusually put-heavy for this fund.
- Overall volume. Total option volume was only about 1.03× its 20-day average. The shift was in the mix of puts versus calls, not in the overall amount of trading.
Sentiment in short-dated options is also negative:
- 0–7 day expirations: −46, versus a 7-day average of −18.
- 7–30 day expirations: −24, versus a 7-day average of −6.
- 30–60 day expirations: slightly positive, so the overall regime reads as "Mixed."
In plain terms, the defensiveness is concentrated in the next few weeks and is not yet a broad, long-dated bet against the market.
The key levels map
| Level | Price | Why it matters |
|---|---|---|
| 52-week high | $781.62 | Outer ceiling; SPY sits 5.3% below it. |
| Swing resistance | $776.19 | Highest recent pivot cluster. |
| 50-day moving average | $763.82 | Price is 3.1% below; the medium-term trend line has been lost. |
| 100-day moving average | $760.34 | Second overhead trend marker. |
| Swing resistance | $759.93 | Near the November 11 high area. |
| 20-day moving average | $757.69 | Price is 2.3% below; the short-term trend points down. |
| Call wall (November 17) | $752 | Heaviest call open interest for tomorrow's expiration (1,896 contracts, most added Monday). |
| Max pain (November 17) / whole-chain call wall / largest gamma strike | $750 | Where the most November 17 option value expires worthless. It is also the biggest call pile across all expirations (85,778 contracts). |
| Upper implied rail | $749.50 | Top of the one-day expected move. |
| Swing resistance | $747.69 | Nearest chart pivot overhead. |
| Large gamma strike | $745 | Heavy combined open interest; a close above it invalidates the bearish lean. |
| Spot / large gamma strike | $739.95 / $740 | SPY sits on a heavily traded strike. |
| Put wall (November 17) / large gamma strike | $735 | Heaviest put open interest for tomorrow's expiration (2,386 contracts); the first floor. |
| Swing support | $732.34 | Nearest chart pivot below. |
| 200-day moving average | $732.16 | Long-term trend line; price is still 1.1% above it. |
| Lower implied rail | $730.40 | Bottom of the one-day expected move. |
| Whole-chain put wall | $730 | Largest put pile across all expirations (207,057 contracts); the second-largest gamma strike. |
| 52-week low | $629.28 | Distant floor; SPY is 17.6% above it. |
Note that the November 17 walls ($752 call / $735 put) differ from the whole-chain walls ($750 call / $730 put). For tomorrow's session, the November 17 levels are the ones that apply.
Max pain at $750 sits slightly above the top of the implied range. That gap is a sign of how far the stock fell away from where open contracts were positioned, not a target.
Positioning and unusual flow
Dealer gamma (estimate). Market makers hedge the options they've sold. One rough estimate suggests their positioning is negative gamma both for the November 17 expiration and across the whole chain. In this regime their hedging tends to amplify moves: they sell into drops and buy into rallies. The estimate rests on an assumed sign convention, not observed dealer inventory, and no gamma-flip level was produced today. The practical takeaway is that a break of a wall is more likely to run than to stall.
Three flow items stood out among contracts that are still live:
- November 20 $750 puts. About 105,000 contracts traded, roughly $134 million in premium, and open interest rose by 4,936 to 60,113. These puts are already in the money, so this looks like large protective or directional positioning aimed at the rest of the week.
- November 17 $752 calls. Open interest rose from 124 to 1,896 contracts, which is what created tomorrow's call wall. Fresh call supply overhead tends to act as a lid.
- November 17 near-the-money calls ($740–$750). These traded 24,000–47,000 contracts each against only a few hundred open. That ratio suggests same-day trading of the bounce, not new positions held overnight.
The same-expiration $739 and $738 puts traded about 39,800 and 36,600 contracts. Both sides of tomorrow's chain were busy.
3 · Technical check
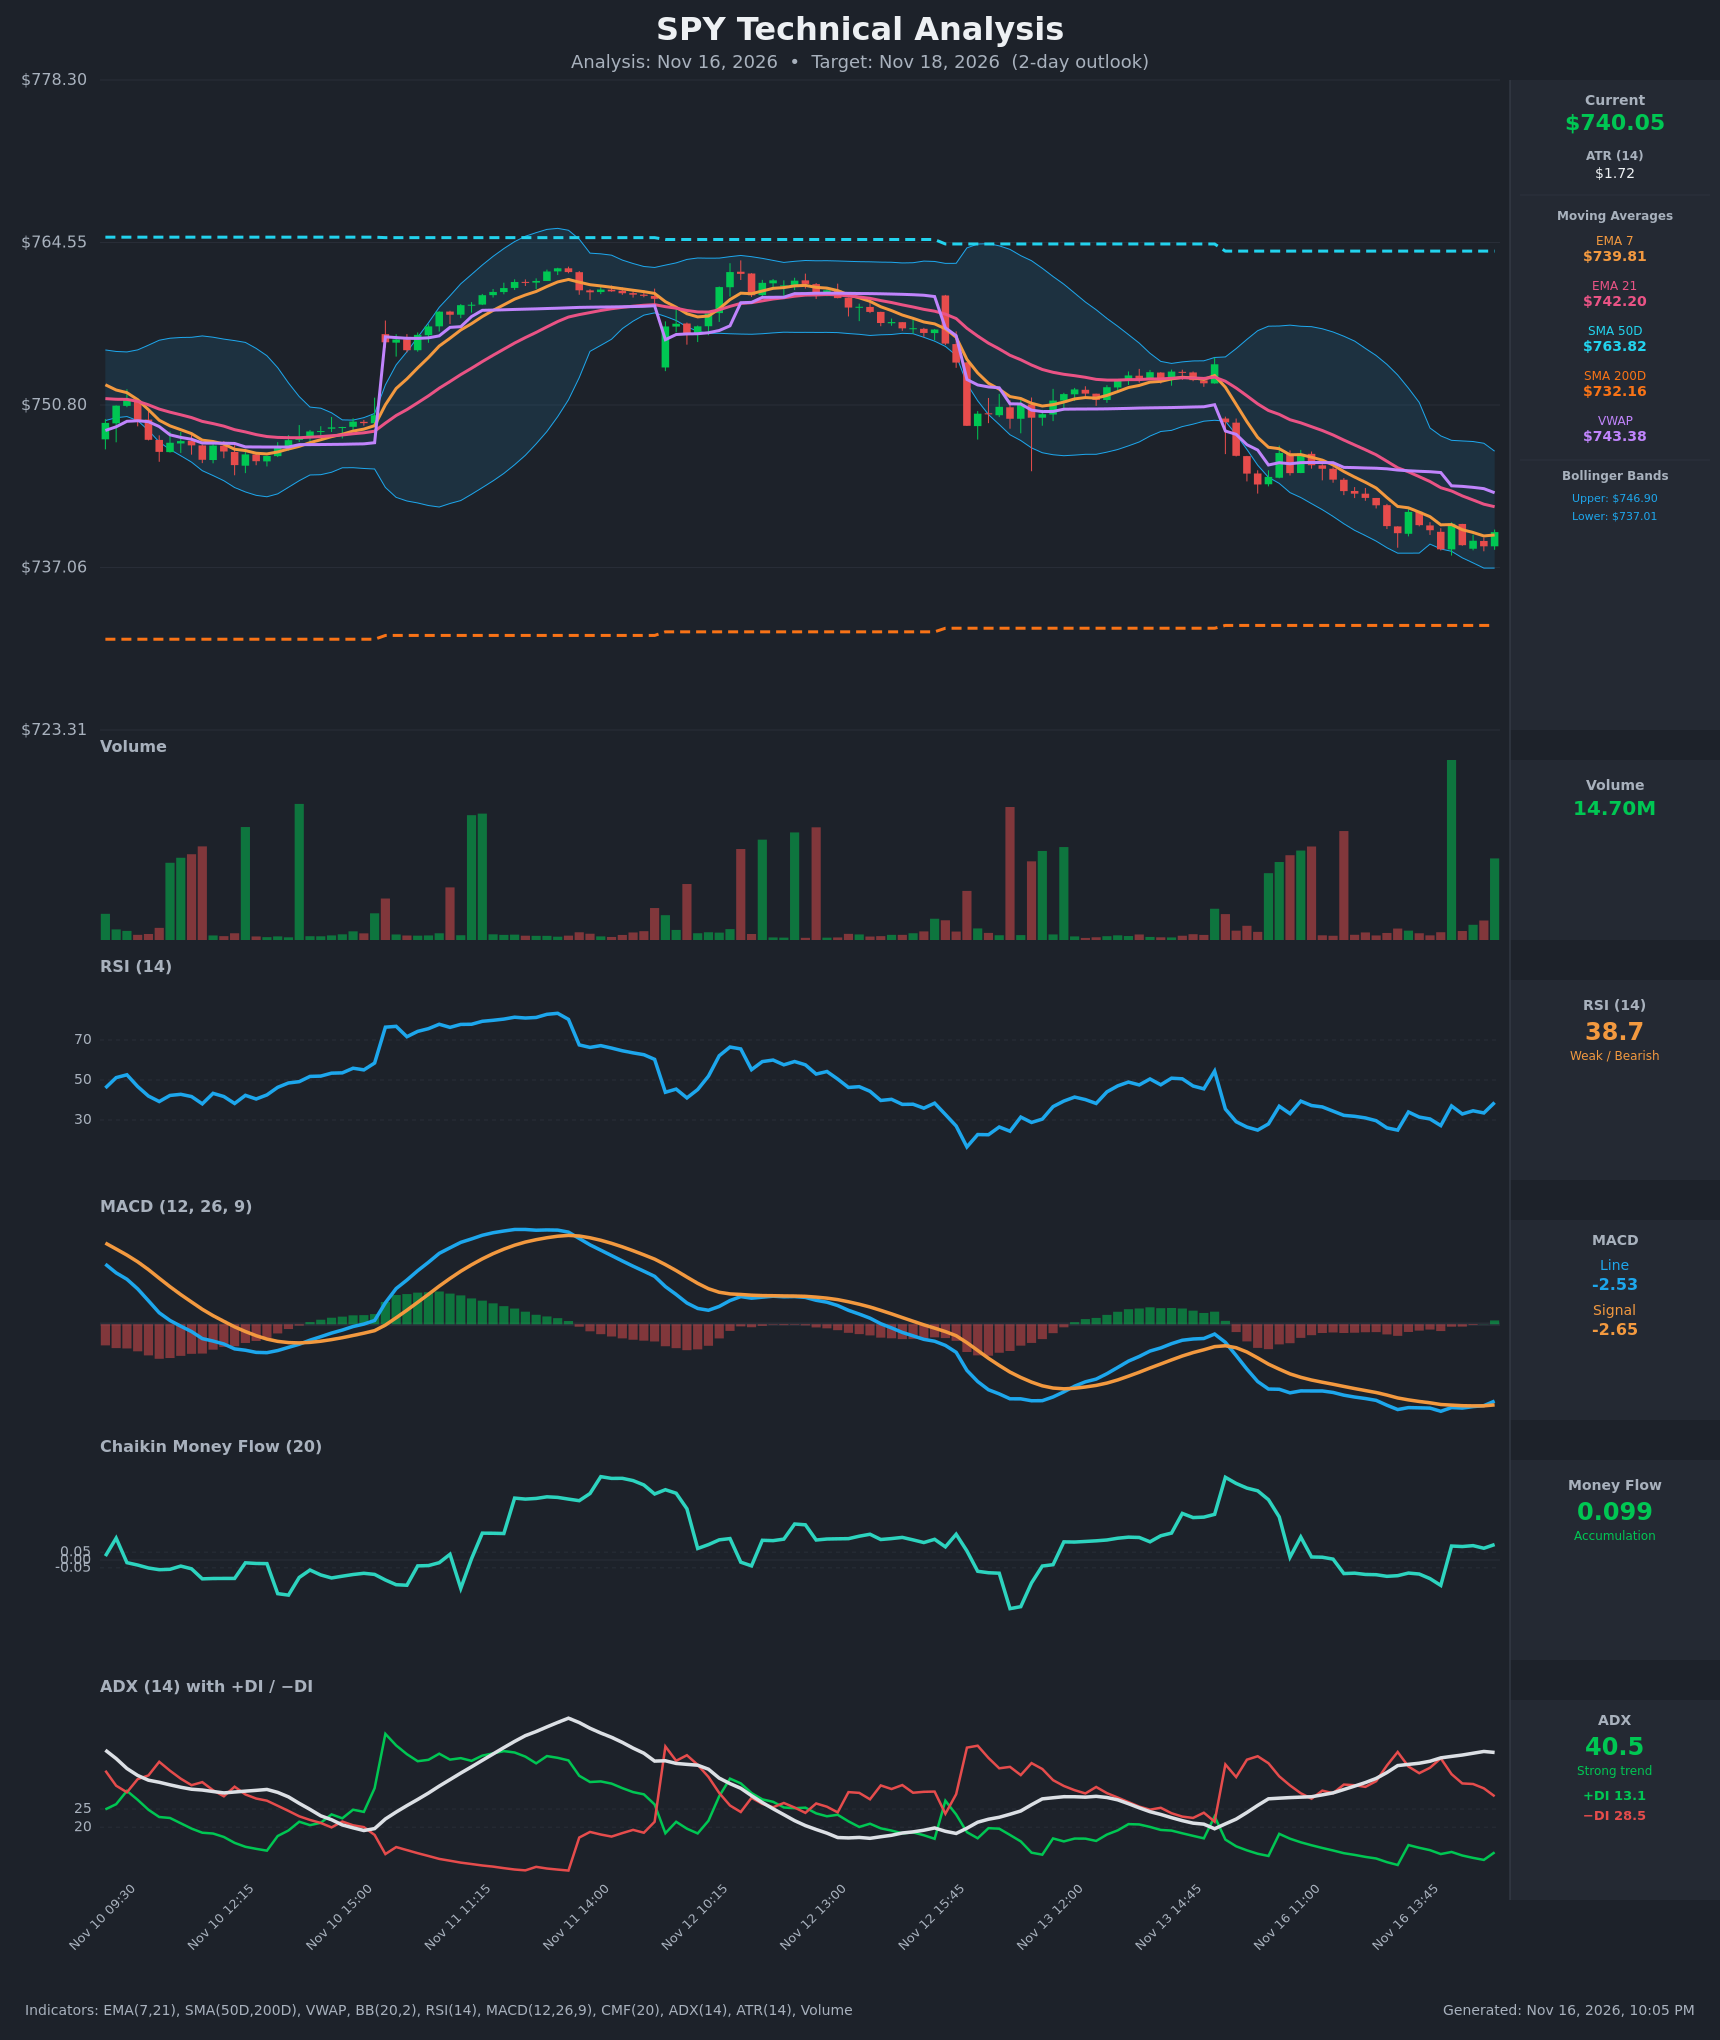
The next-session technical report is bullish:
- Target: $742.00 over a two-day horizon.
- Model range: $732.50 to $749.50.
- Reference price: $740.05, in line with the options snapshot.
- Key levels: support at $737.01 (lower Bollinger band) and resistance at $742.20 (21-period EMA).
- Dominant scenario: an oversold bounce, invalidated by a close below $737.00.
Two readings decide its tone. Money-flow (CMF) is positive at 0.099 even as price drifts lower, which points to dip buying under the surface. Trend strength (ADX) is above 40 with sellers firmly in control, which caps the conviction of any bounce.
Classification: Diverges. The model's direction runs against our slightly bearish options read, although its $742 target sits comfortably inside the options-implied range. The gap is small in dollars but meaningful in direction.
The resolution point is the $742–$743.50 zone, where the model's resistance and Monday's heavy call trading meet. A close there argues the bounce read is winning. Failure there and a slide through $737 argues the put buyers were right.
Model vs. Market: The options market implies $730.40–$749.50 into November 17. The next-session technical model targets $742.00. The chart sees an oversold bounce of about $2, while options flow is paying up to protect against the opposite, so the $742 area is where one side gets proven wrong.
The technical read did not flip the bias, but it shaped strikes below. The bearish spread's long leg sits at $740, below the model's $742.20 resistance. The condor's short call is placed above the model's $746 extension target.
Full technical write-up: Read the full next-session technical report →
4 · Three ways the session can go
If SPY pushes above the call wall ($752): To get there, SPY would first have to clear the $750 max-pain strike and the whole-chain call wall at the same price. That is a dense cluster of call open interest that tends to slow rallies. A clean break would leave thinner positioning until the 20-day average near $757.69. Because the gamma estimate is negative, that kind of move could extend rather than fade.
If SPY drifts between the walls ($735–$752): This is the base case for a one-day expiration. Heavy same-day trading near $740 and the large gamma strikes at $740 and $745 can keep price contained around the current level. The pull of max pain at $750 is weak this far below it. A drift in the $735–$745 band would let both the expected move and the skew premium bleed out.
If SPY breaks below the put wall ($735): This is the acceleration case. Below $735 there is little support until the $732 cluster (swing support at $732.34 and the 200-day average at $732.16), then the lower rail at $730.40 and the whole-chain put wall at $730. With hedging estimated to amplify moves, a break here is the most likely way for the session to move a full expected move rather than a fraction of one.
5 · Three defined-risk structures
Prices are end-of-day midpoints as of November 16, 2026. All structures are hypothetical unless flagged as an entered position. Verify live prices before trading; these will be stale by the open.
Because options are priced below delivered movement right now, the debit structure leads.
If you lean bearish: bear put debit spread
A debit spread means you pay up front and profit if SPY falls. Your loss is capped at what you paid.
- Trade: Buy the November 17 $740 put, sell the November 17 $735 put.
- Debit: $1.80 ($3.73 − $1.93) · Max profit: $3.20 ($320 per spread) · Max loss: $1.80 ($180) · Break-even: $738.20.
- Why it fits: Put buying, skew stretched well past its norm, and deeply negative short-dated sentiment all point lower. The spread targets the $735 put wall as its full-profit zone, and owning premium suits a premium that is thinner than about 93% of SPY's recent readings.
- Makes sense only if: SPY fails to reclaim the $742–$743.50 area early in the session.
- Invalidated if: SPY closes above $745.
- Managing it: Take profit near $2.50–$2.80 if SPY tags $735. Close the position before the final hour of trading on November 17 rather than holding into settlement. If SPY trades back above $742.20, cut it rather than hope.
- Liquidity note: The $740 puts quoted $3.71/$3.75 (4¢ wide) and the $735 puts $1.91/$1.95 (4¢). Fills near the midpoint are realistic.
- Analyze this position →
If you expect the range to hold: November 17 iron condor
An iron condor collects a credit by selling a put spread and a call spread. You keep the credit if SPY finishes between the short strikes.
- Trade:
- Put side: sell the $735 put, buy the $731 put.
- Call side: sell the $748 call, buy the $752 call.
- All legs expire November 17.
- Credit: $1.42 (put side $0.875 + call side $0.545) · Max profit: $1.42 ($142) · Max loss: $2.58 ($258) · Break-evens: $733.58 and $749.42.
- Why it fits: The short put sits on the $735 put wall and the long call on the $752 call wall. Both break-evens sit just inside the $730.40–$749.50 implied range. One caution applies: you're selling premium that hasn't been rich lately, since options are priced below what SPY has actually been delivering.
- Makes sense only if: SPY opens quietly between $737 and $743 and the overnight session doesn't push it toward either wall.
- Invalidated if: SPY closes below $735 or above $748.
- Managing it: Close at roughly 50% of the credit (about $0.71). Close the threatened side immediately if SPY trades through $735 or $748, because in a negative-gamma market a break tends to run. Don't hold into the final minutes.
- Liquidity note: The $735 puts were 4¢ wide, the $731 puts 3¢, the $748 calls 2¢, and the $752 calls 1¢. All are under 3% of mark, but four legs add up, so work the order at the midpoint.
- Analyze this position →
If you lean bullish: bull call debit spread
This spread costs a fixed debit up front and profits if SPY bounces.
- Trade: Buy the November 17 $740 call, sell the November 17 $745 call.
- Debit: $2.18 ($3.86 − $1.68) · Max profit: $2.82 ($282) · Max loss: $2.18 ($218) · Break-even: $742.18.
- Why it fits: This is the technical model's oversold-bounce case. It aims at the $742–$745 zone where the model's resistance, Monday's heavy call trading, and the $745 gamma strike sit. The short leg at $745 keeps it below the $747.69 swing resistance.
- Makes sense only if: SPY holds above $737 and closes an early bar above $742.20.
- Invalidated if: SPY closes below $735.
- Managing it: This trade fights the 20-day downtrend, so take profit early (around $3.50 if SPY reaches $744). Exit if $737 breaks, and close before the final hour on November 17.
- Liquidity note: The $740 calls quoted $3.85/$3.87 and the $745 calls $1.67/$1.69. Both are 2¢ wide, which makes for easy fills.
- Analyze this position →
If none of these: no trade
Standing aside is a reasonable choice tonight. The structures all expire tomorrow, and SPY already moved about $14 between the November 13 snapshot and Monday's close.
Positioning and the chart model point in opposite directions, so neither spread carries a decisive edge. With option prices below what SPY has been delivering, sellers aren't being paid enough for gap risk.
If you can't watch the position intraday, a one-day spread in a negative-gamma market is a poor fit. In that case the levels map is more useful than any trade.
6 · Quick FAQ
What is SPY's expected move for the next session? About ±$9.55 (±1.29%) into the November 17 expiration, a range of $730.40 to $749.50. That is based on straddle pricing as of the November 16 close.
Is SPY expected to go up or down tomorrow? Options positioning as of November 16 leans slightly bearish, driven by heavy put buying and expensive downside protection. That's a read of what traders have done, not a forecast. The actionable map is the $730.40–$749.50 range and the $735 put wall / $752 call wall.
Are SPY options expensive right now? IV rank 49/100 says option prices are higher than about half of the past year's range. However, they're running about 4.5 vol points below the movement SPY has actually delivered, which is thinner than 93% of its own recent readings. On that measure premium is not rich, which favors debit structures over selling.
Where is SPY's biggest options support and resistance? For the November 17 expiration, the put wall is $735 and the call wall is $752. Across all expirations they sit at $730 and $750.
What invalidates this read? A close above $745.
Methodology & disclosures. Data: end-of-day options-chain snapshot for SPY, 2026-11-16, generated 2026-11-16T22:05:00.274Z. Prices shown are midpoints and will differ from live markets. Momentum/positioning scores and volatility-premium comparisons are descriptive measurements of past option flow and past price movement — not investment advice, signals, forecasts, or guarantees. All trade structures are hypothetical. Every structure shown has a defined maximum loss; you can lose the entire max-loss amount. Options involve substantial risk and are not suitable for all investors.