SPY Options Are Pricing a $7.79 Move Into October 19 — Puts Are Piling Up Under $767
The options market implies a $755.46–$771.04 range for SPY into the October 19 expiration, while fresh put buying, steep skew and rich premium tilt the read slightly bearish. Here is the level map, what changed, and three defined-risk ways to trade the next session.
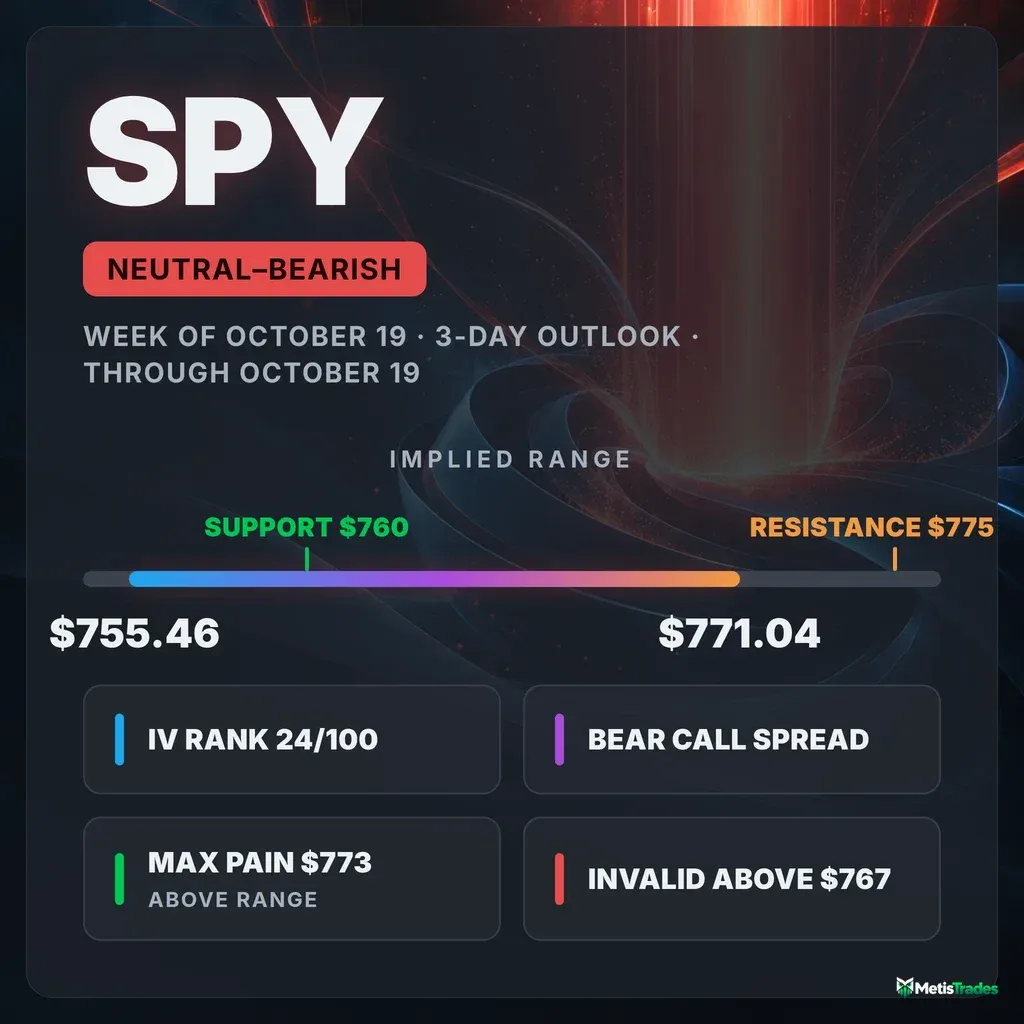
The options market implies a $755.46–$771.04 range into the October 19 expiration. Here is what is driving it, where the levels sit, and three defined-risk ways to trade the next session.
Published Friday, October 16, 2026 · Data as of Friday, October 16, 2026 close · Nightly update covering the next session (2026-10-19)
Explore the live SPY options data in the Detailed Options Analyzer →
Quick answer
| Item | Answer |
|---|---|
| Market bias | Neutral with a bearish tilt |
| Options-implied range (into October 19) | $755.46 – $771.04 (±$7.79, ±1.02%) |
| Major support | $767.00 next-session put wall. It now sits above spot, so the nearest support below is $760 (the whole chain's heaviest put strike), then $757.50 swing support |
| Major resistance | $775.00 (October 19 call wall) |
| Max pain (October 19) | $773 |
| Dealer gamma regime (estimate) | Negative: hedging tends to amplify moves. Flip level n/a (no flip estimate available today) |
| Volatility condition | Rising. IV rank 23.66/100 · premium rich: options priced ~4.3 vol pts above delivered movement |
| Technical check | Confirms (bearish, 4-day chart model targeting $758.50; projected range $749.50–$777.00) |
| Best-fitting strategy | Bear call spread (sell $768 / buy $773 calls, October 19) |
| Analysis invalidated if | SPY closes above $767 |
1 · What matters today
SPY closed Friday at $763.25. Our read of the options market is neutral with a bearish tilt for the next session. The main reason is a sharp one-day swing toward downside protection. Traders closed out about 416,000 call contracts and opened roughly 196,000 new puts, and puts now cost far more than calls.
The options market is pricing a move of about $7.79 either way by the October 19 expiration, which works out to a range of $755.46 to $771.04. The one level that changes the picture is $767. That strike holds the biggest pile of next-session puts, and it is also where the chart model places resistance. A close back above it means the put buying was hedging that got unwound, not a lean worth trading.
The technical model agrees with the tilt: it is bearish, with a $758.50 target. Keep in mind that SPY's longer-term trend is still intact, so much of this flow looks like protection rather than conviction.
2 · What the options market is pricing
What changed this week
SPY fell 1.97% over the past five sessions. Option prices rose much faster than that: at-the-money implied volatility climbed 19.6% in five days and 12.1% on Friday alone. Implied volatility is the market's estimate of how much SPY will move, baked into option prices.
The bigger shift was in positioning. Open interest is the number of contracts currently held open. The put/call open-interest ratio compares open puts to open calls, and above 1 means puts dominate. It went from 0.68 a week ago to 1.76 today, against a 7-day average of 1.04 and a 14-day average of 0.94. In plain terms, there are now 1.76 puts held open for every call, versus roughly one-for-one as recently as last week.
The single largest open-interest change came in the October 30 $760 puts. They added 52,784 contracts in one day, lifting open interest to 75,524. That is a sizable hedge parked just below Friday's close.
Sentiment in short-dated options flipped almost overnight. On Thursday, options expiring within a week showed an aggressive call chase. By Friday's close, that same group had swung firmly to the put side.
The trend read lines up with this. The past week's slide reads bearish, while the roughly one-month and two-month trends are flat. SPY is up about 0.1% over 20 sessions and down about 0.8% over 50. So the near-term pressure is real, but it is not yet a broken longer-term picture.
Into Friday's own expiration, the expiring $773 calls had added 11,275 contracts of open interest. That position settled worthless with SPY closing ten dollars below the strike.
Expected move
The expected move is the move the options market is pricing in, derived from what at-the-money straddles cost. For the October 19 expiration it is ±$7.79 (±1.02%) around $763.25, which gives a range of $755.46 to $771.04. That rung spans only one trading session (three calendar days including the weekend), so it is effectively the market's estimate of Monday's swing.
| Expiration | Implied move | Range around $763.25 |
|---|---|---|
| October 19 | ±1.02% | $755.46 – $771.04 |
| October 20 | ±1.32% | $753.18 – $773.32 |
| October 23 | ±1.97% | $748.21 – $778.29 |
| November 13 (~1 month) | ±4.08% | $732.11 – $794.39 |
The ladder widens smoothly, with no unusual jump between rungs. Each extra session adds roughly a third of a percent, so there is no scheduled event footprint in the chain. Note that the October 23 rung carries the highest implied volatility of the front week, at 14.24%.
Volatility
At-the-money implied volatility sits at 14.72%. IV rank shows where today's IV sits versus the past year. At 23.66/100, today's level is cheaper than about 76% of the past year's range. The IV percentile is higher, at about 55: on more than half of the past year's days, IV was lower than it is now.
The direction is clearly up. Today's 14.72% is well above both the 30-day average of 12.94% and the 90-day average of 13.69%. The jump in IV is unusually large compared with SPY's own recent history; here "unusual" means unusual for SPY, not versus the broader market.
The front-month term-structure read is unavailable today because of the expiry day. Term structure compares option prices across expiration dates. The roughly 60-day IV is 14.95%, essentially level with the front.
Realized volatility, meaning how much SPY has actually been moving, is about typical for the name. The 20-day reading is 10.46% and the 10-day is 10.29%, and movement is neither speeding up nor slowing down versus its own month.
The VIX closed at 19.99, around the 37th percentile of its 52-week range. SPY's IV has tracked it very closely over the past 60 sessions, so the jump in SPY option prices is part of a broad-market move, not something specific to SPY.
Premium rich or cheap. The volatility risk premium is the gap between how much movement options are priced for and how much SPY has actually delivered. When it is positive, option sellers have been collecting more than realized movement cost them. Right now SPY options are priced about 4.3 vol points above what the ETF has actually delivered over the past 20 sessions.
That gap's percentile is 87/100, meaning it is richer than 87% of SPY's own recent readings. It has also widened quickly, from about 2.3 points on October 9 to 4.3 today. That combination of a modest IV rank of 23.66 with an 87th-percentile premium over delivered movement favors collecting premium over the next session rather than buying it outright. The catch is that the premium is concentrated in puts, as the next section shows.
Skew and sentiment
Skew describes the fact that puts and calls the same distance from the stock price don't cost the same. When puts are pricier, traders are paying up for crash protection. Today, 25-delta puts trade at an implied volatility of 18.14% versus 12.06% for comparable calls. That is a gap of about 6.1 vol points, against a 60-day norm of about 3.6 and a 7-day average of about 4.0. The steepness is unusually stretched for SPY: traders are paying well above their usual premium to protect against a drop.
The put/call volume ratio measures how much put trading there is relative to calls. It printed 1.34, against a 7-day average of 1.01 and a 14-day average of 0.99. Total option volume ran 1.24 times its 20-day average. Among contracts that cleared an unusual-volume bar versus their peers, puts outnumbered calls 33 to 22.
Sentiment in short-dated options is broadly bearish across the curve. The 0–7 day group scores firmly negative, and the 8–30 day group is even more put-heavy, with new open interest and volume both skewed to puts. For context, the 7-day averages of both groups were mildly positive.
This is a fresh, one-to-two-day shift, not a slow build. With SPY still about 5% above its 200-day average, it reads more like hedging into an intact longer-term uptrend than a wholesale bearish bet.
The key levels map
| Level | Price | Why it matters |
|---|---|---|
| Whole-chain call wall | $785 | Heaviest call open interest across all expirations (80,876 contracts), but far above this session's range |
| 52-week high | $781.62 | The early-October peak; SPY is 2.35% below it |
| Swing resistance | $777.05 | Recent lower-high pivot (heuristic level) |
| Call wall (October 19) | $775.00 | The strike with the biggest pile of next-session call open interest, which often acts like a ceiling; also a large gamma strike |
| Max pain (October 19) | $773 | The price where the most option value would expire worthless; expirations sometimes gravitate toward it. Here it sits about $10 above spot |
| 20-day moving average | $771.18 | SPY closed 1.03% below it |
| Upper expected-move rail | $771.04 | Top of the options-implied one-session range |
| Large gamma strike | $770 | One of the chain's heaviest gamma concentrations, where hedging flows cluster |
| 50-day moving average | $768.50 | Lost on the latest leg down |
| Put wall (October 19) / TA resistance | $767.00 | The strike with the biggest pile of next-session put open interest (10,163 contracts), now above spot. It is also the chart model's resistance and this article's kill switch |
| Large gamma strike | $765 | Second-heaviest gamma strike in the chain |
| Spot (Friday close) | $763.25 | Reference price |
| TA support | $762.15 | The chart model's recent low and lower Bollinger Band |
| Whole-chain put wall | $760 | Heaviest put open interest anywhere in the chain (180,349 contracts) and the single largest gamma strike |
| 100-day moving average | $757.62 | Longer-term trend reference just below |
| Swing support | $757.50 | Recent pivot cluster (heuristic level) |
| Lower expected-move rail | $755.46 | Bottom of the options-implied one-session range |
| Swing support | $746.81 | Next pivot cluster below |
| 200-day moving average | $725.01 | SPY is 5.27% above it, so the long-term trend is intact |
The next-session walls ($767 put, $775 call) differ from the whole chain's walls ($760 put, $785 call). For Monday's expiration, the October 19 levels are the ones that apply.
Positioning and unusual flow
Market makers hedge the options they have sold. Under a common but unverified assumption about who holds what, one rough estimate puts SPY in negative dealer gamma, both across the whole chain and for the October 19 expiration specifically. In that regime, market-maker hedging tends to amplify moves rather than dampen them. Swings toward either rail could therefore run further than they would in a calmer, positive-gamma regime. No gamma-flip estimate could be computed today, so there is no flip level to quote.
Three pieces of flow stand out, all in contracts that are still live:
- October 19 $767 puts: 49,003 contracts traded, and open interest rose by 7,481 to 10,163. This is what built the next-session put wall, a fresh hedge placed right above where SPY closed.
- October 23 $769 puts: 44,693 contracts traded, about $38.8 million in premium, and open interest jumped 12,924 to 20,245. Someone paid up for in-the-money protection through next Friday.
- October 19 $770 calls: 84,303 contracts traded against just 1,935 open beforehand. That is heavy day-trading turnover in cheap upside lottery tickets, but only 648 net new contracts stuck. It is speculation, not a durable build.
3 · Technical check
The chart model's near-term report is bearish. It targets $758.50 on a 4-day horizon, with a projected range of $749.50 to $777.00. Its reference price ($763.335) matches the options snapshot almost exactly.
The target sits inside the options-implied range of $755.46–$771.04, and the direction matches the bearish tilt, so we classify it as Confirms. The model's own range is wider and skewed to the downside, which fits a longer horizon than one session.
Its two most decisive reads both point the same way. First, a strong and rising trend-strength reading, with sellers firmly in control. Second, a money-flow measure showing sustained distribution since Friday's midday selloff. The model's dominant scenario is trend continuation, invalidated by a sustained close above $767.00. That is the same $767 that anchors the options read.
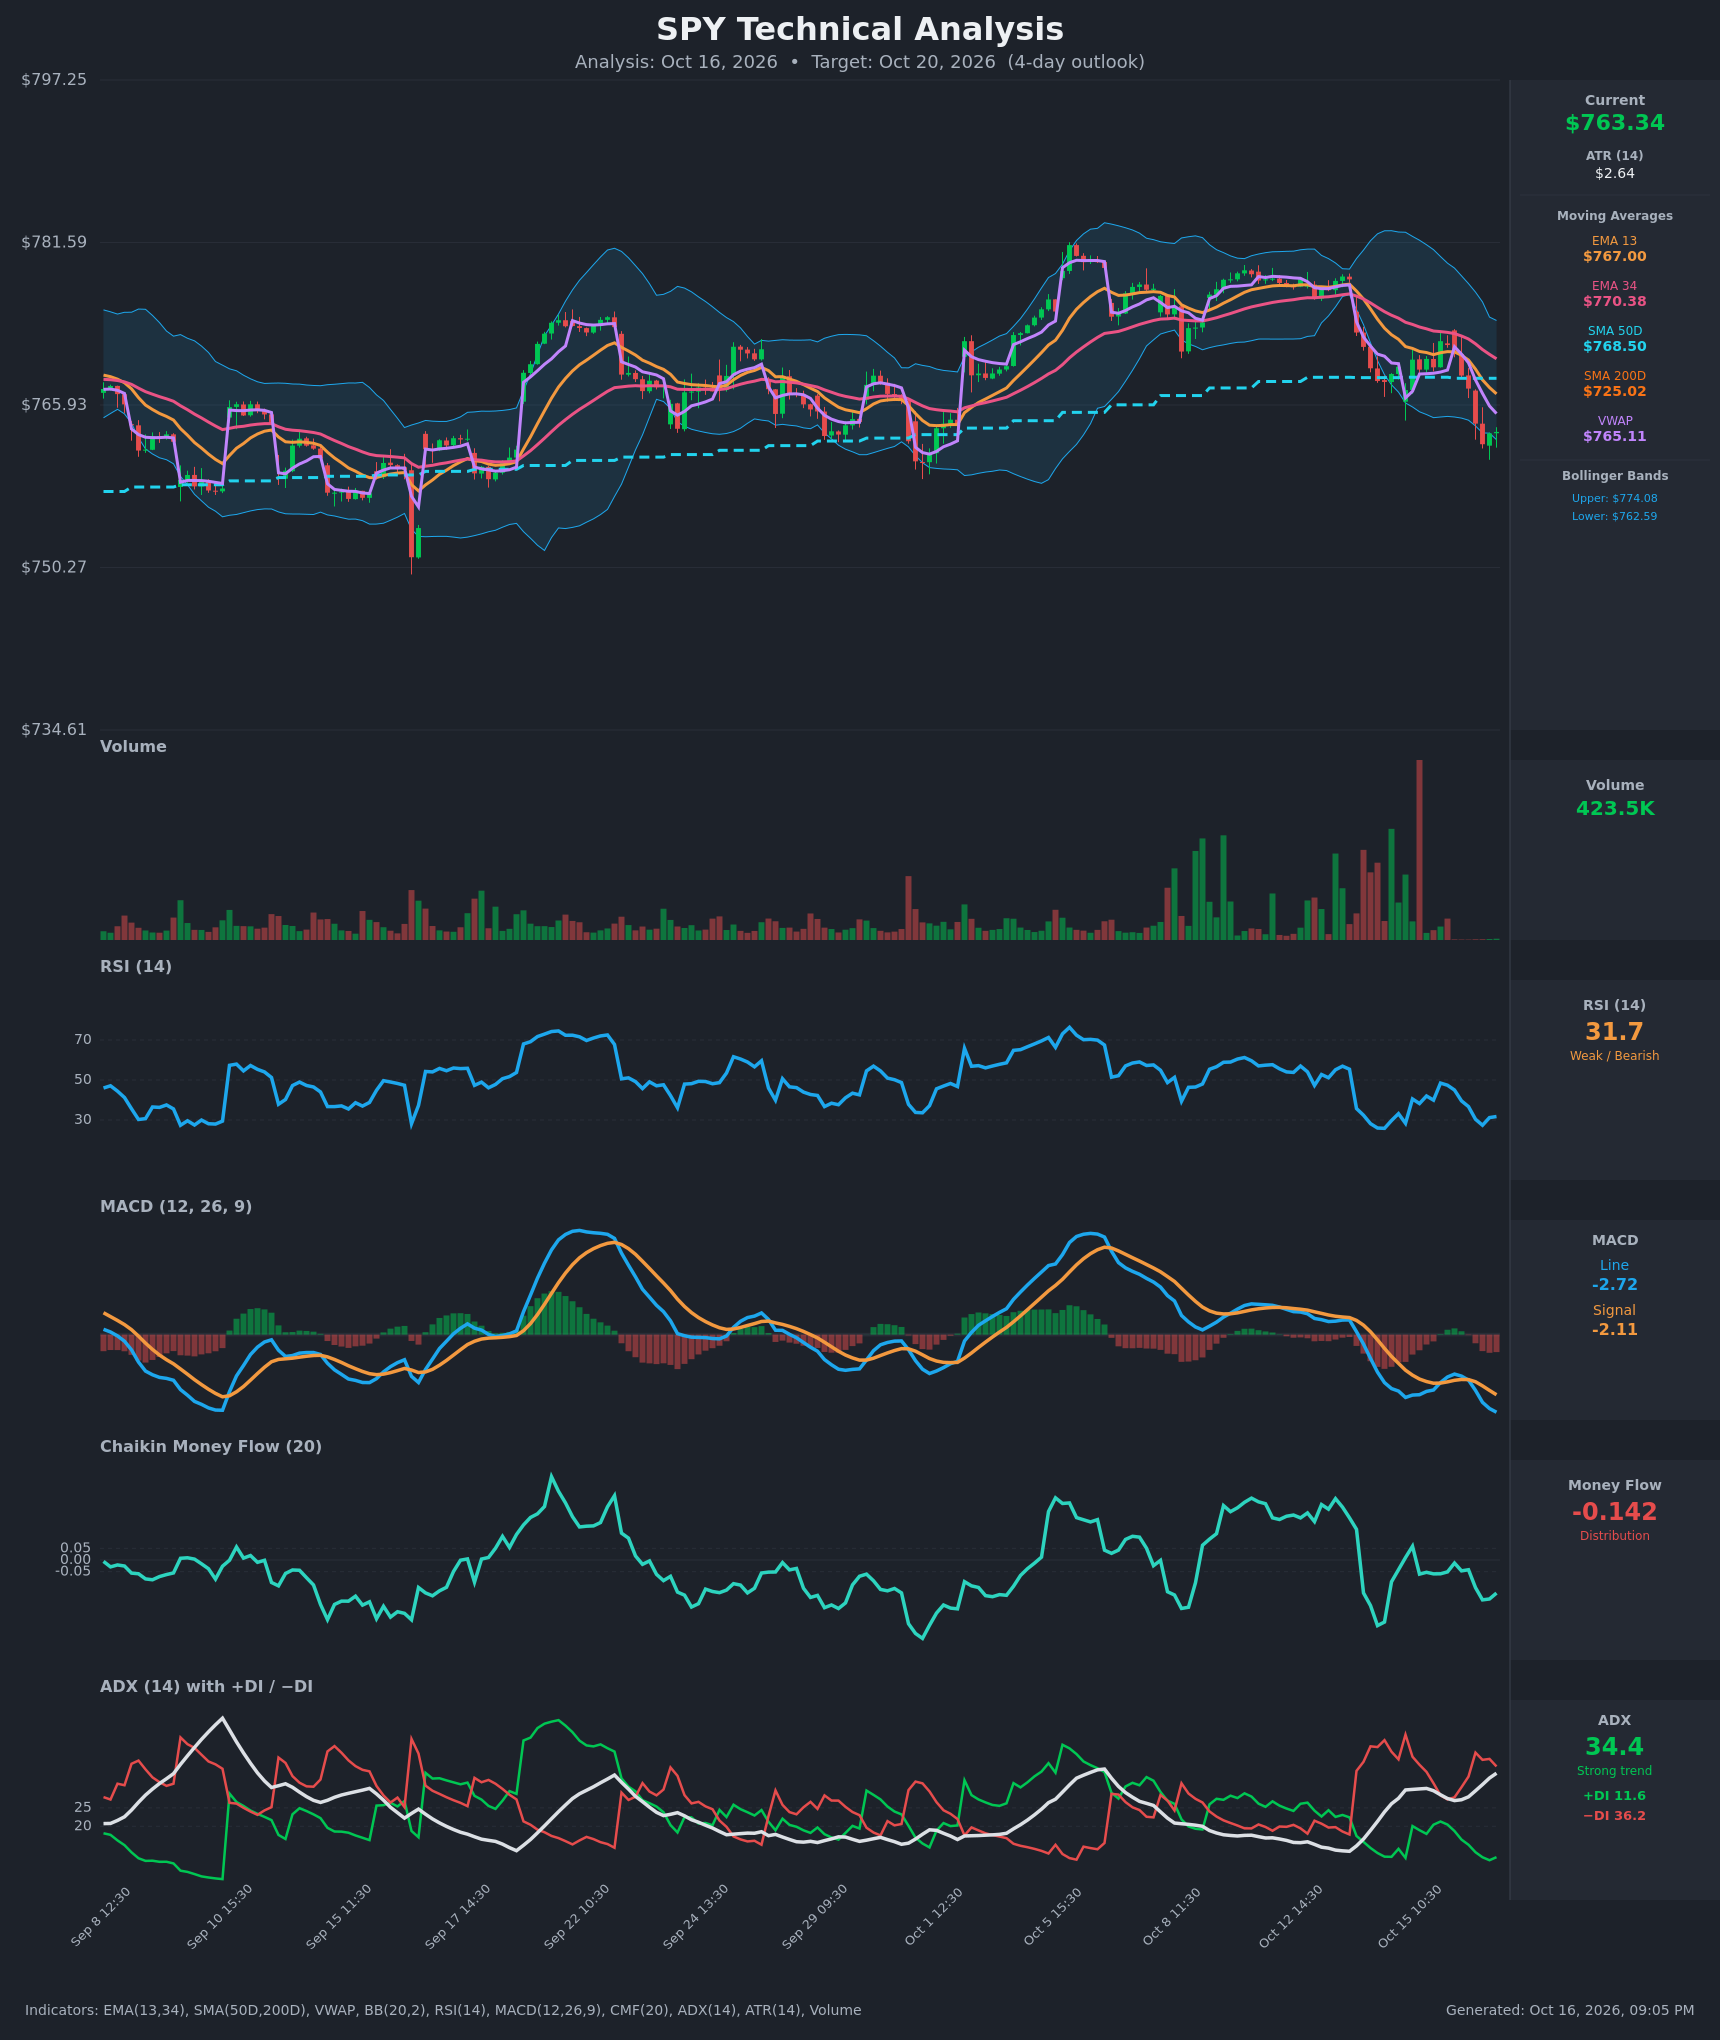
Model vs. Market: The options market implies $755.46–$771.04 into October 19; the 4-day technical model targets $758.50. The model's target sits about $3 above the options market's lower rail. A move to $758.50 would land inside what options are already pricing, so neither side is calling for a shock.
The technical read shaded strike selection in one way: the bear call spread's short strike sits just above the model's $767.00 resistance.
Full technical write-up: next-session report →
4 · Three ways the session can go
If SPY pushes back above the put wall ($767) toward the call wall ($775): Recovering $767 would mean the fresh next-session puts are losing value quickly. Hedgers unwinding them can add fuel, and max pain at $773 sits overhead as a possible magnet. Positioning thins out above $775, but that is $11.75 away, beyond the $771.04 rail the market is pricing. A close above $767 is where this article's tilt stops applying.
If SPY chops between $760 and $767: This is the base case for a one-session window. SPY would be bounded by the whole chain's biggest put strike ($760) below and the next-session put wall ($767) above, with large gamma strikes at $765 and $760 in between. Rich premium decays fastest in this branch. Max pain at $773 is too far away to exert much pull in a single session.
If SPY breaks below $760: That is the heaviest put strike in the entire chain. Losing it would bring the $757.50 swing support, the $755.46 lower expected-move rail and the chart model's $758.50 target into play quickly. With dealer gamma estimated negative, one rough reading suggests market-maker hedging would add to the selling rather than cushion it, so a break could travel faster than the averages imply.
5 · Three defined-risk structures
Prices are end-of-day midpoints as of Friday, October 16, 2026. All structures are hypothetical unless flagged as an entered position. Verify live prices before trading; these will be stale by the open.
Because premium is running rich versus delivered movement, the credit structure leads this section. All three structures use the October 19 expiration, so they live for exactly one session.
If you lean bearish: Bear call spread
- Trade: Sell the October 19 $768 call / buy the October 19 $773 call. A call credit spread: you collect premium up front and keep it if SPY stays below the short strike.
- Credit: $0.775 ($0.95 − $0.175) · Max profit: $77.50 · Max loss: $422.50 · Break-even: $768.78
- Why it fits: The short strike sits just above the $767 put wall and the chart model's $767.00 resistance, and both legs are inside the $775 call wall. It also sells into an 87th-percentile premium.
- Makes sense only if: SPY stays below $767 through the session and the put-heavy flow is not unwound at the open.
- Invalidated if: SPY closes above $767.
- Managing it: With one session left, there is no "wait and see." Close if SPY trades through $767 intraday on volume. Otherwise let it expire, or buy it back for a few cents late in the day to remove pin risk.
- Liquidity note: The $768 calls were quoted $0.94 / $0.96 (2¢ wide) and the $773 calls $0.17 / $0.18 (1¢ wide). Fills should be easy.
- Analyze this position →
If you expect the range to hold: Iron condor
- Trade: Sell the October 19 $756/$751 put spread and the October 19 $771/$776 call spread. You collect premium on both sides and keep it if SPY stays between the short strikes.
- Credit: $0.84 (puts $1.325 − $0.795 = $0.53; calls $0.365 − $0.055 = $0.31) · Max profit: $84 · Max loss: $416 · Break-evens: $755.16 and $771.84
- Why it fits: The short strikes sit right at the expected-move rails ($755.46 / $771.04). The put side sells the steep skew, and the long call sits just beyond the $775 call wall. Rich premium over delivered movement is exactly what this structure harvests.
- Makes sense only if: SPY stays inside the options-implied range. Negative dealer gamma is the main threat, since it can stretch a move past either rail.
- Invalidated if: SPY closes below $755 or above $771.
- Managing it: Close the threatened side if SPY touches $757 or $770 intraday. Take the remaining credit off rather than holding through the final hour.
- Liquidity note: Every leg is quoted 1¢ wide or less: $756 puts $1.32 / $1.33, $751 puts $0.79 / $0.80, $771 calls $0.36 / $0.37, $776 calls $0.05 / $0.06.
- Analyze this position →
If you lean bullish: Bull call spread
- Trade: Buy the October 19 $765 call / sell the October 19 $770 call. A debit spread: you pay up front and profit if SPY rises toward the short strike.
- Debit: $1.515 ($2.03 − $0.515) · Max profit: $348.50 · Max loss: $151.50 · Break-even: $766.52
- Why it fits: It is the counter-trend relief-bounce case. A reclaim of the chart model's $765.11 VWAP could run into its $767–$770 target zone, with max pain at $773 overhead. Selling the $770 call offsets some of the rich premium you would otherwise be paying.
- Makes sense only if: SPY reclaims $765 early and holds above $767. Without that, the trade fights both the flow and the trend.
- Invalidated if: SPY closes below $762.
- Managing it: Take profits near $769–$770 rather than waiting for the last dollar. Exit if $762.15 breaks, because time decay on a one-session debit is brutal.
- Liquidity note: The $765 calls were quoted $2.02 / $2.04 (2¢ wide) and the $770 calls $0.51 / $0.52 (1¢ wide).
- Analyze this position →
If none of these: no trade
Premium is rich, which normally argues for selling it. Standing aside can still be the better call. The richness arrived in a single day of put buying, the dealer-gamma estimate is negative, and every structure here has just one session to work.
That combination means a gap at Monday's open can push a short spread to max loss before you can react. The credit on offer is small next to the risk: $77.50 to $84 of potential profit against $416 to $422.50 of potential loss. If you cannot watch the open, or if you do not want to bet on whether Friday's hedges get unwound or extended, waiting for the October 23 or later expirations is a legitimate choice.
6 · Quick FAQ
What is SPY's expected move for the next session? About ±$7.79 (±1.02%) into the October 19 expiration, a range of $755.46 to $771.04, based on straddle pricing as of the October 16 close.
Is SPY expected to go up or down tomorrow? Options positioning as of October 16 leans neutral with a bearish tilt, driven by heavy new put buying and the steepest put skew in months. That is a read of what traders have done, not a forecast. The actionable map is the $755.46–$771.04 range, the $760 support and the $775 call wall.
Are SPY options expensive right now? IV rank of 23.66/100 says option prices are low relative to their 52-week range. On top of that, they are running about 4.3 vol points above the movement SPY has actually delivered, richer than 87% of SPY's own recent readings. Puts carry most of that richness, which favors selling premium over buying it.
Where are SPY's biggest options support and resistance for October 19? The October 19 put wall is $767.00, which now sits just above spot. The next-session call wall is $775.00. Across the whole chain, the heaviest put strike is $760.
What invalidates this read? An SPY close above $767.
Methodology & disclosures. Data: end-of-day options-chain snapshot for SPY, 2026-10-16, generated 2026-10-16T21:05:16.267Z. Prices shown are midpoints and will differ from live markets. Momentum/positioning scores and volatility-premium comparisons are descriptive measurements of past option flow and past price movement — not investment advice, signals, forecasts, or guarantees. All trade structures are hypothetical. Every structure shown has a defined maximum loss; you can lose the entire max-loss amount. Options involve substantial risk and are not suitable for all investors.