SPY Expected Move for Oct 20: ±$5.44, Key Levels and Defined-Risk Trade Ideas
Options imply a $761.04–$771.92 range for SPY into the October 20 expiration, with positioning leaning neutral with a bearish tilt and premium unusually rich versus delivered movement. Here are the levels that matter and three defined-risk ways to trade the next session.
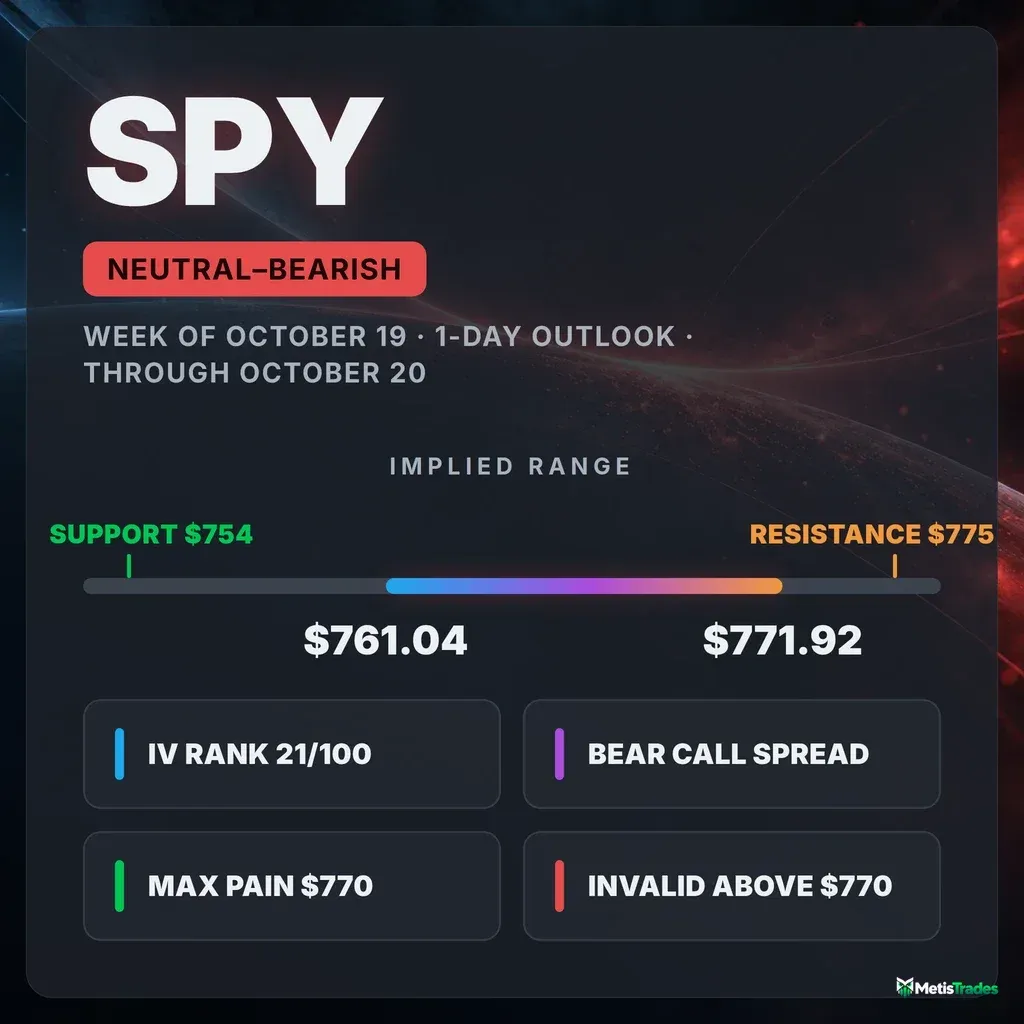
The options market implies a $761.04–$771.92 range for SPY into the October 20 expiration. Here's what's driving it, where the key strikes sit, and three defined-risk ways to trade the next session.
Published Monday, October 19, 2026 · Data as of Monday, October 19, 2026 close
Explore the live SPY options data in the Detailed Options Analyzer →
Quick answer
| Item | Answer |
|---|---|
| Market bias | Neutral with a bearish tilt |
| Options-implied range (into October 20) | $761.04 – $771.92 (±0.71%, about ±$5.44) |
| Major support | $754.00 (October 20 put wall); whole-chain heaviest put strike $760 |
| Major resistance | $775.00 (October 20 call wall); whole-chain heaviest call strike $770 |
| Max pain (October 20) | $770.00 |
| Dealer gamma regime (estimate) | October 20 contracts: positive — hedging tends to dampen moves; whole chain: negative — hedging tends to amplify moves; flip level ≈ $725 |
| Volatility condition | Rising (over five sessions) — IV rank 21/100 · premium rich: options priced ~5.4 vol pts above delivered movement |
| Technical check | Confirms (bearish, 2-day model aimed at October 20; target $764.80, model range $758.00–$775.00) |
| Best-fitting strategy | Bear call credit spread (October 20 $770/$775), if you accept the one-day risk |
| Analysis invalidated if | SPY closes above $770 |
1 · What matters today
SPY closed at $766.48, and our read of the options market is neutral with a bearish tilt for tomorrow's session (2026-10-20). The main reason is that traders have spent the past week adding downside protection. Put contracts held open now outnumber calls by about 1.4 to 1, up from roughly 1 to 1 two weeks ago, and puts cost noticeably more than usual relative to calls. Options are pricing a move of about $5.44 either way, which gives a range of $761.04 to $771.92 through the October 20 expiration. The level that changes the picture is $770. It is the strike with the heaviest call open interest across the whole chain and the price where the most October 20 option value would expire worthless. A close above it undoes the bearish lean. The 2-day technical model also leans bearish, with a target of $764.80 that sits inside the options range.
2 · What the options market is pricing
What changed this week
SPY is down 1.49% over the past five sessions and 0.91% over twenty. The bigger shift is in how traders are positioned:
- Puts building. The put/call open-interest ratio (how many put contracts are held open for every call) jumped from 0.77 to 1.43 over five days. Its 14-day average is 0.96 and its 7-day average is 1.11, so the hedging is recent and fast.
- Implied volatility up. Implied volatility rose 14.3% over five sessions, though it eased 2.8% today as the market bounced off Friday's low.
- Biggest single open-interest change. On contracts that can still be traded, the largest move was in the October 23 $769 puts, which added 12,737 contracts to 32,982 open. That is now the largest put position in that week's chain, sitting just above spot.
- Settled history. Into today's same-day expiration, the October 19 $770 calls added 11,660 contracts of open interest on nearly 800,000 traded. That activity has now settled and doesn't carry forward.
The short-term trend read is bearish over the past week, while the roughly one-month and two-month reads are flat. The selling pressure is a near-term story, not a broken bigger picture. A fast-versus-slow momentum crossover turned bearish on October 13 and hasn't reversed since.
Expected move
The expected move is the move the options market is pricing in, derived from what straddles cost. For the October 20 expiration (one day to go), at-the-money options imply ±0.71%, or about ±$5.44 around the $766.48 snapshot price. That puts the one-session range at $761.04 to $771.92.
| Expiration | Implied move | Range around $766.48 |
|---|---|---|
| October 20 (1 day) | ±0.71% | $761.04 – $771.92 |
| October 23 (4 days) | ±1.54% | $754.68 – $778.28 |
| October 30 (11 days) | ±2.53% | $747.09 – $785.87 |
| November 20 (32 days) | ±4.26% | $733.83 – $799.13 |
The ladder widens roughly with the square root of time, which is what you'd expect with no scheduled jump risk baked in. Notably, the October 23 lower edge ($754.68) lands almost exactly on the next-session put wall at $754.
Volatility
Current level. At-the-money implied volatility (the market's estimate of how much SPY will move, baked into option prices) is 14.30%. That is above its 30-day average of 13.08% and its 90-day average of 13.65%, and 21.7% higher than a month ago. IV rank, which shows where today's IV sits versus the past year, is 21/100. In other words, option prices are cheaper than 79% of the past year's readings, even after this week's rise. The 7-day average IV rank was about 15, so the rank is climbing off a low base.
Term structure. The front-month versus two-month comparison isn't available today, because the nearest expiration settled at today's close. The ~60-day ATM IV reads 14.73%.
VIX. The VIX closed at 18.44, a 52-week rank of 28. SPY's implied volatility has tracked it tightly over the past 60 sessions.
Realized movement. Compared against SPY's own recent history, realized movement over 20 days is unusually subdued at about 8.9% annualized. However, the past five sessions have been running about a third faster than that monthly pace. The tape has woken up from a quiet stretch.
Premium rich or cheap? The volatility risk premium is the gap between how much movement options are priced for and how much SPY has actually delivered. When it's positive, option sellers have been collecting more than realized movement cost them. Today, SPY options are priced about 5.4 vol points above what the ETF has delivered over the past 20 days.
- That gap sits at the 94th percentile of this stock's own recent readings, meaning it is richer than about 94% of them.
- It has widened quickly, from about 3 points a week ago and about 2.3 points on October 9.
- For SPY, a gap this wide is well above its usual range.
The combination of a low IV rank (21) and a 94th-percentile premium over delivered movement means options are cheap versus the past year but expensive versus what the market has actually been doing. That favors collecting premium over owning it this session, with defined risk.
Skew and sentiment
Skew. Puts and calls the same distance from the stock price don't cost the same. When puts are pricier, traders are paying up for crash protection. Right now, 25-delta puts carry 16.96% implied volatility versus 11.99% for comparable calls, a gap of about 5.0 vol points. The 60-day norm for SPY is 3.5 points and the 14-day average is about 3.6. Traders are paying roughly 1.4 points more than usual for downside insurance, which is a stretched reading versus this ETF's own recent history.
Put/call ratios. The put/call volume ratio (put activity relative to calls; above 1 means puts dominate) is 1.05, close to its 7-day average of 1.03. The open-interest ratio of 1.43 is the bigger tell. Among contracts trading at unusually high volume relative to their peers, there were 36 put contracts versus 26 call contracts, a put-side tilt that is unusually heavy for SPY.
Today's counterpoint. Net new open interest leaned to calls today: about 69,665 call contracts were added while put open interest fell by roughly 209,000. Some of the protection bought last week was taken off on the bounce.
Sentiment by expiration. Short-dated options lean bearish across the board:
- 0–7 day contracts score −15.
- 7–30 day contracts score −23.
- Every expiration bucket leans the same way, a "broadly bearish" picture.
- A week ago, the 7-day averages for those buckets were +9 and 0, a calm read.
The key levels map
| Level | Price | Why it matters |
|---|---|---|
| 52-week high | $781.62 | SPY sits 1.94% below it, still near the top of its yearly range |
| Swing resistance | $777.05 | Heuristic pivot cluster from the recent highs |
| Call wall (October 20) | $775.00 | Heaviest call open interest for the next-session expiration (6,060 contracts); also a top-five gamma strike chain-wide |
| Top of implied range | $771.92 | Upper edge of the one-day expected move |
| 20-day moving average | $770.83 | Price is 0.56% below it |
| Max pain (October 20) / whole-chain call wall | $770.00 | Where the most October 20 value expires worthless; also the single largest call position across all expirations (104,428 contracts) and the biggest gamma strike |
| Gamma strike | $769.00 | Fourth-largest gamma concentration; also the October 23 put wall |
| 50-day moving average | $768.37 | Price closed just below it |
| Spot (close) | $766.48 | Reference price |
| Gamma strike | $765.00 | Third-largest gamma concentration, just under spot |
| Bottom of implied range | $761.04 | Lower edge of the one-day expected move |
| Whole-chain put wall | $760.00 | Largest put position across all expirations (177,064 contracts), including 73,154 in the October 30 contracts |
| Swing support / 100-day MA | $757.66 / $757.78 | Structural support and moving average nearly stacked together |
| Put wall (October 20) | $754.00 | Heaviest put open interest for the next-session expiration (6,230 contracts) |
| Swing support | $746.81 | Next pivot cluster lower |
| 200-day moving average | $725.44 | Long-term trend line, 5.66% below price |
| Gamma flip (estimate) | ~$725 | One rough estimate of where market-maker hedging turns from cushioning to accelerating; far below the action |
The next-session walls ($754/$775) are wider apart than the whole-chain walls ($760/$770). For tomorrow's expiration specifically, the $754–$775 corridor is the relevant one.
Positioning and unusual flow
Dealer gamma (estimate). Market makers hedge the options they've sold, and the direction of that hedging depends on their gamma position.
- For the October 20 contracts alone, one rough estimate puts dealers in positive gamma. In that regime, their hedging tends to dampen moves, which supports a pin-style session.
- Across the whole chain, the same estimate reads negative, where hedging tends to amplify moves.
- For tomorrow, the expiring contracts' dampening read applies most directly. A move that pushes into later-dated positioning could feel the amplifying side.
Flow worth noting:
- October 20 $767 puts: 78,056 contracts traded against just 1,299 open, about $16.4 million in premium. That is heavy same-day-into-tomorrow hedging right at the money.
- October 20 $770 calls: 73,568 traded, and open interest rose by 3,185 to 4,562. Traders were also positioning for a drift up toward max pain.
- October 30 $760 puts: 64,354 traded on top of 73,154 already open, roughly $31.4 million in premium. This is the single largest-dollar line in the chain and the core of the whole-chain put wall. Big money is anchoring protection at $760 for the rest of the month.
3 · Technical check
The 2-day technical model, aimed at October 20, leans bearish with a target of $764.80 and a projected range of $758.00 to $775.00.
- Classification: confirms. The direction matches our bearish tilt, and the target sits inside the options-implied range of $761.04–$771.92.
- Range width. The model's range is wider than what options are pricing on both sides, but its central estimate is about $1.68 below spot.
- Key levels. The model flags support at $762.00 and resistance at $768.50, the VWAP/50-day average cluster.
- Dominant scenario. Its main case is a range breakdown toward $764.50–$763.50, invalidated by a close back above $768.50.
Two readings temper the bearish call. Trend strength (ADX) is very weak at about 12, so this is a range-bound market rather than a trending one. Money-flow readings (CMF) remain positive, a mild accumulation signal running against the price dip. That fits the options picture: hedging is building, but nothing is breaking.
Model vs. Market: The options market implies $761.04–$771.92; the 2-day technical model targets $764.80. Both point to a session spent inside the range, with a slight downward lean rather than a breakout.
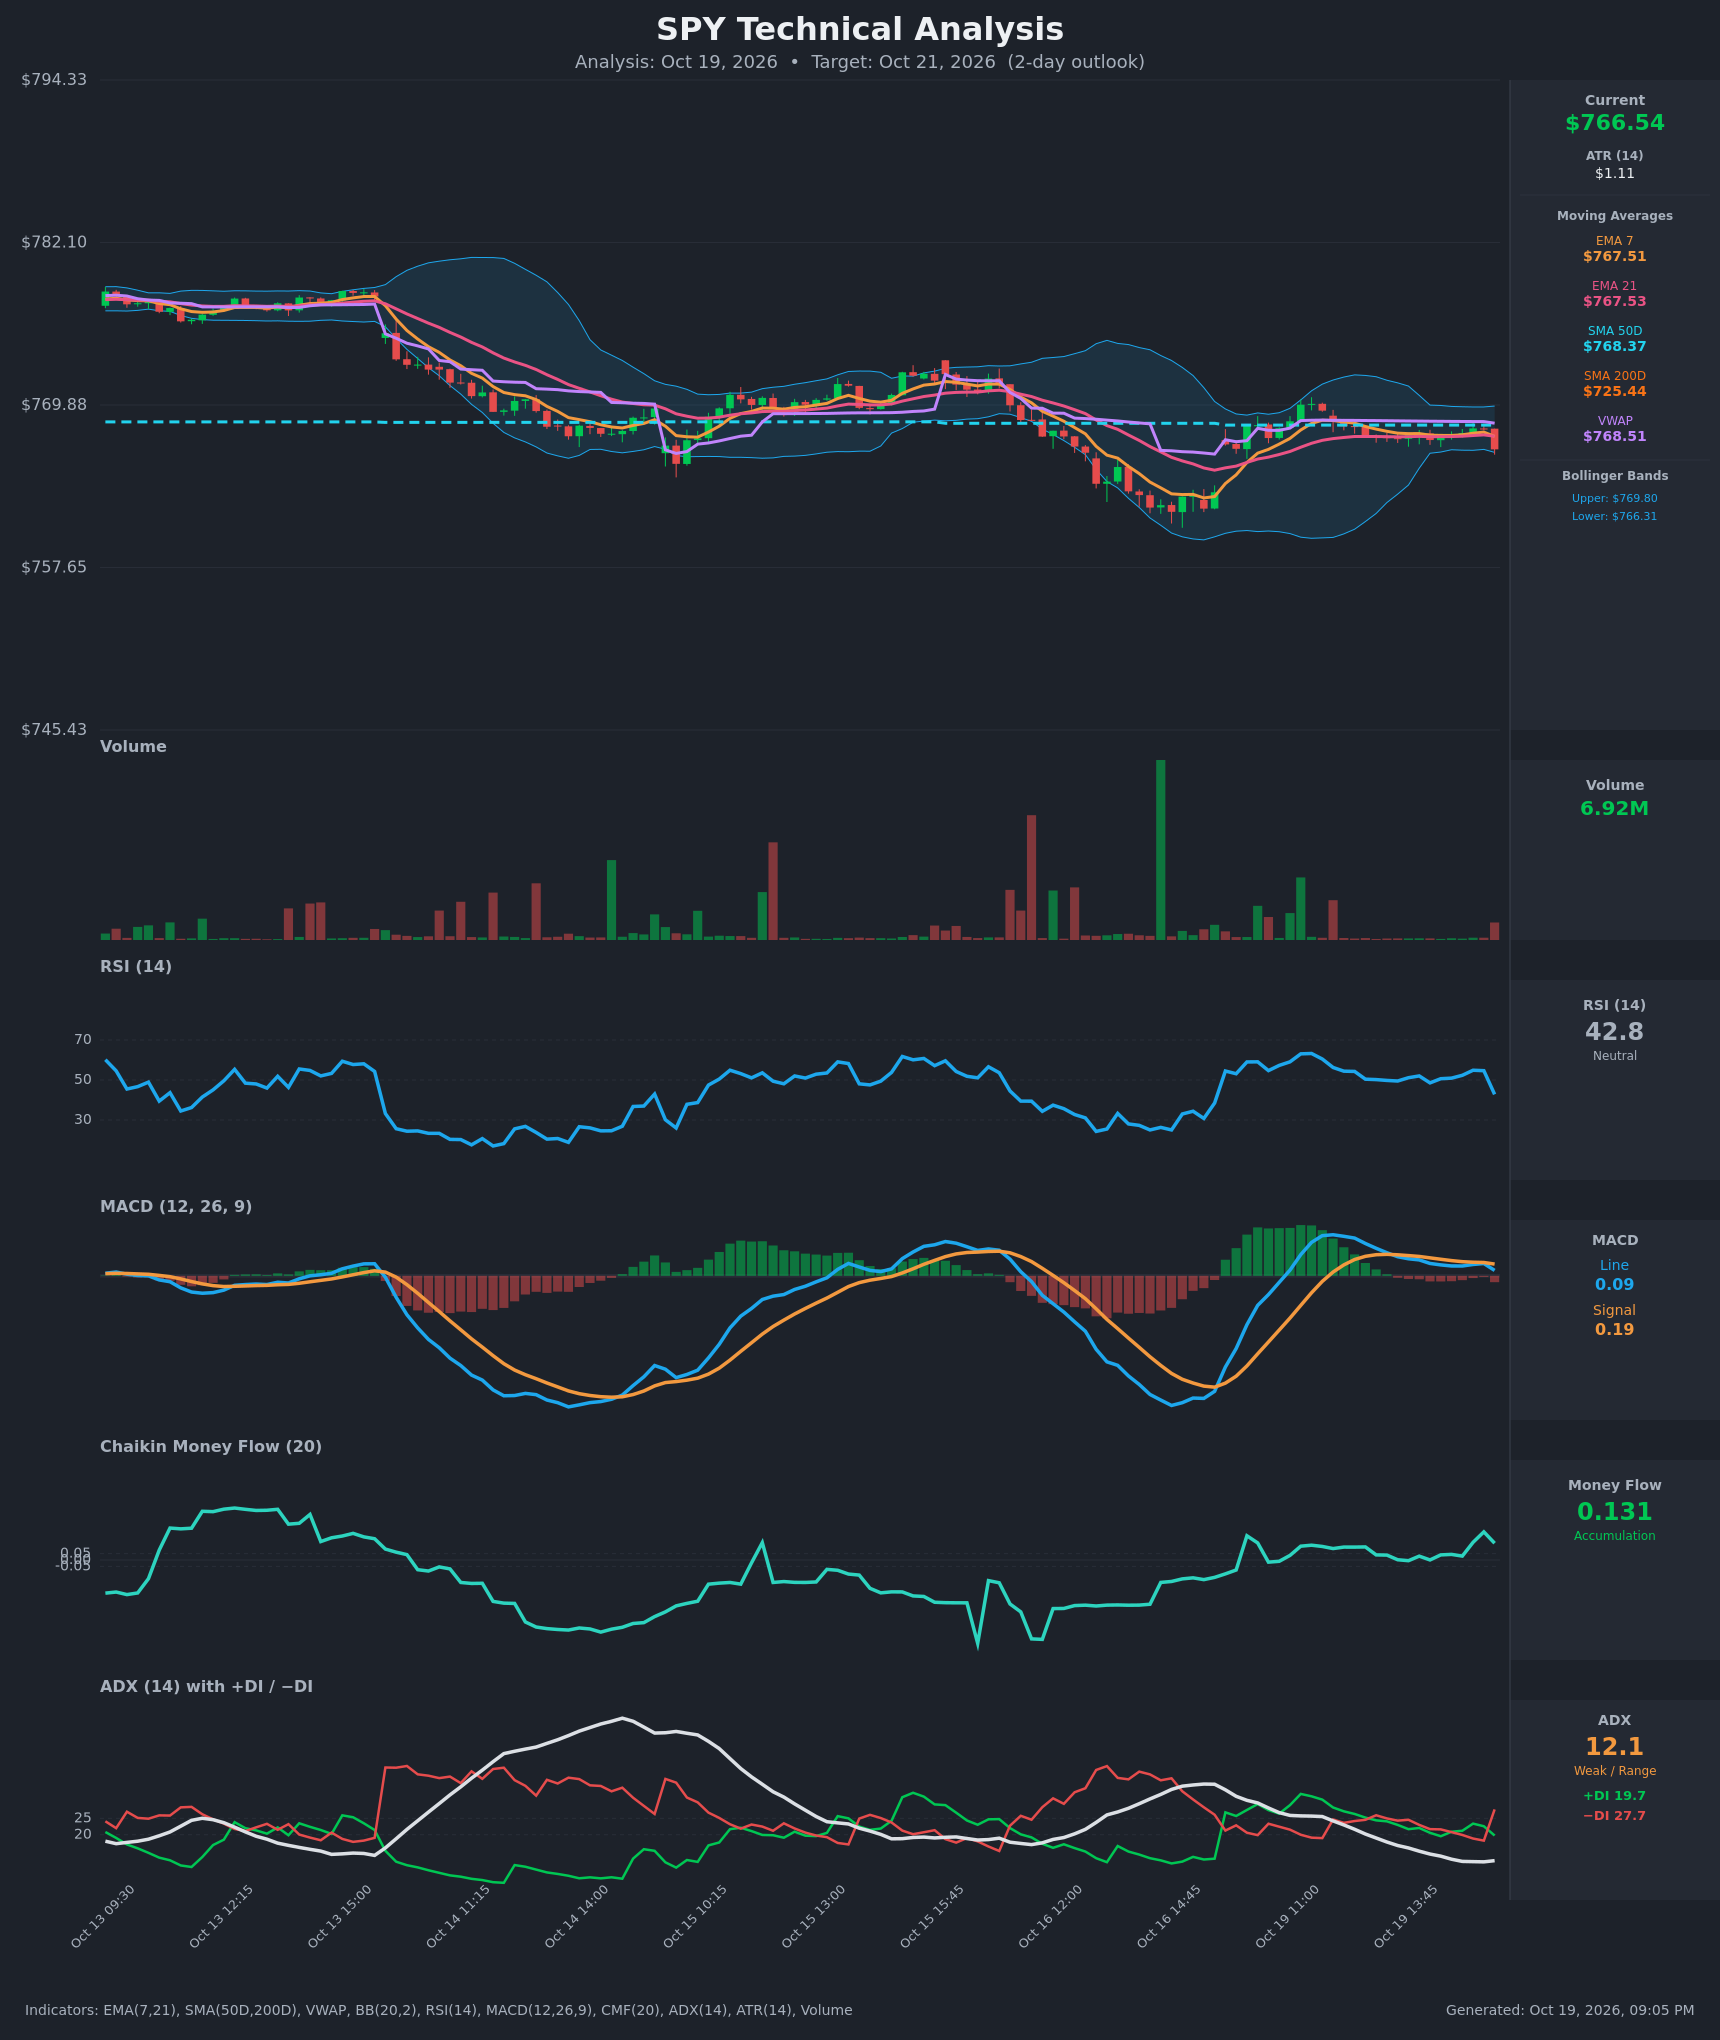
Because the TA confirms, the iron condor's short put below is placed at $761, just under the model's $762 support. The bear call spread's short strike sits above the model's $768.50 resistance.
Full technical write-up: Read the full next-session technical report →
4 · Three ways the session can go
If SPY pushes above the call wall ($775): Heavy call open interest overhead, including the whole-chain $770 call wall that would already have been crossed, tends to slow rallies as call sellers hedge. A clean break leaves thinner positioning above until swing resistance at $777.05 and the 52-week high at $781.62. That move would sit well outside the $771.92 upper edge options are pricing.
If SPY drifts between the walls: This is the case positioning favors. With the October 20 contracts estimated in a dampening gamma regime, expiring open interest tends to pull price toward the strikes where the most value dies. Max pain at $770 sits above spot, so a quiet drift could actually mean a grind higher toward $768–$770, the 50-day average and the heaviest call strike. That is why a close above $770 is our invalidation line.
If SPY breaks below the put wall ($754): SPY would first have to cross the whole-chain put wall at $760 and the $757.66–$757.78 support cluster. Below $754, the put protection built this week stops acting as a cushion, and the whole chain's negative-gamma estimate suggests hedging could start to amplify the move. The gamma flip estimate (~$725) is far below, so a single session is unlikely to reach the zone where one rough estimate says market-maker hedging accelerates selling outright.
5 · Three defined-risk structures
Prices are end-of-day midpoints as of 2026-10-19. All structures are hypothetical. Verify live prices before trading — these will be stale by the open. Every structure below expires October 20, so these are one-session trades. Gamma is extreme at one day to expiration, and small moves swing the outcome.
If you lean bearish: bear call credit spread
Credit spread reminder: you collect premium up front and keep it if SPY stays below your short strike at expiration.
- Trade: Sell the October 20 $770 call, buy the October 20 $775 call
- Credit: $0.73 ($0.815 − $0.085) · Max profit: $73 · Max loss: $427 · Break-even: $770.73
- Why it fits: The short strike sits at the largest call position in the whole chain ($770) and max pain, and the long strike sits at the next-session call wall ($775). Premium is at a 94th-percentile richness versus delivered movement, and skew plus short-dated sentiment lean bearish.
- Makes sense only if: You accept that you're risking about $5.85 to make $1. The roughly 75% probability implied by the 0.25 delta is the trade-off.
- Invalidated if: SPY closes above $770
- Managing it: Take profits at 50–70% of the credit if SPY sags early. If SPY trades through $770 intraday with strength, close rather than hope for a reversal into the bell. The short-term-only bearish trend argues for not overstaying.
- Liquidity note: The $770 calls traded a penny wide ($0.81/$0.82) on 73,568 contracts. The $775 calls are also a penny wide ($0.08/$0.09), but that penny is about 12% of the price, so a cent of slippage on the wing is a real share of the credit.
- Analyze this position →
If you expect the range to hold: iron condor
- Trade: Sell the October 20 $761/$756 put spread and the October 20 $772/$777 call spread
- Credit: $0.70 (put side $0.555 − $0.185 = $0.37; call side $0.365 − $0.035 = $0.33) · Max profit: $70 · Max loss: $430 · Break-evens: $760.30 and $772.70
- Why it fits: Both short strikes sit just outside the options-implied range ($761.04–$771.92). The expiring contracts' estimated dampening gamma favors a pin, and rich premium versus delivered movement is exactly what condor sellers want. The put side is placed under the TA model's $762 support.
- Makes sense only if: You're comfortable that the recent pickup in day-to-day movement doesn't produce a move larger than one expected-move unit.
- Invalidated if: SPY closes below $761 or above $772
- Managing it: Close at 50% of the credit. If either short strike is tested with more than a couple of hours left, close that side rather than hold the gamma risk into the close.
- Liquidity note: The $761 puts ($0.55/$0.56) and $772 calls ($0.36/$0.37) are a penny wide. The far wings, the $756 puts ($0.18/$0.19) and $777 calls ($0.03/$0.04), are a penny wide in dollars but wide as a percentage. Use limit orders at the mid for the full package.
- Analyze this position →
If you lean bullish: bull put credit spread
- Trade: Sell the October 20 $765 put, buy the October 20 $760 put
- Credit: $0.93 ($1.365 − $0.435) · Max profit: $93 · Max loss: $407 · Break-even: $764.07
- Why it fits: Max pain at $770 sits above spot, so a pin drift would help. The long leg sits at the whole-chain put wall ($760), where the biggest protection cluster lives. Rich put premium (skew is stretched) means you're paid well for the downside you're selling.
- Makes sense only if: You read today's call-side open-interest build and the positive money-flow readings as the start of a bounce. That runs against our bearish tilt, so size small.
- Invalidated if: SPY closes below $765
- Managing it: Close at 50% of the credit. Exit if SPY loses $765 on volume, since the short strike sits only $1.48 below spot.
- Liquidity note: The $765 puts ($1.36/$1.37, 56,474 traded) and $760 puts ($0.43/$0.44) are both a penny wide, so fills are easy.
- Analyze this position →
If none of these: no trade
Premium is rich versus delivered movement, and there's no earnings-style distortion in an index ETF, so the case for selling is real. Standing aside still has merit, for three reasons.
- The asymmetry is harsh. Every credit structure here risks $4–$6 to make about $1, at one day to expiration. A single outsized move wipes out several winning sessions.
- The calm is fading. Realized movement over the past five sessions is running about a third faster than its monthly pace, and the premium has widened partly because the market is starting to catch up to it.
- The "rich" label rests on a quiet month. IV rank is only 21, so premium is rich versus a very calm stretch, not versus the past year.
If you'd rather sell premium with more time for theta to work and less gamma whiplash, waiting for a later expiration beats forcing a one-day trade.
6 · Quick FAQ
What is SPY's expected move for October 20? About ±$5.44 (±0.71%), giving a $761.04–$771.92 range, per the options market's straddle pricing as of the October 19, 2026 close.
Is SPY expected to go up or down tomorrow? Options positioning as of October 19 leans neutral with a bearish tilt, driven by fast put building and steeper-than-usual skew. That's a read of what traders have done, not a forecast. The actionable map is the $761.04–$771.92 range and the $754/$775 walls.
Are SPY options expensive right now? IV rank of 21/100 says option prices are lower than 79% of the past year's readings. On top of that, they're running about 5.4 vol points above the movement SPY has actually delivered, richer than 94% of this ETF's own recent readings. They're cheap versus the year but expensive versus the recent tape.
Where is SPY's biggest options support and resistance? For the October 20 expiration, the put wall is $754 and the call wall is $775. Across all expirations, the heaviest put strike is $760 and the heaviest call strike is $770.
What invalidates this read? A close above $770.
Methodology & disclosures. Data: end-of-day options-chain snapshot for SPY, 2026-10-19, generated 2026-10-19T21:05:17.849Z. Prices shown are midpoints and will differ from live markets. Momentum/positioning scores and volatility-premium comparisons are descriptive measurements of past option flow and past price movement — not investment advice, signals, forecasts, or guarantees. All trade structures are hypothetical. Every structure shown has a defined maximum loss; you can lose the entire max-loss amount. Options involve substantial risk and are not suitable for all investors.