SPY Options Outlook: Will the $772 Put Wall Hold Into the October 22 Expiration?
SPY options price a ±$5.26 move into the October 22 expiration, a $767.83–$778.35 range, with spot sitting just above the next-session put wall at $772. Positioning leans slightly bullish, premium is rich relative to realized movement, and the article lays out three defined-risk ways to trade it.
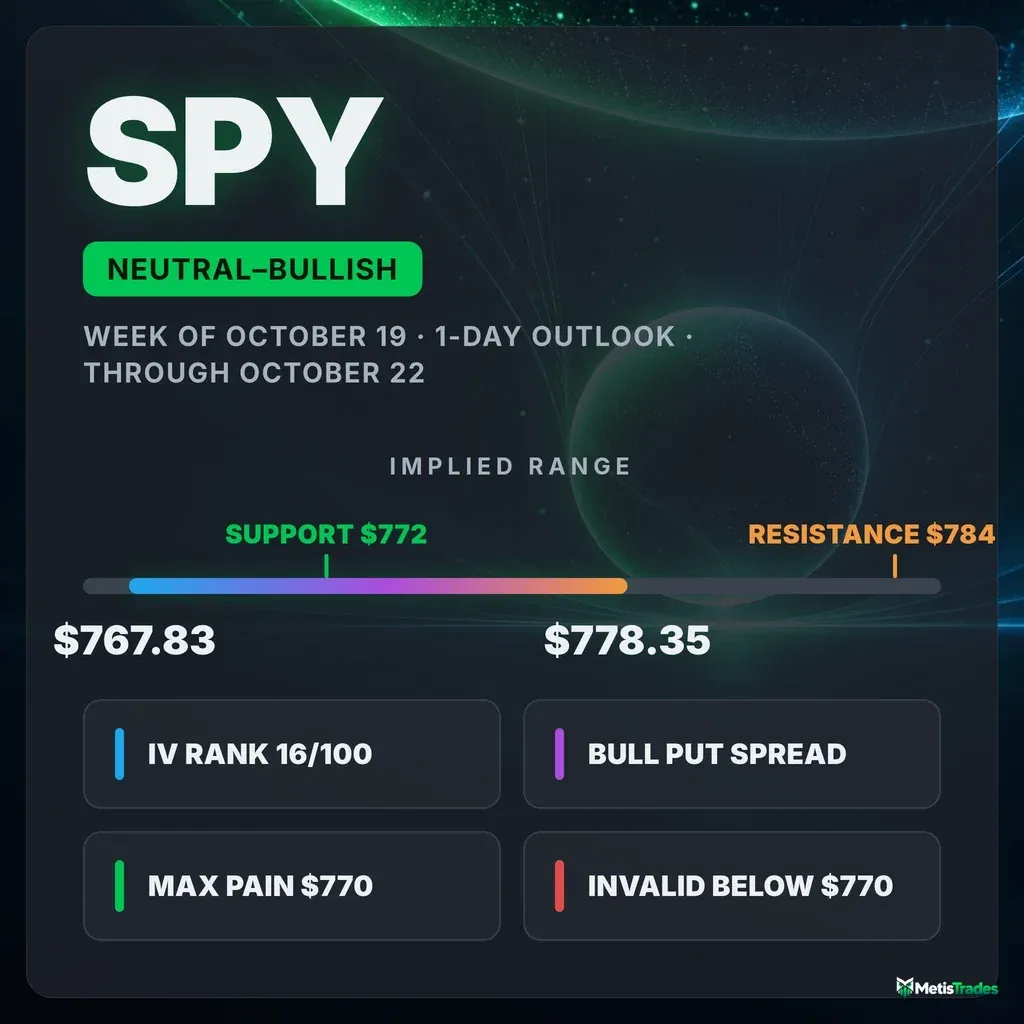
The options market implies a $767.83–$778.35 range into the October 22 expiration. Here is what's driving that range and three defined-risk ways to trade it.
Published Wednesday, October 21, 2026 · Data as of the Wednesday, October 21, 2026 close
Explore the live SPY options data in the Detailed Options Analyzer →
Quick answer
| Item | Answer |
|---|---|
| Market bias | Slightly bullish |
| Options-implied range (into October 22) | $767.83 – $778.35 (±0.68%, ±$5.26) |
| Major support | $772 (put wall, October 22 expiration) |
| Major resistance | $784 (call wall, October 22 expiration) |
| Max pain (October 22) | $770 |
| Dealer gamma regime (estimate) | Positive: hedging tends to dampen moves. Flip level ≈ $783 |
| Volatility condition | Neutral. IV rank 16.29/100, ATM IV 13.56%. Premium is rich: options are priced about 4.7 vol pts above delivered movement |
| Technical check | Confirms (bullish, 2-day chart model targeting $775.50; model range $765.50–$781.50) |
| Best-fitting strategy | Bull put credit spread (only if $770 holds) |
| Analysis invalidated if | SPY closes below $770 |
1 · What matters today
SPY's options positioning leans slightly bullish heading into tomorrow's session (2026-10-22). The main reason is location. SPY closed at $773.09, just above the next-session expiration's biggest pile of put contracts at $772 and well below its biggest call pile at $784. Short-dated option flow has also turned call-heavy after last week's dip.
Options are pricing an expected move of about $5.26 either way. That is the move the options market is pricing in, derived from what straddles cost, and it gives a $767.83–$778.35 range. That premium is unusually rich compared with how little SPY has actually been moving.
The one level that changes the picture is $770. It is the max-pain strike and the heaviest gamma strike in the chain, and a close below it would undercut the bullish lean. The chart model also leans bullish, with a $775.50 target that sits inside the options range.
2 · What the options market is pricing
What changed this week
Last week's wobble has mostly been repaired.
- Price: SPY is up 0.45% over five sessions after sliding to $763.25 on October 16.
- Put open interest: The put/call open-interest ratio (how many put contracts are held open for every call) fell from 1.29 to 0.96 over five days. Its 7-day average is 1.23, so traders have been closing out downside protection quickly.
- Today's flow: Put volume ran at just 0.89 puts per call, against a 7-day average of 1.03.
- Single-day position change: Call open interest grew by about 99,000 contracts while put open interest shrank by about 270,000. That shift was unusually large for SPY compared with its own recent history.
- Implied volatility: ATM IV is essentially flat over five days (−0.2%) and eased 1.7% today.
Our read of option flow swung from a 7-day average of −15 to +19 today. That is a sharp turn from defensive to mildly constructive, though it comes on the heels of a bearish momentum crossover on October 13 that the flow has only now moved past.
The bigger trend readings are flat across the past week, the past month, and the past two months. Nothing longer-term is pushing either way, which makes the near-term positioning the main story.
Into Wednesday's expiration, the now-settled October 21 $773 and $775 calls traded more than 600,000 contracts each. That is history, not a live level.
Expected move
For the October 22 expiration, at-the-money options imply a one-day move of ±0.68%, or about ±$5.26 around the $773.09 snapshot price. That is roughly a 1-in-3 chance of SPY finishing outside $767.83–$778.35. Here's how the move scales further out:
| Expiration | Implied move | Range around $773.09 |
|---|---|---|
| October 22 (1 day) | ±0.68% | $767.83 – $778.35 |
| October 23 (2 days) | ±0.98% | $765.51 – $780.67 |
| October 30 (9 days) | ±2.15% | $756.47 – $789.71 |
| November 20 (30 days) | ±3.89% | $743.02 – $803.16 |
The ladder has one quirk. IV on the October 22 and 23 expirations (about 13%) is higher than on the October 26 and 27 expirations (about 10.6–11.1%). In other words, the chain is pricing slightly more per-day movement into the next two sessions than into early next week.
Volatility
Implied volatility is the market's estimate of how much SPY will move, baked into option prices. ATM IV sits at 13.56%.
IV rank is 16/100. That measures where today's IV sits versus the past year, and 16 means it is cheaper than 84% of the past year's range. The IV percentile of about 35 says roughly a third of the past year's days printed lower IV than today.
IV is essentially at its 90-day average (13.57%) and a touch above its 30-day average (13.19%). It is down 1.7% on the day and up about 1% over 30 sessions, so the direction is neutral. The roughly 60-day tenor prices 14.16%, a little above the front. The front-month term-structure read is unavailable today.
Realized volatility tells a quieter story. SPY's 20-day realized vol of 8.85% is running well below this stock's own recent norm. That comparison is against SPY's own recent history: "unusually low" here means unusual for SPY, not versus the broader market. Over the past five days, though, movement has picked up relative to the month, so the calm has started to fray at the edges.
VIX closed at 16.68, near the low end of its 52-week range. Its 60-day correlation with SPY's IV is a tight 0.92, so the two are telling the same story.
Premium rich or cheap. The volatility risk premium is the gap between how much movement options are priced for and how much SPY has actually delivered. When it's positive, option sellers have been collecting more than realized movement cost them.
- Right now options are priced about 4.7 vol points above what SPY has actually delivered.
- That gap sits in the 88th percentile of its own readings, meaning it is richer than about 88% of this stock's recent readings. It was intense even by SPY's standards.
- The gap has roughly doubled since early October, from about 2.6 points to a peak near 5.4 on October 19. It has eased only slightly since, and ETFs carry no earnings distortion.
So what? IV rank is low, which normally argues against selling premium. But an 88th-percentile premium over delivered movement favors collecting premium this session, provided the structure is defined-risk.
Skew and sentiment
Skew means puts and calls the same distance from the stock price don't cost the same. When puts are pricier, traders are paying up for crash protection.
- Skew level: SPY's 25-delta puts trade at 15.9% IV versus 12.4% for comparable calls. That is a gap of about 3.5 vol points, essentially at its 60-day median of about 3.5.
- Recent path: Skew spiked to 6.1 points on October 16 and has since bled back below its 7-day average of about 4.2. The panic premium on downside protection has drained out.
- Put/call ratios: The put/call ratio measures put activity relative to calls, and above 1 means puts dominate. Volume printed 0.89 and open interest 0.96, both under their 7-day averages of 1.03 and 1.23.
- Short-dated sentiment: Sentiment in options expiring within a week reads mildly positive (+11). The 8–30-day window is close to flat (+4). Both improved from 7-day averages of +1 and −14.
The overall regime reads "Calm," meaning no part of the expiration curve is leaning hard either way. In plain terms, nobody is scrambling for protection, and the tilt is modestly toward calls.
The key levels map
| Level | Price | Why it matters |
|---|---|---|
| Call wall (October 22) | $784 | Largest next-session call open interest (7,786 contracts, nearly all opened in one session). It is the upper barrier for tomorrow. |
| Gamma flip (estimate, whole chain) | $783 | A rough estimate of where market-maker hedging changes character. Treat it as low-confidence. |
| 52-week high | $781.62 | The year's high-water mark, just 1.1% above the close. |
| Whole-chain call wall / #2 gamma strike | $780 | The heaviest call strike across all expirations (128,595 contracts). |
| Implied range top | $778.35 | Upper edge of the one-day expected move. |
| Swing resistance | $777.05 | Recent pivot cluster on the daily chart. |
| Large gamma strike | $775 | The third-largest gamma concentration. It can act as a near-term magnet. |
| Spot | $773.09 | Wednesday's close. |
| Put wall (October 22) | $772 | Largest next-session put open interest (2,500 contracts). It is the first support. |
| 20-day moving average | $770.88 | Price sits 0.29% above it. |
| Max pain (October 22) / largest gamma strike | $770 | The pin candidate, and the thesis kill switch on a close below. |
| 50-day moving average | $768.34 | Intermediate trend support. |
| Implied range bottom | $767.83 | Lower edge of the one-day expected move. |
| Put wall (October 26) | $766 | Gained about 19,500 contracts of open interest in one day. |
| Whole-chain put wall | $765 | The heaviest put strike across all expirations (116,820 contracts). |
| Swing support / 100-day MA | $758.16 / $758.09 | A deeper structural floor. |
| 200-day moving average | $726.29 | Long-term trend line, 6.4% below. |
Note that the next-session walls ($772 / $784) differ from the whole chain's heaviest strikes ($765 / $780). For tomorrow's expiration, the $772/$784 pair applies.
Positioning and unusual flow
Dealer gamma. Market makers hedge the options they've sold. In a positive-gamma regime, their hedging tends to dampen moves. Under the usual sign assumption, one rough estimate reads net dealer gamma as positive both for the whole chain and for the October 22 expiration, which argues for contained, pin-friendly trading.
The same estimate places the gamma flip at $783, above spot. By that measure, spot sits on the side where hedging can amplify moves, and somewhat further from the flip than is typical for SPY. The two readings disagree, so treat the "dampening" case as a tendency, not a guarantee.
Notable flow:
- October 26 $766 puts: Open interest jumped by 19,508 contracts, from 609 to 20,117. Someone built a sizable hedge just below the expected-move floor for early next week, which reads as protection rather than a bearish bet.
- October 27 $767 puts: 40,138 contracts traded against just 525 held open, a turnover of about 76 times. That is roughly $8.5 million in premium changing hands.
- October 22 $773 puts: 49,910 contracts traded against 517 open, about $9.9 million in premium. Much of that is likely same-session hedging and day-trading around the money rather than conviction.
Together, these suggest traders are hedging into strength, not chasing downside.
3 · Technical check
The 2-day chart model is bullish, with a $775.50 target and a projected range of $765.50–$781.50.
Against the options-implied $767.83–$778.35 range for the October 22 expiration, this Confirms the options read. Both lean the same way, and the target sits inside the range. The model's own range is wider on both ends than what options price.
Two readings matter most:
- Money flow: The money-flow gauge (CMF) is near its strongest level of the chart window, a sign buyers have been absorbing supply since October 16.
- Momentum: A bearish MACD crossover late in Wednesday's session keeps conviction modest.
The model's dominant breakout scenario is invalidated on a close below $771.30, close to the $772 put wall. The model flags support at $771.34 and resistance at $774.78.
That confirmation kept the bullish structure's short strike at $770 rather than pushing it closer to spot. It also kept the condor's call side above the model's $775.50 target.
Model vs. Market: The options market implies $767.83–$778.35; the 2-day technical model targets $775.50. The model's target sits comfortably inside what options price, so the two agree on direction and on modest magnitude.
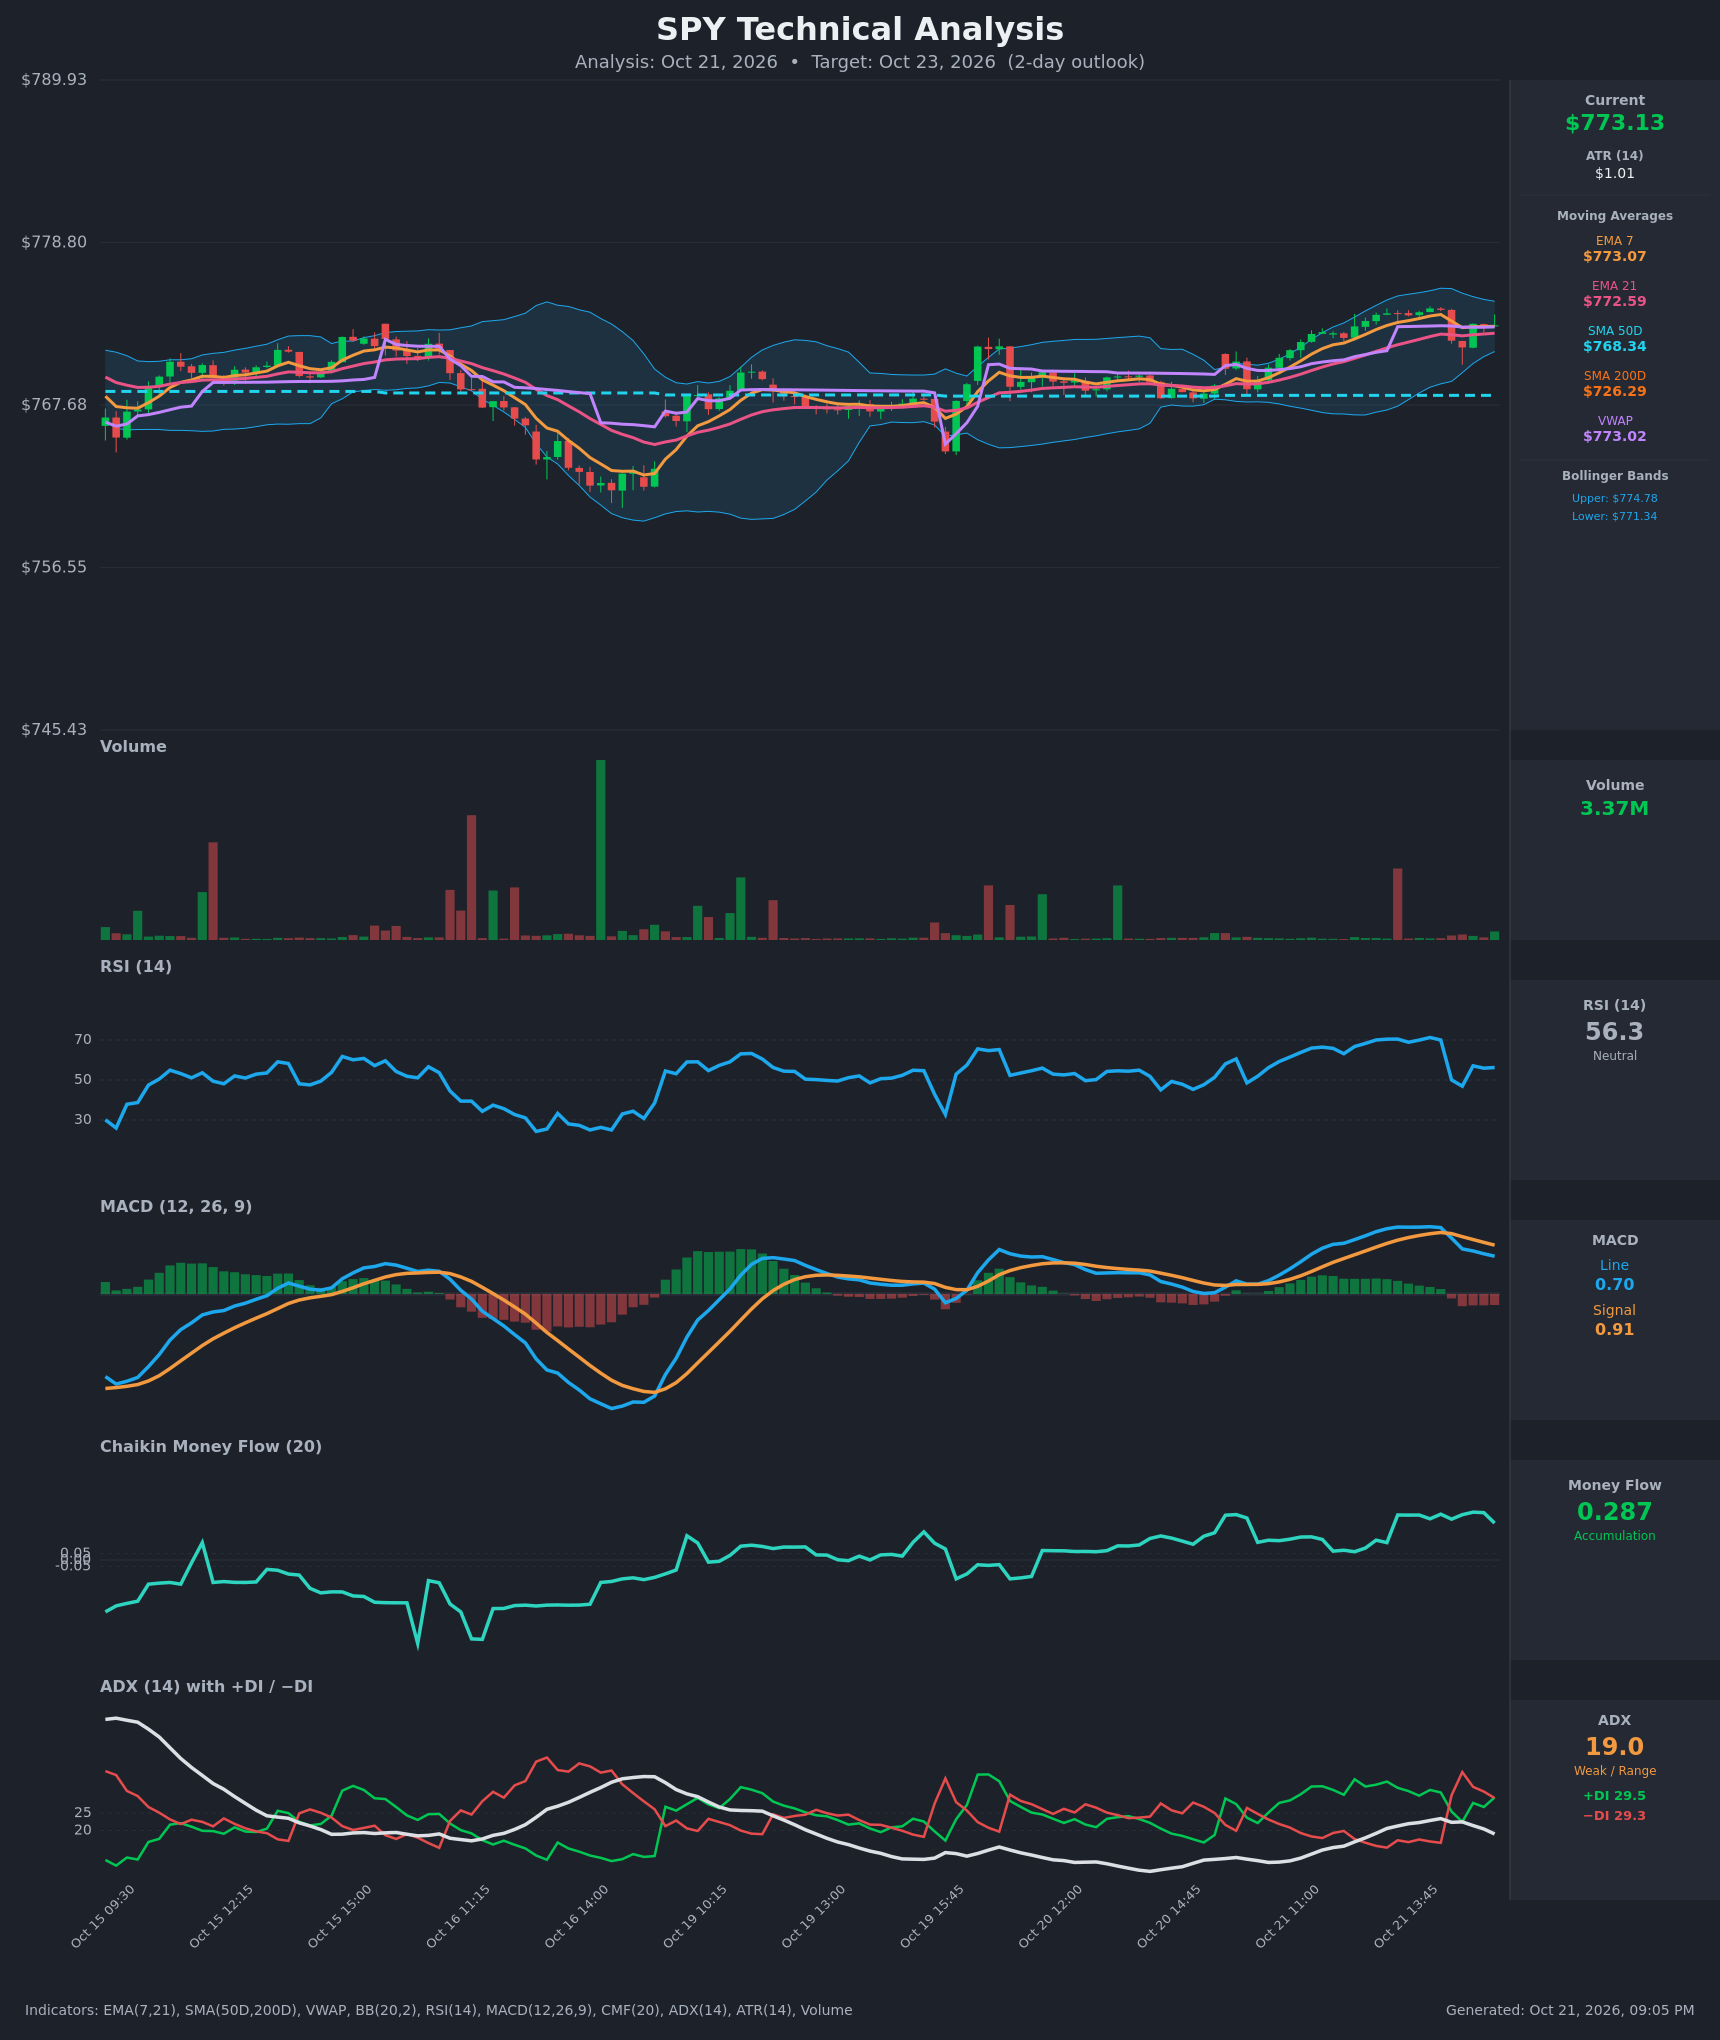
Full technical write-up: Next-session report →
4 · Three ways the session can go
If SPY pushes above the call wall ($784): That would require a move well beyond the $778.35 top of the implied range. On the way, it would cross the whole-chain call wall at $780, the $781.62 52-week high, and the $783 flip estimate. Heavy call open interest overhead tends to slow rallies, so a run that far in one session would be a genuine surprise relative to pricing.
If SPY drifts between the walls: This is the base case for a positive-gamma estimate. Expiring open interest and hedging flows tend to pull price toward the $770–$775 cluster of big gamma strikes into the October 22 settlement. Max pain at $770 sits just below the $772 put wall, so a mild drift lower toward $770–$772 is consistent with pinning, not with a breakdown.
If SPY breaks below the put wall ($772): The next tests are $770 (max pain, the largest gamma strike, and this article's kill switch), then the $767.83 floor of the implied range. Below that comes the $766/$765 put cluster. Because the flip estimate sits above spot, one rough estimate suggests market-maker hedging could amplify rather than cushion a slide once support gives way.
5 · Three defined-risk structures
Prices are end-of-day midpoints as of October 21, 2026. All structures are hypothetical. Verify live prices before trading, because these will be stale by the open. All three use the one-day October 22 expiration, so time decay and pin risk are extreme. Size accordingly.
If you lean bullish: Bull put credit spread
Mechanics reminder: you collect a credit up front and keep it if SPY stays above the short strike at expiration.
- Trade: Sell the October 22 $770 put, buy the October 22 $767 put.
- Credit: $0.53 ($53 per spread) · Max profit: $53 · Max loss: $247 · Break-even: $769.47
- Why it fits: The short strike sits at max pain and below the $772 put wall. Premium is in the 88th percentile versus delivered movement, so you're selling something the market is overpaying for.
- Makes sense only if: SPY opens and holds above $772.
- Invalidated if: SPY closes below $770.
- Managing it: Close at about 50% of the credit if it comes early. If SPY trades through $770 intraday, close rather than hope. Don't carry the position into the final minutes of settlement.
- Liquidity note: The $770 puts traded 2¢ wide ($0.98/$1.00) and the $767 puts 2¢ wide ($0.45/$0.47), so fills are easy.
- Analyze this position →
If you expect the range to hold: Iron condor
Mechanics reminder: you collect a credit by selling both a put spread and a call spread, and keep it if SPY stays between the short strikes.
- Trade: Sell the October 22 $767/$764 put spread and the October 22 $779/$782 call spread.
- Credit: about $0.445 ($44.50 per condor) · Max profit: $44.50 · Max loss: $255.50 · Break-evens: $766.56 and $779.45
- Why it fits: Both short strikes sit just outside the $767.83–$778.35 implied range. Positive gamma (estimated) favors pinning, and the call side clears both the $777.05 swing resistance and the chart model's $775.50 target.
- Makes sense only if: SPY stays inside the walls and the call-heavy flow doesn't turn into a breakout.
- Invalidated if: SPY closes below $767 or above $779.
- Managing it: Take 50% of the credit if offered. Close the threatened side if price touches either short strike.
- Liquidity note: The $767 puts traded 2¢ wide, and the $764 puts and $779 calls 1¢ wide. The $782 call wing ($0.06/$0.07) is only a penny wide, but that is about 15% of its tiny price, so expect a cent or two of slippage on entry.
- Analyze this position →
If you lean bearish: Bear put debit spread
Mechanics reminder: you pay a debit and profit if SPY falls toward the lower strike by expiration.
- Trade: Buy the October 22 $772 put, sell the October 22 $768 put.
- Debit: about $0.99 ($98.50 per spread) · Max profit: $301.50 · Max loss: $98.50 · Break-even: $771.02
- Why it fits: It is a defined-risk bet that the thin $772 put wall fails and price falls through max pain at $770 toward the implied-range floor. It targets the MACD momentum fade the chart model flags.
- Makes sense only if: SPY loses $772 early in the session.
- Invalidated if: SPY closes above $774.78.
- Managing it: Take profits near $768–$769, and cut the trade if SPY reclaims $774.
- Liquidity note: The $772 puts traded 1¢ wide ($1.58/$1.59) and the $768 puts 2¢ wide.
- Analyze this position →
If none of these: no trade
Rich premium is the best argument for selling, but there are real reasons to stand aside:
- Skewed payoff: One-day credit spreads collect cents to risk dollars. A single 0.7% move can wipe out several sessions of collected premium.
- Low absolute IV: IV rank is just 16, so the edge comes from realized movement being unusually quiet. Realized movement has already started to accelerate over the past five days.
- Mixed gamma read: The gamma estimates disagree, so the "pin" is not assured.
If you can't watch the position through tomorrow's session, standing aside beats selling premium you can't manage.
6 · Quick FAQ
What is SPY's expected move for October 22? About ±$5.26 (±0.68%) into the October 22 expiration, a $767.83–$778.35 range, per straddle pricing as of the October 21, 2026 close.
Is SPY expected to go up or down tomorrow? Options positioning as of October 21 leans slightly bullish. Spot sits just above the next-session put wall, and short-dated flow turned call-heavy. That is a read of what traders have done, not a forecast. The actionable map is the $767.83–$778.35 range and the $772/$784 walls.
Are SPY options expensive right now? IV rank of 16/100 says option prices are lower than 84% of the past year's range. But they're running about 4.7 vol points above the movement SPY has actually delivered, which is richer than 88% of SPY's own recent readings. Relative to realized movement, premium is rich.
Where is SPY's biggest options support and resistance? For the October 22 expiration, the put wall is at $772 and the call wall at $784. Across all expirations, the heaviest strikes are $765 (puts) and $780 (calls).
What invalidates this read? A close below $770.
Methodology & disclosures. Data: end-of-day options-chain snapshot for SPY, 2026-10-21, generated 2026-10-21T21:05:23.981Z. Prices shown are midpoints and will differ from live markets. Momentum/positioning scores and volatility-premium comparisons are descriptive measurements of past option flow and past price movement — not investment advice, signals, forecasts, or guarantees. All trade structures are hypothetical. Every structure shown has a defined maximum loss; you can lose the entire max-loss amount. Options involve substantial risk and are not suitable for all investors.