AAL Options Are Pricing an $0.85 Move Into September 18 — and Charging a Fat Premium to Do It
The options market implies a $12.19–$13.89 range for American Airlines into the September 18 expiration, with premium sitting about 16 vol points above what the stock has actually delivered. Here's the level map and three defined-risk ways to trade it.

The options market implies a $12.19–$13.89 range into the September 18 expiration; here's what's driving it, where the walls sit, and three defined-risk ways to trade the next four days.
Published Sunday, September 13, 2026 · Data as of Friday, September 11 close
Explore the live AAL options data in the Detailed Options Analyzer →
Quick answer
| Item | Answer |
|---|---|
| Market bias | Neutral with a bearish tilt |
| Options-implied range (into Sept 18) | $12.19 – $13.89 (±6.51%, about ±$0.85) |
| Major support | $12.00 — the Sept 18 put wall |
| Major resistance | $17.00 — the Sept 18 call wall |
| Max pain (Sept 18) | $14.00 |
| Dealer gamma regime (estimate) | Negative — hedging tends to amplify moves; the rough flip estimate sits far below spot at about $3 |
| Volatility condition | Falling — IV rank 16/100 · premium rich: options priced about 16 vol points above delivered movement |
| Technical check | Confirms (bearish, 2-day and 4-day chart models) |
| Best-fitting strategy | Sept 18 $13.50/$14.00 call credit spread (conditional — see below) |
| Analysis invalidated if | AAL closes above $13.36 |
1 · What matters today
American Airlines closed Friday, September 11 at $13.01, and the options market is pricing a move of about $0.85 in either direction into the September 18 expiration — that's the move implied by what straddles cost, or a $12.19–$13.89 band. Our read of the options flow lands at neutral with a bearish tilt: the leading positioning read has turned negative and traders have been paying up for downside protection relative to this name's own habit, while the wall structure still leaves plenty of room overhead. The single most important number is $12.00, where 71,317 put contracts are held open for that expiration — the biggest pile on the board. Both chart models we checked also lean bearish over this window. A close above $13.36 kills the bearish shading.
2 · What the options market is pricing
What changed this week
Price barely moved and positioning did all the talking. AAL is up 0.46% over the past five sessions but down 13.4% over the past twenty, and total option volume on Friday ran 2.4× its 20-day average — heavy participation into an expiration day. Put open interest is now 1.47 puts for every call held open, versus a 14-day average of 1.46, so the ratio itself is unremarkable; the movement underneath it is not. The single biggest open-interest build in the chain was the September 18 $12.50 put, which added 5,452 contracts to 11,559, and the October 16 $11 put added 5,143 on 6,217 contracts of volume. That is money going toward downside insurance, not upside chase.
Implied volatility fell 8.8% on the day to 42.50%, is up 4.5% over five sessions and down 12.5% over thirty, sitting below both its 30-day average (45.2%) and its 90-day average (50.6%). Put/call volume came in at 1.03 against a three-day average of 1.65 — Wednesday's put-heavy panic has already faded. The trend reads agree with each other rather than fighting: the short-term read is flat, while the twenty-day and fifty-day reads are both bearish (price −13.4% and −28.1% over those windows). Nothing in the past week's action has challenged that bigger picture.
Expected move
Into September 18, the options market is pricing ±6.51%, or about ±$0.85 around the $13.04 spot recorded with the chain snapshot — a $12.19 to $13.89 band.
| Expiration | Implied move | Range around $13.04 |
|---|---|---|
| Sept 18 | ±6.51% | $12.19 – $13.89 |
| Sept 25 | ±8.73% | $11.90 – $14.18 |
| Oct 2 | ±10.42% | $11.68 – $14.40 |
| Oct 9 | ±11.39% | $11.56 – $14.53 |
The rungs step up smoothly with time rather than jumping at any one date, which is what a calendar with no scheduled event inside it looks like. Note that the near rung's own at-the-money implied volatility (47.0%) prices richer than the one-month rung (41.1%) — the front of the curve is the expensive part right now.
Volatility
At-the-money implied volatility is 42.50%, with an IV rank of 16/100 — meaning today's IV is cheaper than roughly 84% of the past year's readings, and the percentile read is lower still. Direction is down: −8.8% on the day, −12.5% over thirty sessions, and below both the 30-day and 90-day averages. The front-month read is unavailable today because Friday was an expiry day and front-month IV can't be interpolated from a same-day-expiring contract; it returns next session.
Underneath that, the stock has gone quiet in a way that is unusual for it: 20-day realized volatility is 26.5%, well below this name's own recent norm, and the five-day-versus-twenty-day movement ratio says the past week has been calmer still.
Premium rich or cheap. The gap between how much movement options are priced for and how much AAL has actually delivered — the volatility risk premium — is about 16 vol points, and that sits richer than roughly 98% of this stock's own recent readings. When that gap is positive and wide, option sellers have been collecting far more than realized movement cost them. The path got there fast: the gap was running around 3 vol points in late August and has roughly quintupled over the past two weeks, driven mostly by realized volatility collapsing rather than by implied volatility spiking. That combination — an IV rank of just 16 but a 98th-percentile premium over delivered movement — argues for collecting premium rather than owning it, while acknowledging the obvious catch: options are cheap in absolute terms, so the dollars collected on a four-day structure are small.
Skew and sentiment
Puts and calls the same distance from the stock price don't cost the same, and the direction of that difference matters. Today, 25-delta calls carry about 1.5 vol points more implied volatility than 25-delta puts — but this name normally runs with calls about 7.2 points richer than puts (its 60-day median). Relative to its own habit, put demand has firmed up sharply, and the leading positioning read flags that the skew steepened at an unusual pace over the past five sessions. That is the clearest bearish fingerprint in the file.
Put/call volume finished at 1.03 against a 60-day median near 1.07 — mildly call-tilted on the day, and the pace of unusual call-side sweeps registered well above this stock's own norm (two call contracts cleared the peer-relative unusual bar versus zero puts). Pull further out and sentiment across expiration dates is genuinely mixed: the 0–7 day bucket reads bullish, the 7–30 day bucket mildly bearish, and the 30–120 day buckets lean bullish. No single regime dominates — which is exactly why the headline bias lands near neutral rather than committing.
The key levels map
| Level | Price | Why it matters |
|---|---|---|
| Call wall (Sept 18) | $17.00 | Heaviest call open interest for the target expiration (33,102 contracts) — and the whole chain's heaviest call strike too (59,198); far overhead, so it caps nothing this week |
| Swing resistance | $15.40 | Heuristic swing-pivot cluster from recent price structure |
| Swing resistance | $14.16 | Next structural shelf above the implied range |
| Max pain (Sept 18) | $14.00 | The price where the most option value expires worthless; also the third-largest gamma strike in the chain. It sits above the implied range high — the magnet is out of reach on a one-sigma move |
| 200-day moving average | $13.94 | Price is 6.7% below it; overhead trend resistance |
| Implied range high | $13.89 | Upper rail of the options-implied move into Sept 18 |
| 20-day moving average | $13.53 | Price is 3.8% below it — the first real overhead check |
| Swing resistance | $13.36 | Nearest pivot cluster; a close above it invalidates this article's tilt |
| Spot / recent close | $13.04 / $13.01 | Chain-snapshot price and official close |
| Largest gamma strike (#2) | $13.00 | Heavy open interest on both sides — 22,724 calls and 44,543 puts across the chain |
| Implied range low | $12.19 | Lower rail of the implied move into Sept 18 |
| Put wall (Sept 18) | $12.00 | 71,317 puts held open at the target expiration and the chain's largest gamma strike — the strike with the biggest pile of open put contracts often acts like a floor or a magnet |
| Swing support | $11.97 | The only support level the price-structure read flags below spot — it sits right on the put wall |
| 52-week low | $10.09 | Price sits 33.6% up its 52-week range |
| Gamma flip estimate | ≈ $3.00 | One rough estimate of where market-maker hedging would flip from dampening to amplifying — nowhere near spot, so it isn't a live trigger this week |
Positioning and unusual flow
The dealer-gamma read for the September 18 expiration is an estimate, built on an assumed convention rather than observed dealer inventory, and it comes out negative — in that regime, market-maker hedging tends to amplify moves rather than cushion them. The whole-chain estimate agrees. Treat it as texture, not a trigger: the estimated flip level it implies sits far below any plausible price this week.
Three flow items stood out on Friday, none of them from expired contracts. The October 16 $14 calls traded 20,590 contracts against 8,461 held open — the largest dollar premium in the chain at roughly $824,000, and a clean bet on a recovery back above the 200-day average over the next five weeks. The September 25 $12.50 puts traded 24,406 against 2,417 open, more than ten times turnover and about $574,000 of premium, which is the mirror image: short-dated downside protection at a strike just under the put wall. And the biggest open-interest build of all landed on the September 18 $12.50 put, up 5,452 contracts. For the record, into Friday's expiration the $13 calls traded 4,970 contracts and added 1,160 of open interest before settling — that's history now, not a live level.
3 · Technical check
Both chart models lean the same way as the options read, which is the simplest version of a confirmation. The 2-day model is bearish, targeting $12.82 with a projected range of $12.65 to $13.05 from a $13.00 reference, citing a fresh short-EMA bearish crossover, a MACD crossover down, and ADX at 28.7 with the negative directional line on top. Its dominant scenario invalidates on a reclaim and close back above $13.12.
The 4-day model, which lands on our target date, is also bearish: a $12.80 target with a $12.55 to $13.05 projected range, support flagged at $12.65 and resistance at $13.25, and an explicit note that price remains below both the 50-day ($14.85) and 200-day ($13.94) averages. Its dominant bearish scenario invalidates on a sustained close above $13.20. Both models note mild accumulation in the money-flow reading as the one signal pointing the other way.
Model vs. Market: The options market implies $12.19–$13.89 into September 18; the 4-day technical model targets $12.80 inside a much tighter $12.55–$13.05 projection. The chart model is not disputing direction — it's saying the options market is paying for a lot more range than the chart expects to be used, which is the same conclusion the volatility-premium read reached from the other side.
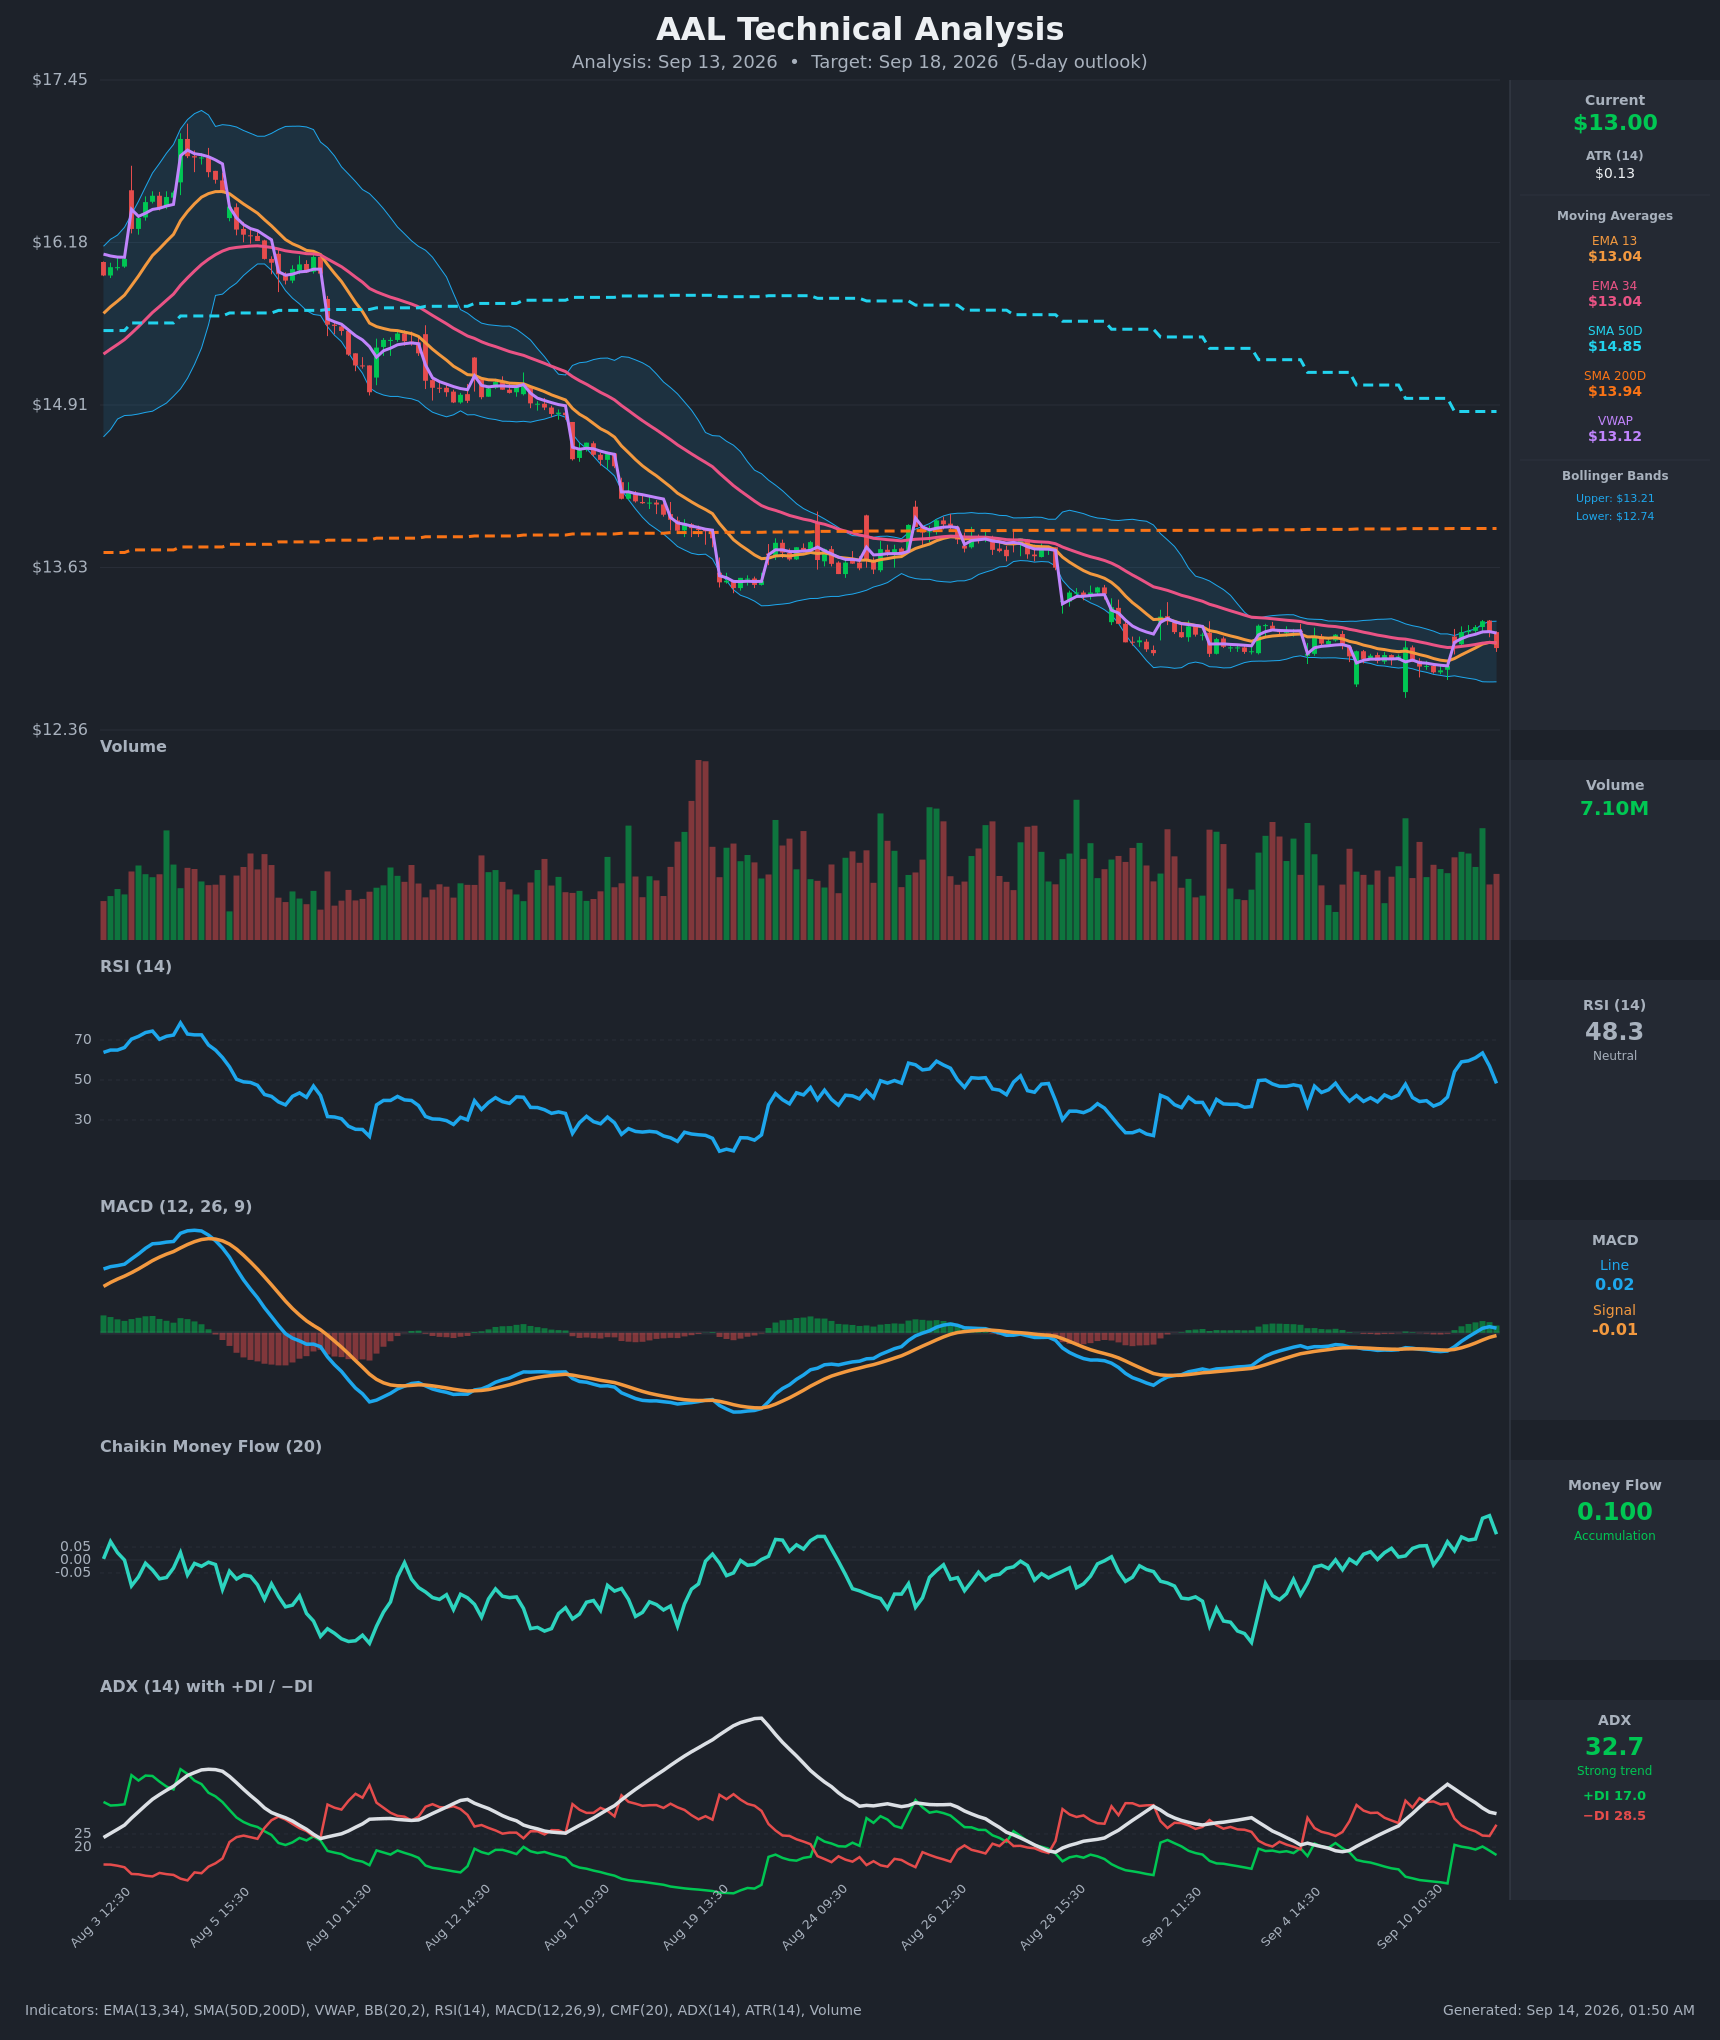
The practical effect on strike selection below: the short call strike is shaded toward $13.50, just above both models' resistance zone, rather than pushed out to the implied-range rail.
Full technical write-ups: 2-day report → · 4-day report →
4 · Three ways the next four days can go
If AAL pushes above $13.36: the nearest swing resistance gives way and the 20-day average at $13.53 and the 200-day at $13.94 come into play, with max pain at $14.00 sitting above them as a pull. Open interest between here and $14 is thin compared with what's stacked at $12 and $13, so positioning offers little resistance until the $14 strike itself, where 14,746 calls are held open for the target expiration. That is the branch that invalidates this article.
If AAL drifts between $12.50 and $13.36: this is the base case the positioning supports. Most of the open interest at the target expiration is clustered at $12, $13 and $14, and with implied volatility already priced well above delivered movement, a grinding week lets time decay do the work for anyone short premium. Max pain at $14.00 is real but out of reach on a one-sigma move — don't expect a magnet you can't get to.
If AAL breaks below $12.19: the implied-range rail gives way and the $12.00 put wall becomes the whole story — 71,317 puts open there, and the swing-support read lands at $11.97, essentially the same level. The dealer-gamma estimate for this expiration is negative, so on that estimate hedging flows would tend to add to a move rather than cushion it. Below $12.00 there's very little positioning structure until much lower strikes.
5 · Three defined-risk structures
Prices are end-of-day midpoints as of September 11, 2026. All structures are hypothetical. Verify live prices before trading — these will be stale by the open.
If you lean bearish: short $13.50/$14.00 call spread (Sept 18)
- Trade: Sell the Sept 18 $13.50 call, buy the Sept 18 $14.00 call. You collect a credit up front and keep it if AAL stays below $13.50.
- Credit: $0.105 ($10.50 per spread) · Max profit: $10.50 · Max loss: $39.50 · Break-even: $13.605
- Why it fits: The short strike sits just above both chart models' resistance zone and below the 20-day average at $13.53, and it's selling into a premium that runs about 16 vol points above delivered movement — the richest this stock has priced in months. The $13.50 call carries a delta of roughly 0.32, so roughly a one-in-three chance of finishing in the money is the honest framing.
- Makes sense only if: you believe the $13.36–$13.53 shelf holds for four sessions. Max pain at $14.00 is the argument against this trade; respect it.
- Invalidated if: AAL closes above $13.36.
- Managing it: with four days to expiration there's no room for patience — close at roughly 50% of the credit if it comes quickly, and close rather than hope if AAL closes through $13.50. The short-term trend read is flat while the twenty- and fifty-day reads are bearish, which argues for taking profits early rather than holding to the bell.
- Liquidity note: the $13.50 calls quoted a penny wide ($0.16/$0.17, about 6% of mark) — easy fills. The $14.00 calls quoted $0.05/$0.07; that's only two cents, but on a six-cent mark it's wide in percentage terms, so work the spread as a package and don't pay up for the long leg.
- Analyze this position →
If you expect the range to hold: Sept 18 iron condor, $11.50/$12.50 – $14.00/$15.00
- Trade: Sell the $12.50 put and buy the $11.50 put; sell the $14.00 call and buy the $15.00 call, all expiring Sept 18. Four legs, one net credit, and you keep it all if AAL finishes between $12.50 and $14.00.
- Credit: $0.16 ($16 per condor) · Max profit: $16 · Max loss: $84 · Break-evens: $12.34 and $14.16
- Why it fits: the short call sits exactly at max pain and the short put sits at the strike that just absorbed the chain's biggest open-interest build, with the $12.00 put wall one strike below it as a backstop. With premium at a 98th-percentile richness versus delivered movement and realized volatility unusually depressed for this name, this is the structure that gets paid for the stock doing nothing.
- Makes sense only if: you accept that the short put at $12.50 sits inside the options-implied downside rail of $12.19 — a one-sigma down move breaches it. This trade leans on the $12.00 wall, not on the expected move alone.
- Invalidated if: AAL closes below $12.19 or above $13.89 — either rail breached, the range thesis is done.
- Managing it: close the tested side rather than defending both; with four days left, exit any breached short strike at the close it breaches rather than rolling.
- Liquidity note: the $12.50 puts quoted $0.12/$0.15 and the $11.50 puts $0.01/$0.03; the call side quoted $0.05/$0.07 and $0.01/$0.02. In penny-wide contracts these percentages look ugly — enter as a four-leg package and expect to give up a cent or two of the credit.
- Analyze this position →
If you lean bullish: short $13.00/$12.00 put spread (Sept 18)
- Trade: Sell the Sept 18 $13.00 put, buy the Sept 18 $12.00 put. You collect a credit and keep it if AAL holds above $13.00.
- Credit: $0.27 ($27 per spread) · Max profit: $27 · Max loss: $73 · Break-even: $12.73
- Why it fits: the long leg sits precisely at the $12.00 put wall, so the structure's risk is capped at the level the market has already stacked with 71,317 contracts. Near-dated sentiment in the 0–7 day bucket is the one genuinely bullish reading in the file, and the wall corridor leaves far more room above spot than below it.
- Makes sense only if: you're fading the bearish chart reads and the steepening put skew, and you're comfortable with a short strike that is effectively at the money (delta about 0.46).
- Invalidated if: AAL closes below $12.73.
- Managing it: this is the highest-conviction-required trade of the three because it fights both chart models and the twenty- and fifty-day trend. Take 50% of the credit quickly if the bounce arrives; cut on a close below $12.73 rather than waiting for the wall to work.
- Liquidity note: the $13.00 puts quoted $0.31/$0.35 (about 12% of mark, four cents wide) and the $12.00 puts $0.05/$0.07 — acceptable but not free; both are among the most actively traded contracts at this expiration.
- Analyze this position →
If none of these: no trade
Here's the honest counter-argument to selling this rich premium: it's rich in relative terms only. IV rank is 16/100, so in absolute dollars these four-day contracts pay pennies — the bear call spread collects $10.50 against $39.50 of risk, and commissions plus a one-cent slip on each leg eat a meaningful slice of that. The volatility premium is wide because realized movement collapsed, not because implied volatility is high, and a stock that has fallen 28% over fifty sessions can restore realized volatility in a single session. If your account can't absorb the full max loss on a bad gap, or if a $10–$27 credit isn't worth four days of screen time, standing aside is the correct trade this week. The richer setups in this chain live further out on the curve, where the premium is measured in real dollars.
6 · Quick FAQ
What is AAL's expected move this week? About ±$0.85, or ±6.51%, into the September 18 expiration — a $12.19 to $13.89 range, per the options market's straddle pricing as of the September 11 close.
Is AAL expected to go up or down over the next four days? Options positioning as of September 11 leans neutral with a bearish tilt — put demand has firmed relative to this stock's own norm and the leading positioning read has turned negative, while the wall structure still leaves room overhead — but that's a read of what traders have done, not a forecast. The actionable map is the $12.19–$13.89 range and the $12.00 / $17.00 wall levels.
Are AAL options expensive right now? Two lenses, two answers. IV rank of 16/100 says option prices are lower than about 84% of the past year's readings; on top of that, they're running about 16 vol points above the movement AAL has actually delivered — richer than roughly 98% of this stock's own recent readings. Cheap in absolute terms, expensive versus reality, which favors collecting premium in small size rather than owning it.
Where is AAL's biggest options support and resistance? Put wall at $12.00 and call wall at $17.00 for the September 18 expiration — and the whole chain agrees on both strikes. The nearer structural levels that actually matter this week are $13.36 above and $12.19 below.
What invalidates this week's read? A close above $13.36.
Methodology & disclosures. Data: end-of-day options-chain snapshot for AAL, 2026-09-11, generated 2026-09-14T01:50:20.904Z. Prices shown are midpoints and will differ from live markets. Momentum/positioning scores and volatility-premium comparisons are descriptive measurements of past option flow and past price movement — not investment advice, signals, forecasts, or guarantees. All trade structures are hypothetical. Every structure shown has a defined maximum loss; you can lose the entire max-loss amount. Options involve substantial risk and are not suitable for all investors.