AAL Options Are Pricing a $0.70 Move Into September 25 — Positioning Leans Higher While the Chart Says Range
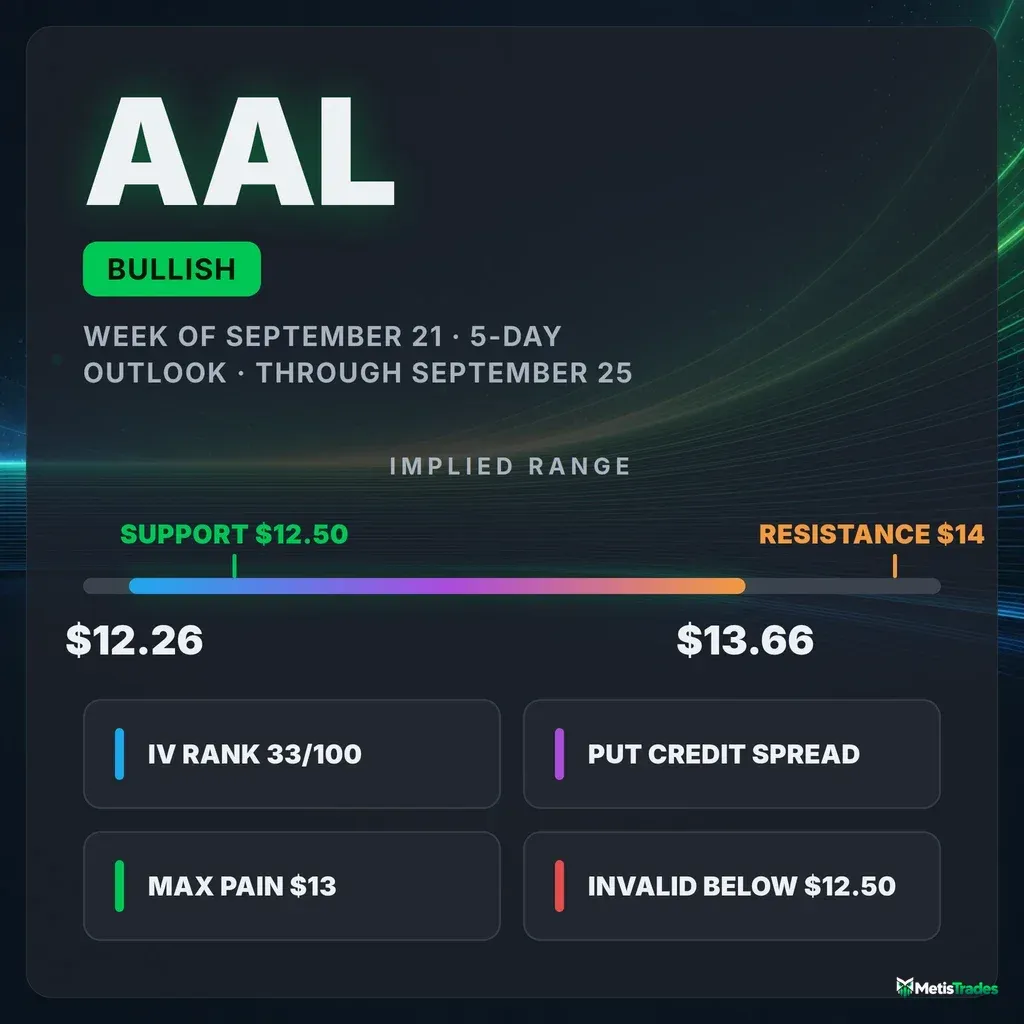
AAL's options market implies a $12.26–$13.66 range into the September 25 expiration, and every strand of positioning — call-heavy volume, call open interest building, bullish term sentiment — points the same way. The chart models disagree, calling for more of the same chop.
Listen to this analysis — prefer audio? This AAL outlook is also available as a podcast episode:
The options market implies a $12.26–$13.66 range into the September 25 expiration; here's what's driving the lean and three defined-risk ways to trade it.
Published Sunday, September 20, 2026 · Data as of Friday, September 18, 2026 close
Explore the live AAL options data in the Detailed Options Analyzer →
Quick answer
| Item | Answer |
|---|---|
| Market bias | Bullish |
| Options-implied range (into September 25) | $12.26 – $13.66 (±5.41%, or about ±$0.70) |
| Major support | $12.50 (put wall, September 25 expiration) |
| Major resistance | $14.00 (call wall, September 25 expiration) |
| Max pain (September 25) | $13.00 |
| Dealer gamma regime (estimate) | Negative for the September 25 expiration — in this regime market-maker hedging tends to amplify moves rather than cushion them; a flip-level estimate could not be computed from today's chain |
| Volatility condition | Rising — IV rank 33/100, ATM IV 47.6% · premium rich: options priced roughly 22 vol points above delivered movement |
| Next earnings | October 22, before open — after the October 16 expiration, before October 23 |
| Technical check | Mixed (neutral chart models at both the 3-day and 5-day horizons, targets inside the options range) |
| Best-fitting strategy | September 25 $13.00/$12.50 put credit spread |
| Analysis invalidated if | AAL closes below $12.50 |
1 · What matters today
AAL closed Friday, September 18 at $12.96, and the options market is pricing a move of about $0.70 either way into the September 25 expiration — a $12.26 to $13.66 range. That figure comes from what straddles cost: it is the move traders are paying for, not a forecast.
Our read of the options flow leans bullish, and unusually, every strand points the same direction: put volume collapsed to roughly half of call volume, call open interest built while put open interest shrank, and sentiment in the 7-to-30-day options is firmly call-tilted. The one level that matters is $12.50 — the strike with the heaviest put open interest expiring September 25, and the floor this read is built on. A close below it and the bullish case is done.
The chart models disagree politely: both read the tape as rangebound, with targets of $12.95 and $13.00 — inside the options range, but no directional help. Earnings are not in this window; the next report is October 22.
2 · What the options market is pricing
What changed this week
The stock barely moved — down 0.38% over the past five sessions and down 4.1% over twenty — but the option chain did plenty. Implied volatility (the market's estimate of how much AAL will move, baked into option prices) rose 12.4% over five days to 47.6%, even as it slipped 1% on Friday itself; IV rank is now 33/100 against a 14-day average of 24, so option prices have been firming from a quiet base.
The flow turned decisively call-side. Put/call volume printed 0.56 — for every put contract traded, nearly two calls changed hands — versus a 7-day average of 0.99 and a 60-day median of 1.06. Put/call open interest (contracts currently held open) eased to 1.39 from 1.47 five days ago, against a 14-day average of 1.43: puts are being retired faster than they are being added. The single biggest open-interest change in the live chain was the September 25 $14 calls, up 14,611 contracts to 20,635 — that build is what created this expiration's call wall. The September 25 $12.50 puts added 2,233 to 23,665, thickening the floor at the same time. Total option volume ran 1.33× its 20-day average, so this was a busy session, not a thin one. (Into Friday's settled September 18 expiry, the $14 and $15 puts shed 7,653 and 5,948 contracts of open interest respectively — history now, not a live level.)
Worth holding in mind: the short- and long-term trend reads do not tell the same story. Price is roughly flat over the past week and down 4.1% over two months, but down 24% over the past ten weeks — and the momentum detector logged a bullish-to-bearish crossover on September 15, three sessions before the flow turned sharply call-heavy. The near-term positioning and the bigger trend are pointed different ways, which argues for keeping directional exposure short-dated.
Expected move
Into September 25, the options market is pricing ±5.41%, or about ±$0.70 around the $12.96 spot: a range of $12.26 to $13.66. Here is how that scales out:
| Expiration | Implied move | Range around $12.96 |
|---|---|---|
| September 25 (7 DTE) | ±5.41% | $12.26 – $13.66 |
| October 2 (14 DTE) | ±8.07% | $11.91 – $14.01 |
| October 9 (21 DTE) | ±11.70% | $11.44 – $14.48 |
| October 16 (28 DTE) | ±12.96% | $11.28 – $14.64 |
The rungs step up smoothly, with one kink further out: ATM implied volatility runs 39.0% at September 25, 41.2% at October 2 and 46.8% at October 16, then jumps to 49.9% at the October 23 expiration — the first one that lands after the October 22 earnings report.
Volatility
At-the-money implied volatility sits at 47.6%, with an IV rank of 33/100 — cheaper than about 67% of the past year's readings, so option prices are not expensive by the year's standard. The direction is the interesting part: IV is 5.8% above its 30-day average (45.0%) but still below its 90-day average (50.4%), and up 12.4% over five sessions while down 14.8% over thirty. The front-month read is unavailable today — Friday was an expiry day, and front-month IV cannot be interpolated from a same-day-expiring contract, so the term-structure comparison has to wait for the next session.
Against this stock's own recent history, delivered movement is unusually subdued: 20-day realized volatility is 25.4%, a reading well below AAL's recent norm, while the 5-day-to-20-day realized ratio (1.03) says movement is neither accelerating nor decaying.
Premium is rich. The volatility risk premium — the gap between how much movement options are priced for and how much AAL has actually delivered — sits at roughly 22 vol points (47.6% implied against 25.4% realized). Positive means option sellers have been collecting more than realized movement cost them. And this gap sits at the 98th percentile of this stock's own recent readings: richer than 98% of them. The path got there fast — the gap was about 10 vol points at the end of August and more than doubled after September 9, as realized movement cooled while implied volatility held up; that widening is also one of the more extreme "vs its own norm" readings in the whole snapshot. The October 22 earnings report is 32 days out, far enough that this richness is not simply the market pre-pricing a scheduled event. That combination — IV rank 33 and a 98th-percentile premium over delivered movement — favors collecting premium over owning it in this window.
Earnings on the calendar
AAL reports on October 22, before the open. That lands after the October 16 expiration and before October 23, which is exactly where the chain shows it: implied volatility steps from 46.8% at October 16 to 49.9% at October 23, and the implied move widens to ±15.44% at that rung. Nothing in this article's 5-day window carries report risk — every structure below expires almost a month before it. For context, the last two reports came in above expectations: $0.15 per share against $0.03 expected in July, and a $0.40 loss against an expected $0.46 loss in April.
Skew and sentiment
Skew measures whether puts and calls the same distance from the stock price cost the same — when puts are pricier, traders are paying up for crash protection. In AAL right now they emphatically are not. The 25-delta put is quoted at 47.1% implied volatility while the 25-delta call is marked at 139.2%, leaving the put side about 92 vol points below the call side against a 60-day median gap of roughly 1.7 points. That is an extreme reading driven by a very richly quoted upside call, so treat the magnitude with a pinch of salt — but the direction is corroborated everywhere else in the chain: nobody is bidding up downside protection here, and the put skew has bled off over five sessions.
Sentiment across expiration dates says the same. The 0–7 day bucket scores +23 and the 7–30 day bucket +61 — the strongest in the curve — and the overall regime reads as broadly bullish, with every bucket leaning the same way. Call-tilted volume and net new call open interest are both running well above this name's own recent norms. Put open interest still outnumbers calls 1.39 to 1 across the whole chain, which is the residue of months of hedging, not this week's flow.
The key levels map
| Level | Price | Why it matters |
|---|---|---|
| Swing resistance | $14.16 | Heuristic swing-pivot cluster from recent price structure |
| Call wall (September 25) — and the whole chain's heaviest call strike | $14.00 | 20,635 contracts open at this expiration (126,716 across all expirations); the largest gamma concentration in the chain. Heavy call open interest tends to slow rallies into it |
| 200-day moving average | $13.92 | Close sits 6.9% below it — structural overhead |
| Swing resistance | $13.35 | First price-structure shelf above spot |
| 20-day moving average | $13.22 | Close sits 2.0% below; also the top of the chart models' consolidation band |
| Max pain (September 25) | $13.00 | The price where the most option value would expire worthless; expirations sometimes gravitate toward it |
| Spot | $12.96 | Friday's close |
| Put wall (September 25) | $12.50 | 23,665 contracts open — the heaviest put strike at this expiration and the floor this read depends on |
| Lower rail of the implied range | $12.26 | A 1σ down-move by September 25 |
| Swing support | $11.97 | Nearest heuristic support below the put wall |
| Whole chain's heaviest put strike | $10.00 | 189,643 contracts, concentrated in far-dated expirations — not a level for this window, but it is where the chain's biggest downside insurance sits |
Note the disagreement worth naming: the whole chain's heaviest put strike is $10, but that open interest lives in December and January expirations. For the next five days, the September 25 row's own $12.50 put wall is the level that matters.
Positioning and unusual flow
The dealer-gamma reading for the September 25 expiration is an estimate, and it comes out negative — in that regime, market-maker hedging tends to amplify moves rather than dampen them, so a break of either rail can travel further than the implied move suggests. The whole-chain estimate is negative too, though several individual expirations (October 2, October 16, October 30) estimate positive. A gamma flip level could not be computed from Friday's chain, so there is no pivot price to quote.
Three live flow items stood out, all call-side:
- October 9 $12 calls — 955 contracts traded against just 38 open, about 25× turnover, roughly $113,000 of premium. New in-the-money call exposure opened at a strike nobody was holding.
- October 2 $15 calls — 5,302 traded against 1,005 open, about $32,000 of premium in a far out-of-the-money strike. Lottery-ticket sizing, but the direction is unambiguous.
- September 25 $13.50 calls — 3,057 traded, open interest up 948 to 2,457, roughly $31,000 of premium in the expiration this article covers, one strike above spot.
3 · Technical check (the 20%)
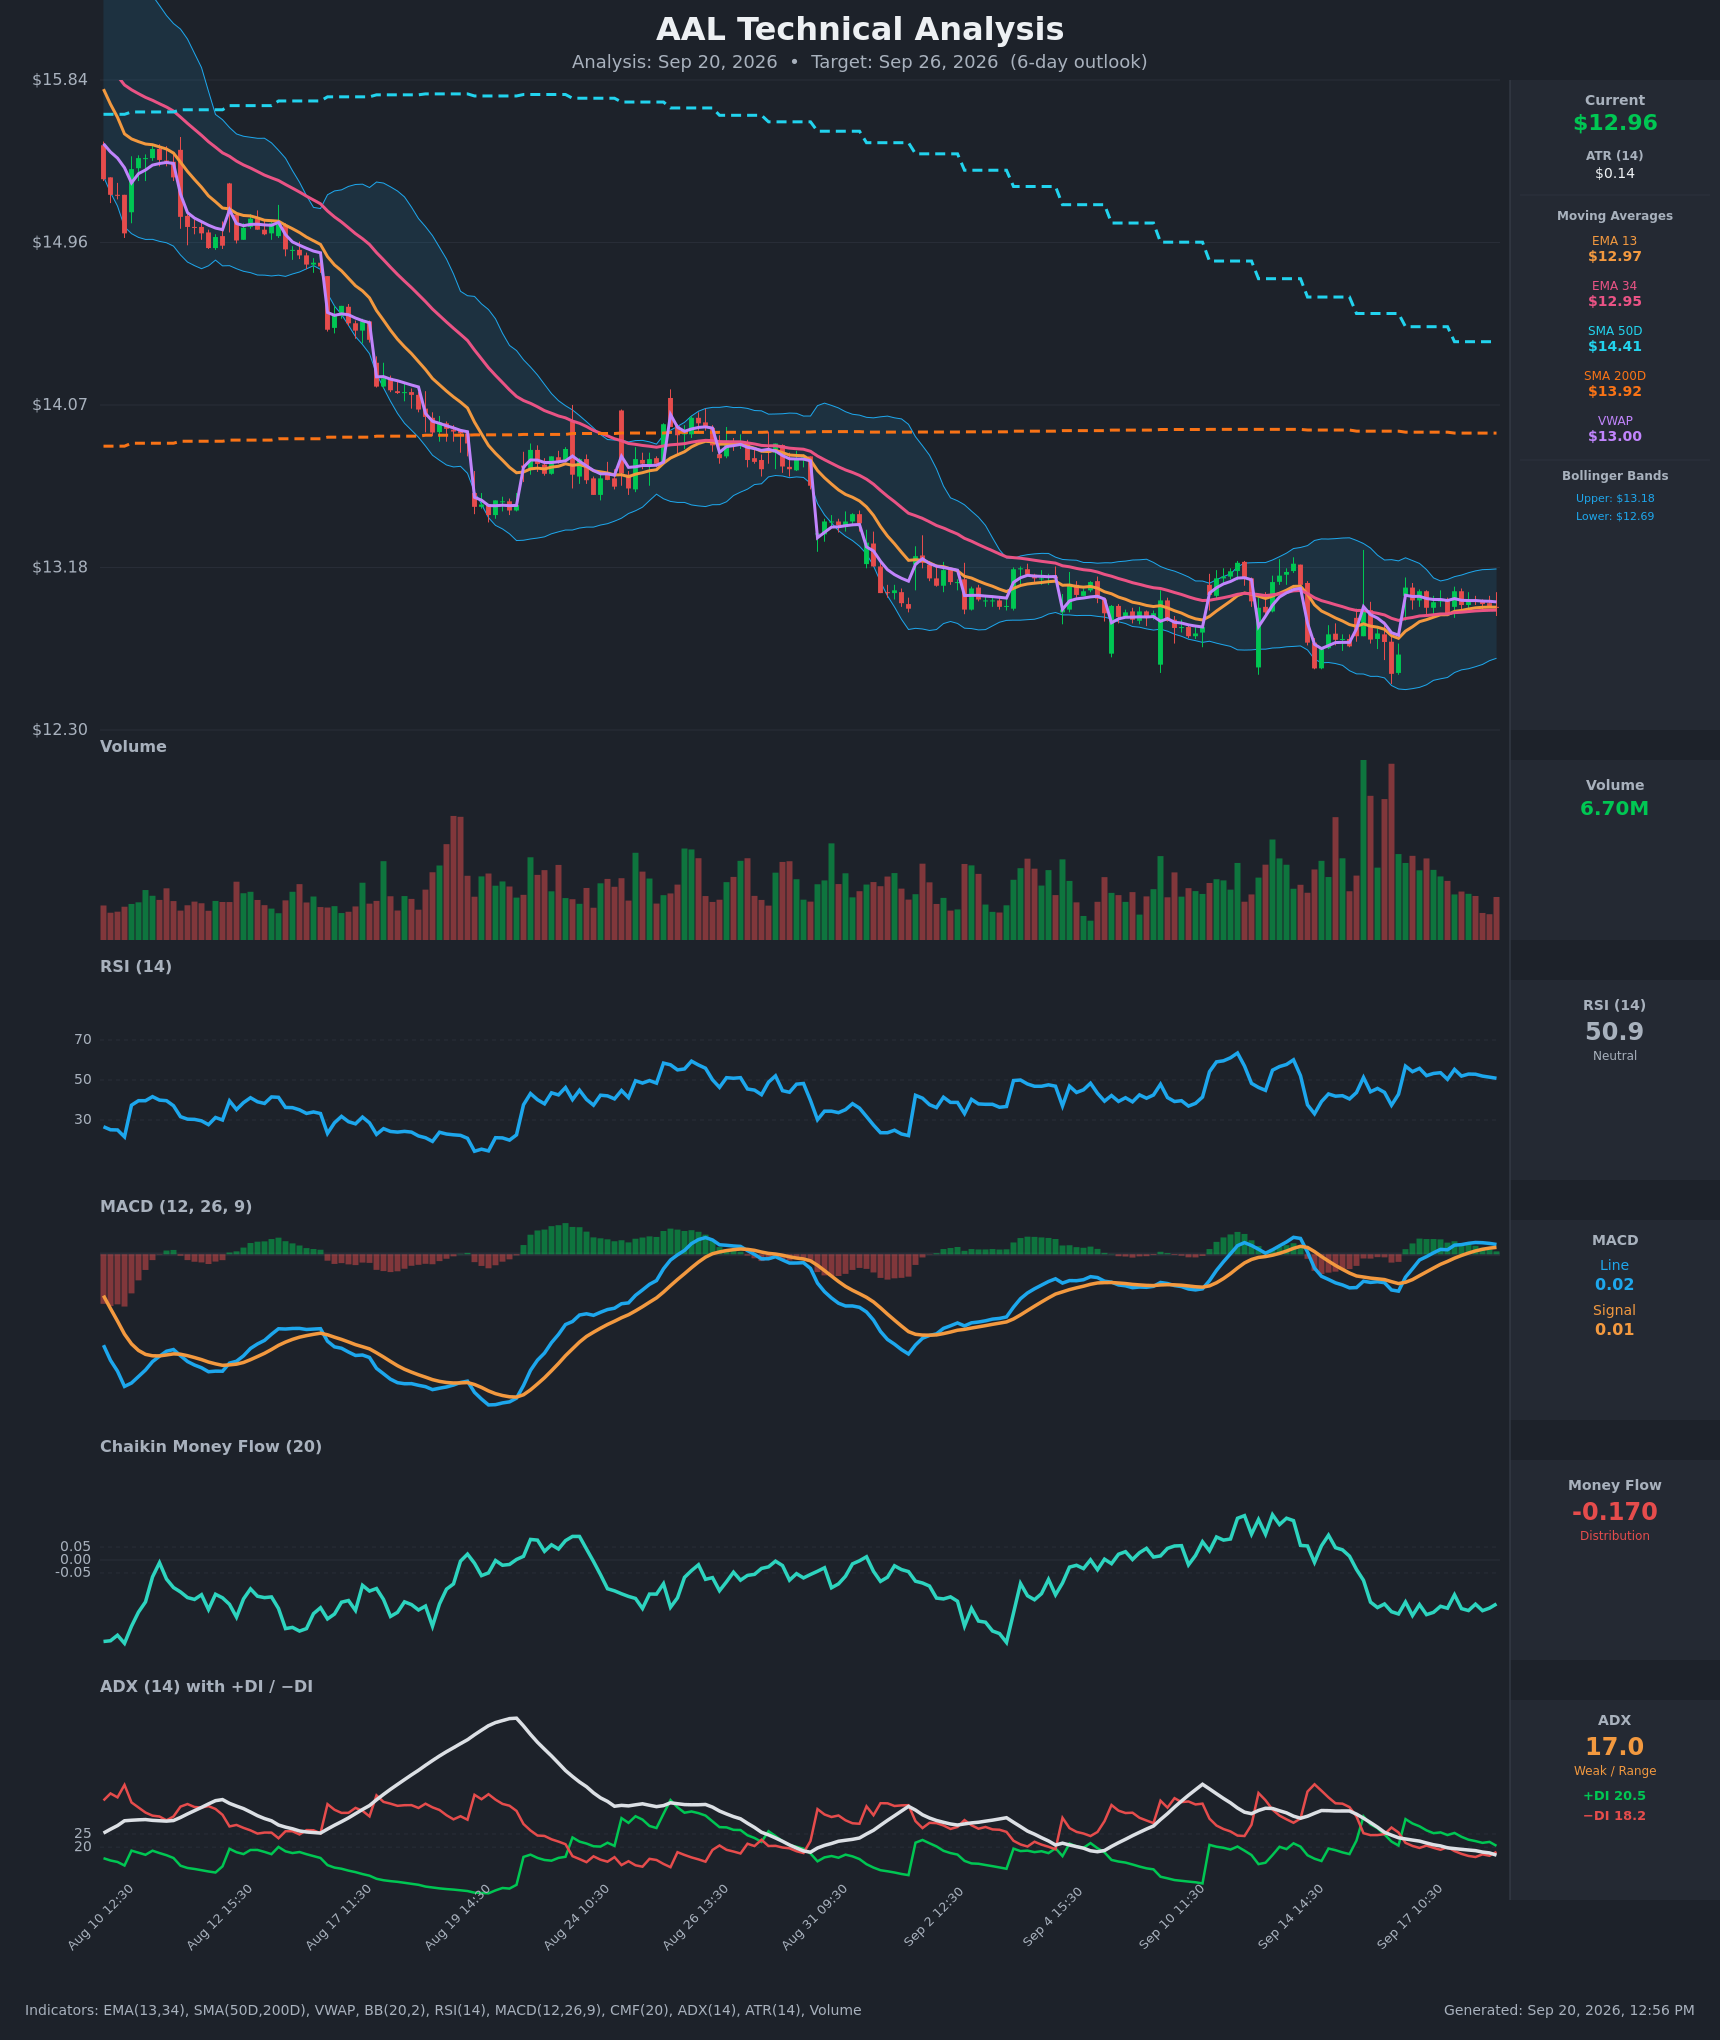
Both chart models read AAL as neutral. The 3-day model (target date September 23) targets $12.95 with a projected range of $12.68 to $13.22; the 5-day model (target date September 25) targets $13.00 with a projected range of $12.65 to $13.30. Both reference $12.965 as their starting price, essentially matching the options snapshot.
The reasoning behind both is the same: ADX at 17 and falling confirms a weak, non-trending market; price is pinned near the middle of a Bollinger band structure that has held a $12.69–$13.18 range since September 10; and while the short-term moving averages and MACD have turned mildly positive, the Chaikin Money Flow reading of −0.17 shows persistent distribution beneath a calm surface. Price also remains below both the 50-day ($14.41) and 200-day ($13.92) averages, so the larger structure is still broken.
Classification: Mixed. The chart targets sit comfortably inside the options-implied range, so there is no magnitude fight — but the models refuse to take the directional side our positioning read takes. That is a reason to express the bullish lean through defined-risk structures with break-evens below spot rather than anything that needs a breakout, and it is why the short strikes below sit at and beneath the current price rather than above it.
Model vs. Market: The options market implies $12.26–$13.66 into September 25; the 5-day technical model targets $13.00 inside a $12.65–$13.30 band. The chart is pricing roughly half the range the options are — a decisive close outside $13.18 or $12.69 is the event that would resolve which one is right.
Full technical write-ups: 3-day report → · 5-day report →
4 · Three ways the next five days can go
If AAL pushes above the call wall ($14.00): that strike carries the heaviest call open interest at this expiration and the largest gamma concentration in the entire chain. Positioning like that tends to slow rallies as they approach — but it sits about 8% above spot, well outside the implied move, so getting there inside five days would require something the chain is not currently pricing. Above it, open interest thins quickly until the $15 strike.
If AAL drifts between the walls: this is the base case the positioning describes. Max pain for September 25 is $13.00, four cents above Friday's close, and the two heaviest open-interest poles ($12.50 puts, $14.00 calls) bracket the stock with the bulk of expiring contracts sitting between them. A week that ends near $13 lets almost all of that premium decay — which is precisely what both chart models expect and what the premium-selling structures below are built for.
If AAL breaks below the put wall ($12.50): this is the case that matters most, because the estimated dealer-gamma regime for this expiration is negative. In that state, hedging flows tend to chase price rather than fade it, so a clean break of the put wall can extend toward the $12.26 lower rail and then the $11.97 swing support faster than the implied move would suggest. The chart models flag $12.69 as the trigger level — a close below that is the early warning, and a close below $12.50 is the kill switch for everything in this article.
5 · Three defined-risk structures
Prices are end-of-day midpoints as of September 18. All structures are hypothetical. Verify live prices before trading — these will be stale by the open.
If you lean bullish: September 25 $13.00/$12.50 put credit spread
- Trade: Sell the September 25 $13.00 put ($0.29), buy the September 25 $12.50 put ($0.095). In a credit spread you collect cash up front and keep it if the stock stays above your short strike.
- Credit: $0.195 ($19.50 per one-lot) · Max profit: $19.50 · Max loss: $30.50 · Break-even: $12.805
- Why it fits: premium is 98th-percentile rich versus what AAL has actually delivered, so you are being paid above the historical going rate to take the short side. The short strike sits at max pain ($13.00) and the long strike sits exactly on the put wall ($12.50), so your defined risk starts where the heaviest open interest is.
- Makes sense only if: you accept a roughly 50-delta short strike — this needs AAL to hold about flat, not to rally.
- Invalidated if: AAL closes below $12.50.
- Earnings exposure: expires 27 days before the October 22 report — no earnings-gap risk.
- Managing it: close at roughly 50% of max credit; with the longer-term trend still pointed down, take profits early rather than holding for the last few cents. If AAL closes below $12.805, close rather than hope — the negative gamma estimate means the move below the put wall can extend.
- Liquidity note: the $13.00 puts traded 2¢ wide (6.9% of mid) on 2,045 contracts; the $12.50 puts traded 1¢ wide on 4,877 contracts. Both fill easily.
- Analyze this position →
If you expect the range to hold: September 25 $12.00/$12.50/$13.50/$14.00 iron condor
- Trade: Sell the $12.50 put ($0.095) / buy the $12.00 put ($0.035); sell the $13.50 call ($0.10) / buy the $14.00 call ($0.045), all September 25.
- Credit: $0.115 ($11.50) · Max profit: $11.50 · Max loss: $38.50 · Break-evens: $12.385 and $13.615
- Why it fits: the short strikes sit on the two positioning poles for this expiration — the put wall at $12.50 and the call wall region at $13.50/$14.00 — and both chart models expect continued range-bound action with targets of $12.95 and $13.00, dead centre of the structure.
- Makes sense only if: you are comfortable that a full 1σ move breaks it. The implied rails ($12.26/$13.66) sit outside both break-evens, so this is a bet that AAL delivers less than the priced move — which is exactly what the 98th-percentile volatility premium says has been happening.
- Invalidated if: AAL closes below $12.50 or above $13.50.
- Earnings exposure: expires 27 days before the October 22 report — no earnings-gap risk.
- Managing it: close at roughly 50% of max credit, or on any decisive close outside $12.69/$13.18 (the chart models' trigger levels), whichever comes first.
- Liquidity note: the $13.50 calls traded 2¢ wide on 3,057 contracts; the $12.50 puts 1¢ wide on 4,877. The wings are thinner — the $14.00 calls are quoted $0.04/$0.05 and the $12.00 puts $0.03/$0.04, penny-wide in dollars but 20–30% of mid. On an $11.50 credit, a single bad fill eats a meaningful slice; work the legs.
- Analyze this position →
If you lean bearish: September 25 $13.00/$13.50 call credit spread
- Trade: Sell the September 25 $13.00 call ($0.27), buy the September 25 $13.50 call ($0.10).
- Credit: $0.17 ($17.00) · Max profit: $17.00 · Max loss: $33.00 · Break-even: $13.17
- Why it fits: it fights the positioning read but respects the structural picture — price is below the 20-day ($13.22), 50-day ($14.41) and 200-day ($13.92) averages, and the chart models flag $13.18 as the resistance that has capped every attempt since September 10. The break-even sits right at that ceiling.
- Makes sense only if: you weight the two-month downtrend and the persistent money-flow distribution above this week's call-side flow.
- Invalidated if: AAL closes above $13.18.
- Earnings exposure: expires 27 days before the October 22 report — no earnings-gap risk.
- Managing it: close at roughly 50% of max credit; because the short-term flow is running against this position, take profits earlier than you otherwise would and do not carry it into the final session hoping for a pin.
- Liquidity note: the $13.00 calls traded 2¢ wide (7.4% of mid) on 1,347 contracts; the $13.50 calls 2¢ wide on 3,057. Both fill.
- Analyze this position →
If none of these: no trade
Premium is genuinely rich here, and it is not earnings-inflated — so the burden is on standing aside, not on selling. The honest case for standing aside is the width of the payoff. Five-day $0.50-wide spreads on a $13 stock collect $11 to $19 against $30 to $38 of risk; the edge is real but it is small in absolute dollars, and the estimated negative dealer-gamma regime for this expiration means the tail that hurts you is fatter than a normal distribution would suggest. If a single bad fill or a 5% gap would meaningfully hurt your account, the right response to rich premium is a smaller size or a later expiration with more dollars of credit per unit of risk — not skipping it, but not forcing the 5-day version either.
6 · Quick FAQ
What is AAL's expected move this week? About ±$0.70, or ±5.41%, into the September 25 expiration — a $12.26 to $13.66 range, derived from what straddles cost as of the September 18 close.
Is AAL expected to go up or down over the next five days? Options positioning as of September 18 leans bullish — call-heavy volume, call open interest building while puts thin out, and call-tilted sentiment across every expiration bucket — but that is a read of what traders have done, not a forecast. The actionable map is the $12.26–$13.66 range and the $12.50 / $14.00 levels, with $13.00 as the gravitational centre.
Are AAL options expensive right now? Two lenses. IV rank 33/100 says option prices are lower than 67% of the past year's readings. But on top of that, they are running roughly 22 vol points above the movement AAL has actually delivered — richer than 98% of this stock's own recent readings. Cheap versus last year, unusually rich versus recent reality, which favors collecting premium rather than owning it.
When is AAL's next earnings report? October 22, before the open — after the October 16 expiration but before October 23, which is why implied volatility steps from 46.8% to 49.9% between those two rungs.
Where is AAL's biggest options support and resistance? For the September 25 expiration, the put wall is $12.50 (23,665 contracts) and the call wall is $14.00 (20,635 contracts).
What invalidates this read? A close below $12.50.
Methodology & disclosures. Data: end-of-day options-chain snapshot for AAL, 2026-09-18, generated 2026-09-20T12:56:38.146Z. Prices shown are midpoints and will differ from live markets. Momentum/positioning scores and volatility-premium comparisons are descriptive measurements of past option flow and past price movement — not investment advice, signals, forecasts, or guarantees. Earnings dates and reported results are from the data provider's earnings feed as of 2026-09-20T12:56:38.146Z; report dates can change. All trade structures are hypothetical. Every structure shown has a defined maximum loss; you can lose the entire max-loss amount. Options involve substantial risk and are not suitable for all investors.