AAPL Options Are Pricing a ±$12 Move Into September 21 — The Chart Model Sees $338.50
Apple's options chain implies a $320.04–$344.50 range into the September 21 expiration, but the positioning read underneath it is genuinely split — heavy call building on one side, unusual put sweeps on the other. Here are the levels that matter and three defined-risk ways to trade a neutral setup.

The options market implies a $320.04–$344.50 range into the September 21 expiration; here's what's driving it and three defined-risk ways to trade it.
Published Sunday, September 13, 2026 · Data as of Friday, September 11, 2026 close
Explore the live AAPL options data in the Detailed Options Analyzer →
Quick answer
| Item | Answer |
|---|---|
| Market bias | Neutral |
| Spot (Friday's close) | $332.27 |
| Options-implied range (into Sep 21) | $320.04 – $344.50 (±$12.23, ±3.68%) |
| Major support | $315.00 — the September 21 expiration's put wall, which is also its max-pain strike |
| Major resistance | $320.00 — the September 21 expiration's own call wall, but it already sits below spot and is thin; the whole chain's heaviest call strike, $340.00, is the level that actually caps upside |
| Max pain (Sep 21) | $315.00 |
| Dealer gamma regime (estimate) | Positive — market-maker hedging tends to dampen moves; flip level ≈ $320.00 |
| Volatility condition | Falling — IV rank 44/100 · premium fair: options priced ~0.4 vol points above delivered movement |
| Technical check | Mixed (chart model bullish, 4-day and 7-day) |
| Best-fitting strategy | Iron condor, September 21 expiration |
| Analysis invalidated if | AAPL closes below $318.33 |
1 · What matters today
Apple closed Friday at $332.27 after a 1.30% gain over five sessions and an 8.96% run over twenty. The options market is pricing a move of about $12.23 in either direction through the September 21 expiration — that's the move implied by what at-the-money straddles cost — which maps to a $320.04–$344.50 range. Our read of the positioning underneath is genuinely split: traders added more than 200,000 contracts of call open interest day-over-day, yet put-side sweeps dominated the unusual-flow list and the shortest-dated sentiment bucket flipped negative. That disagreement is why the bias here is plain neutral rather than a lean. The chart model disagrees — it targets $338.50 by the 21st. The level that changes the picture is $318.33: below the swing shelf there, the $315 put wall and max-pain strike become the relevant magnets.
2 · What the options market is pricing
What changed this week
The stock did the heavy lifting: +1.30% over five sessions, +8.96% over twenty, and Friday's close sits 4.94% above the 20-day moving average and 4.50% above the 50-day. Option volume ran 2.1× its 20-day average, so this was a high-participation session, not a drift.
Volatility leaked out of the chain while price rose. At-the-money implied volatility — the market's estimate of how much AAPL will move, baked into option prices — fell 4.56% on the day to 24.19%, and is down 18.39% over 30 days. IV rank, which locates today's reading inside the past year, printed 44.4 against a 7-day average of 50.6.
Positioning moved both ways. Put/call volume came in at 0.60 — for every 100 call contracts traded there were 60 puts — against a 7-day average of 0.49, so hedging activity picked up. But open interest tells the opposite story: put/call open interest sits at 0.49 (49 puts held open for every 100 calls) versus a 14-day average of 0.55, meaning puts have been thinning while calls build. The single largest change in the whole chain was the October 16 $340 calls, which added 90,942 contracts of open interest to 106,553, with about $6.5 million of premium changing hands Friday.
The short- and long-term trend reads agree for once: momentum and price are bullish over the ~20-day and ~50-day windows (+9.0% and +12.9% respectively) with the ~5-day read flat. Worth one note of caution — a momentum crossover turned bearish on September 4, and the flow has since overrun it rather than confirming it.
Expected move
Into the September 21 expiration, the options market is pricing a 1-standard-deviation move of ±3.68%, or ±$12.23 around Friday's $332.27 close — derived from what at-the-money straddles cost.
| Expiration | Implied move | Range around $332.27 |
|---|---|---|
| Monday, Sep 14 (3 DTE) | ±1.56% | $327.09 – $337.45 |
| Sep 18 (7 DTE) | ±3.34% | $321.17 – $343.37 |
| Sep 21 (10 DTE) | ±3.68% | $320.04 – $344.50 |
| Oct 2 (21 DTE) | ±5.75% | $313.16 – $351.38 |
Note the shape: the rungs widen with time, as they should, but the September 21 contracts carry lower at-the-money IV (22.22%) than the September 18 monthly expiration (24.10%). The extra three days buy you a wider range at a slightly cheaper per-day volatility price — the monthly expiry is where the front-week premium is concentrated.
Volatility
At-the-money IV across the chain is 24.19%. IV rank of 44/100 means today's reading is cheaper than roughly 56% of the past year's, and the IV percentile of 36.9 says nearly two-thirds of the last 52 weeks printed a lower IV than today — a middling, unremarkable volatility regime. Current IV sits under both the 30-day average (24.86%) and the 90-day average (25.27%), and it's down 18.4% over 30 days. The front-month read is unavailable today because Friday was an expiry day, so there's no clean term-structure comparison to quote.
Two observations against Apple's own recent history are worth having. Twenty-day realized volatility — how much the stock has actually been moving — is 23.75%, which is unusually low for this name. But the ratio of 5-day to 20-day realized vol is 1.60, an unusually elevated reading: movement has accelerated sharply in the last week relative to the month behind it. The stock is waking up even as the options chain prices it calmer.
Premium: fair, not rich. The volatility risk premium — the gap between how much movement options are priced for and how much AAPL has actually delivered — is currently about +0.4 vol points. When that's positive, option sellers have been collecting more than realized movement cost them. At the 67th percentile it's richer than about two-thirds of this stock's own recent readings, but the absolute gap is under half a vol point, which is a long way from "free money." That combination — IV rank 44 and a fractional premium over delivered movement — argues for collecting premium in tightly defined, modest-width structures rather than paying up for long volatility, but it does not justify selling anything naked. One path note: the premium has compressed fast, from about +5.4 vol points on September 8 to +2.0 on the 10th to +0.4 on Friday, as realized movement caught up to implied. And the sign flip back in late August — from roughly −8 vol points to +5 — was mechanical, the July 31 gap rolling out of the 20-day realized-volatility window, not a trader signal.
Skew and sentiment
The 25-delta skew — puts and calls the same distance from the stock price don't cost the same, and when puts are pricier traders are paying up for crash protection — sits at 1.6 vol points of put richness (25-delta put IV 25.03% versus 25-delta call IV 23.45%). Against its own 60-day median of 1.6 vol points, that is dead on normal. Against the past two weeks, though, it has steepened: the 7-day average was 1.3 vol points and the 14-day average 1.0. Downside protection has been getting relatively more expensive over the last stretch, just from a very flat starting point.
Two flow readings pull against each other. Day-over-day, call open interest grew by 202,089 contracts versus 66,780 for puts — unusually heavy call building for this name versus its own norm. Yet eight put contracts cleared the peer-relative unusual-volume bar against six calls, and that put-side tilt is the single most extreme reading in the whole positioning snapshot — put sweeps dominating to a degree that is rare for AAPL. Retail-visible open interest is building calls; the aggressive prints are leaning puts.
Sentiment across the curve tells the same divided story. The 0–7 day bucket scored −15 on Friday after printing +72 the day before — a violent one-day flip in the shortest-dated flow. The 7–30 day bucket sits at +17 and the 30–60 day bucket at +45, its strongest reading in a week, driven by 136,700 contracts of net new call open interest in that tenor. The overall regime label is Mixed, and that is the honest summary: near-dated flow turned defensive while the one-to-two-month positioning got more constructive.
The key levels map
| Level | Price | Why it matters |
|---|---|---|
| 52-week high | $344.57 | Friday's close is 3.57% beneath it; the range position is 89.6/100 |
| Top of implied range (Sep 21) | $344.50 | 1 standard deviation up, per straddle pricing — lands within a nickel of the 52-week high |
| Chart-model resistance | $340.67 | Upper Bollinger Band from the technical reports |
| Whole chain's heaviest call strike | $340.00 | 175,176 calls held open across all expirations, and the single largest gamma strike — the real overhead magnet |
| 7-day chart-model target | $338.50 | Where the technical model expects price on September 21 |
| Swing resistance | $332.90 | Nearest pivot cluster above Friday's close |
| Spot / Friday close | $332.27 | Reference for every figure above and below |
| Second-largest gamma strike | $330.00 | 109,051 calls open chain-wide; with $340 it brackets spot |
| Chart-model support | $325.00 | The 7-day report's stated invalidation level |
| Bottom of implied range (Sep 21) | $320.04 | 1 standard deviation down |
| Call wall (Sep 21) + gamma flip (estimate) | $320.00 | Heaviest call open interest at this expiration (6,146) — already deep in the money and thin, so read it as leftover positioning, not a ceiling. One rough estimate places the dealer gamma flip here too |
| Swing support | $318.33 | Nearest structural shelf; this article's kill switch |
| 50-day moving average | $317.97 | Price sits 4.50% above it |
| 20-day moving average | $316.63 | Price sits 4.94% above it |
| Put wall + max pain (Sep 21) | $315.00 | Heaviest put open interest at this expiration (671) and the strike where the most option value expires worthless |
| Whole chain's heaviest put strike | $300.00 | 87,528 puts open across all expirations — the chain's real downside shelf |
One caveat readers should carry with them: the September 21 expiration is a Monday tenor with very little open interest of its own. Its call wall (6,146 contracts) and put wall (671 contracts) are an order of magnitude thinner than the chain-wide clusters at $340 and $300. When the expiration's own levels disagree with the aggregate — and here they do, sharply — the thin ones are weak magnets and the fat ones are where hedging flows actually concentrate.
Positioning and unusual flow
One rough estimate of dealer positioning puts the chain in a positive gamma regime, both across all expirations and scoped to September 21 specifically — meaning market makers' hedging of the options they've sold tends to dampen moves rather than amplify them, and price should be stickier than usual inside the range while the regime holds. The same estimate places the flip level at $320.00; spot sits about 3.7% above it, which is an unexceptional distance for this stock.
Three flow items stood out, all in live (unexpired) contracts:
- October 16 $340 calls: +90,942 open interest to 106,553, on 9,324 contracts traded and roughly $6.5 million of premium. This is the biggest positioning change in the chain, and it is why $340 carries the heaviest call gamma anywhere on the board.
- October 16 $360 calls: +41,801 to 121,770 — the second-largest build, and further out of the money. Someone is paying for upside into mid-October, or writing covered calls against it.
- September 21 $340 calls: +5,664 to 5,882 on 4,011 contracts traded, while the September 21 $320 calls shed 6,127. Within our target expiration, positioning rolled up from in-the-money strikes toward $340.
For context on the settled side: into Friday's expiry, the $335 calls traded 462,380 contracts and the $332.5 puts 221,997 — enormous, but that's expiration-day churn, not positioning, and those contracts no longer exist.
3 · Technical check (the 20%)
Both technical reports read bullish. The 4-day model (checkpoint September 18) targets $337.00 with a projected range of $324.50 to $341.00; the 7-day model (target date September 21, the same date as our options horizon) targets $338.50 with a projected range of $321.00 to $344.00. The decisive reads behind both: an ADX at 44 with +DI at 35.1 versus −DI at 11.5, which is a genuinely strong directional trend rather than a range, and a Chaikin Money Flow at 0.141 that has stayed persistently positive through the rally — sustained accumulation, not distribution into strength. The offsetting note is a cooling RSI, down from about 75 to 65.9 while price held, which the reports themselves call orderly profit-taking rather than a reversal.
Classification: mixed. Both chart targets sit comfortably inside the options-implied range, so the technical model is not asking for anything the options market considers unusual — it's simply placing the center of gravity higher than spot, while our positioning read places it nowhere in particular. What's striking is the width agreement: the 7-day model's $321.00–$344.00 projection and the options market's $320.04–$344.50 are nearly the same envelope drawn by two unrelated methods. They disagree about the middle, not the edges.
Model vs. Market: The options market implies $320.04–$344.50 into September 21; the 7-day technical model targets $338.50 inside that same envelope. The gap is directional, not dimensional — the chart says the drift is up, the positioning data says the drift is undecided, and the question gets settled by whether AAPL can close above the $340 call cluster where the chain's heaviest hedging sits.
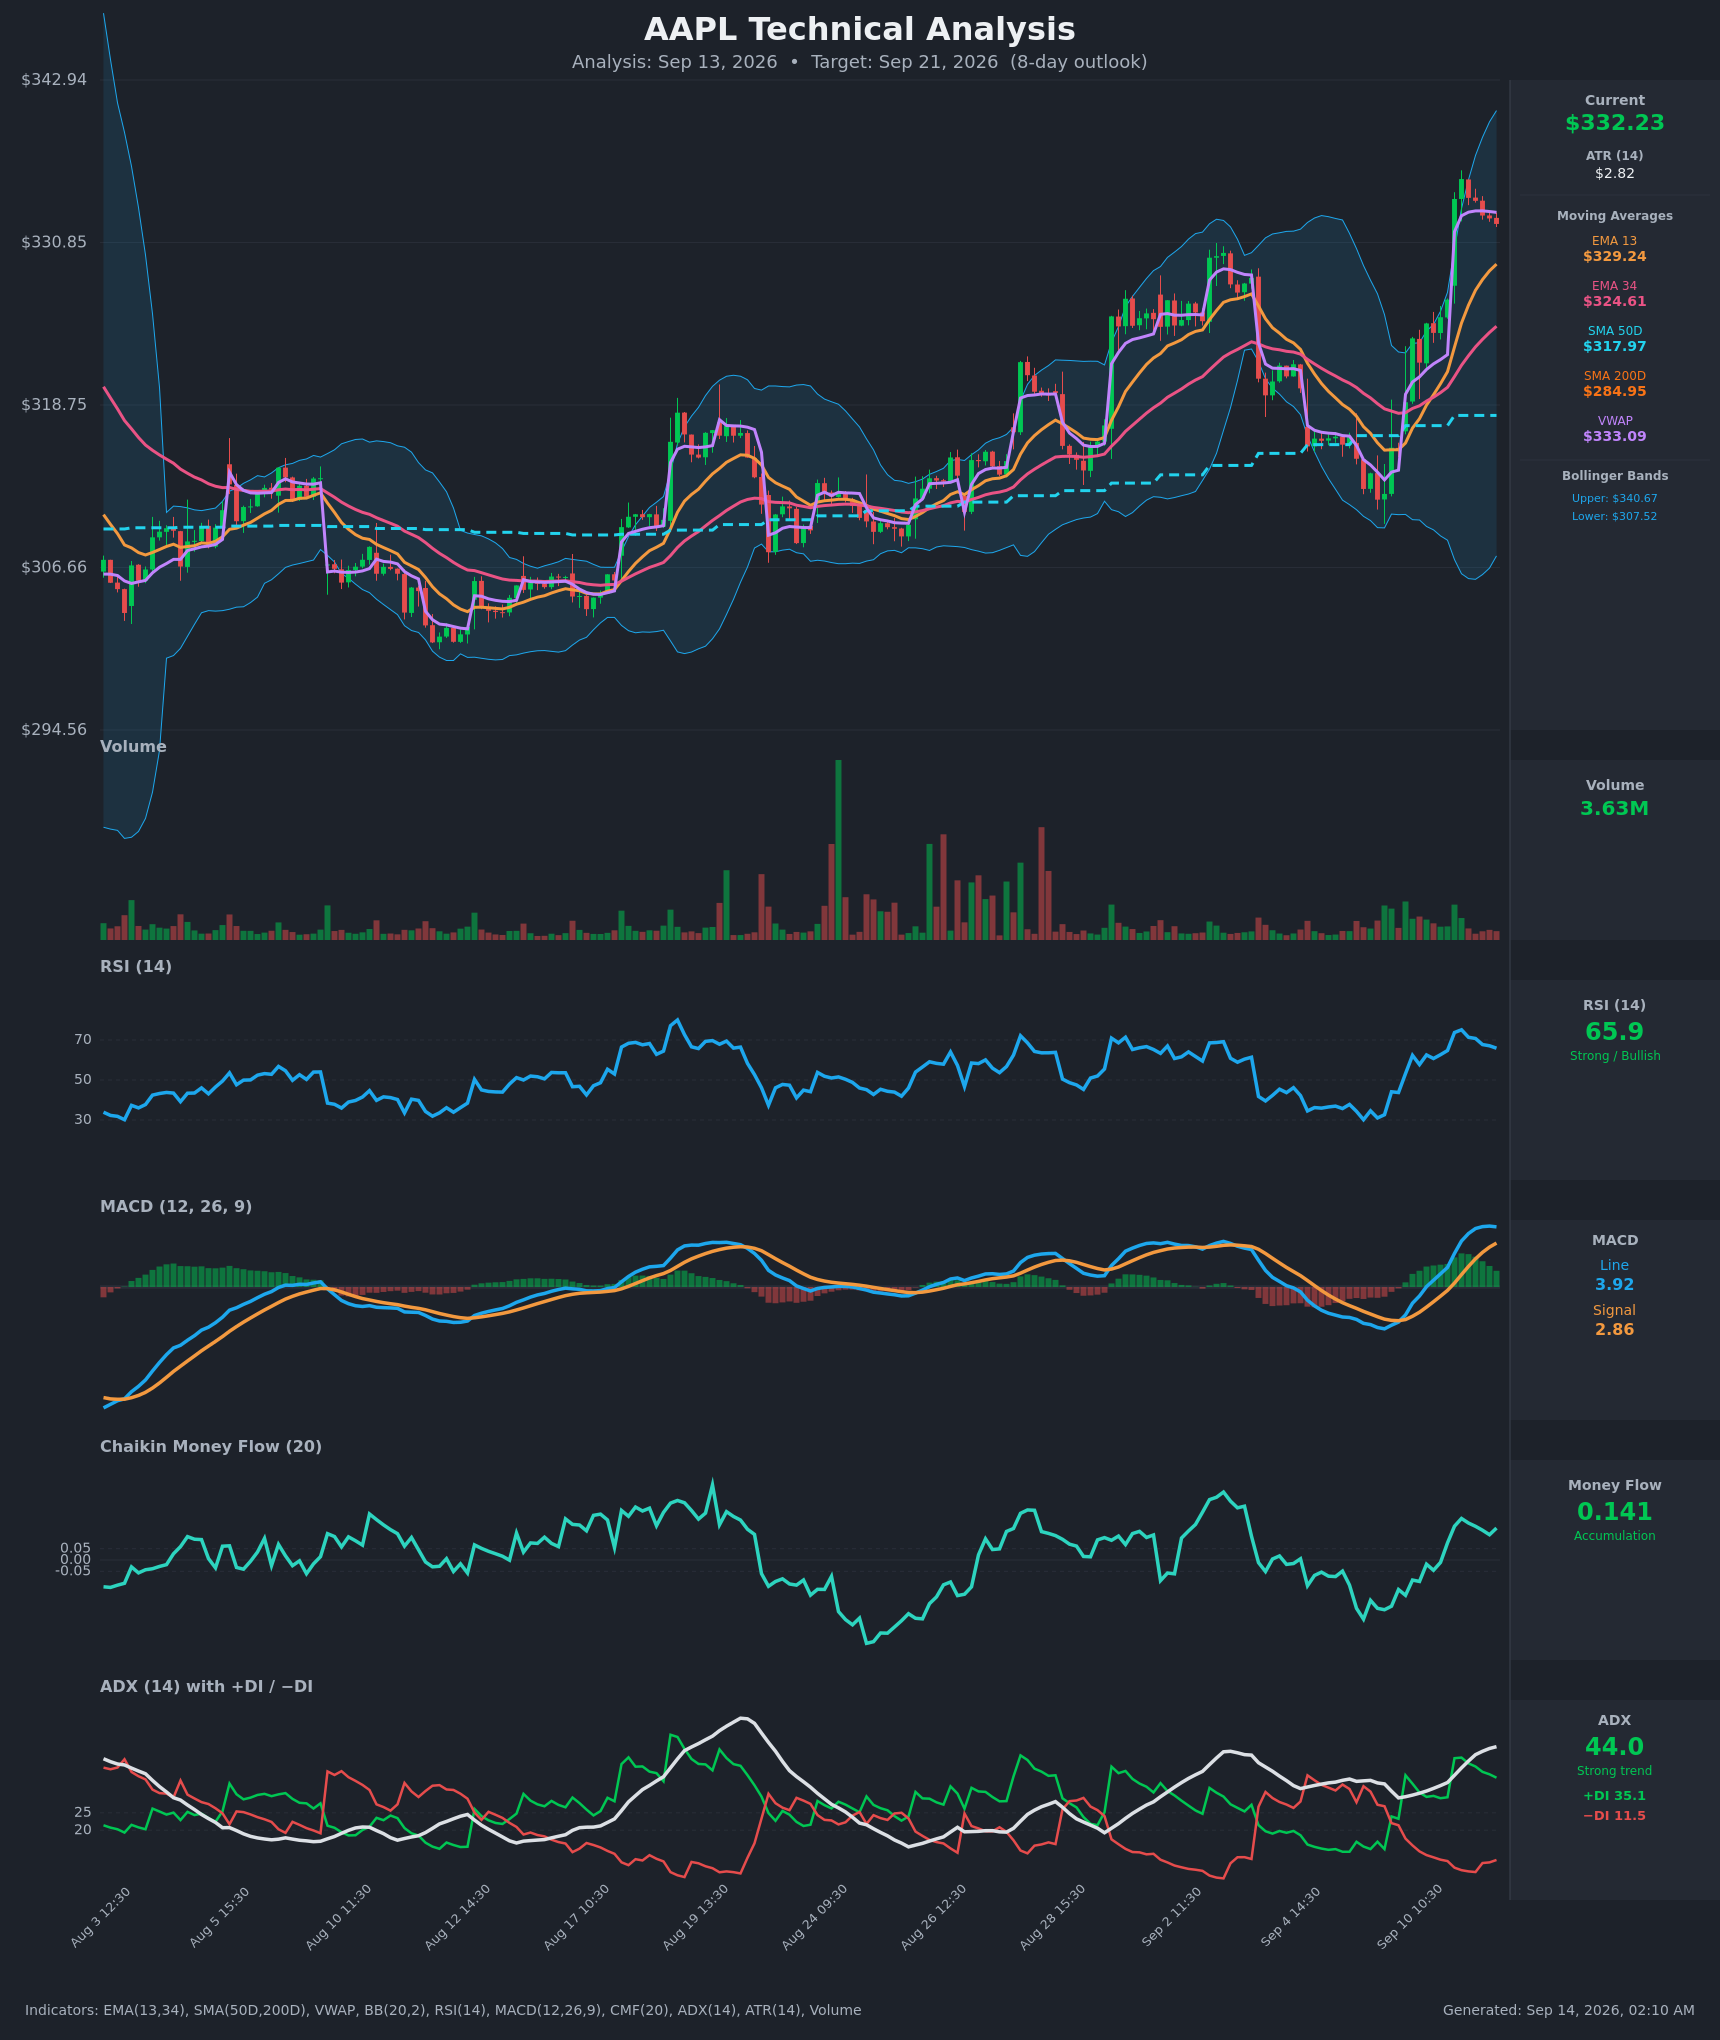
Practically, the bullish chart read did one thing to the structures below: it pushed the short call side of the range trade up to $342.50, above both chart targets and above the $340.67 resistance the reports name, rather than parking it at $337.50 where the premium is fatter.
Full technical write-ups: 4-day report → · 7-day report →
4 · Three ways the next 7 days can go
If AAPL pushes above $340: that is where the chain's heaviest call open interest and largest gamma concentration sit, so it is the level where hedging flows are densest. In a positive-gamma regime, that density tends to slow a rally rather than fuel one. A clean break through leaves thinner positioning until the implied-range ceiling at $344.50 and the 52-week high at $344.57 — two markers a nickel apart, which is the kind of coincidence that makes a level sticky.
If AAPL drifts between $325 and $340: this is the base case the positioning data supports. The two largest gamma strikes chain-wide, $340 and $330, bracket Friday's close, and the estimated positive gamma regime implies hedging that leans against moves in both directions. The September 21 max-pain strike at $315 — the price where the most option value expires worthless — sits 5.2% below spot, far enough away that it isn't a realistic magnet over ten days without a catalyst, but it does tell you which direction expiring open interest would prefer.
If AAPL breaks below $320: that's the bottom of the implied range and, by one rough estimate, the dealer gamma flip level — below which market-maker hedging tends to accelerate selling rather than cushion it. Beneath it the ladder tightens fast: swing support at $318.33, the 50-day at $317.97, the 20-day at $316.63, and the expiration's put wall and max pain together at $315.00. A close through $318.33 is where the range thesis in this article stops being valid.
5 · Three defined-risk structures
Prices are end-of-day midpoints as of 2026-09-11. All structures are hypothetical. Verify live prices before trading — these will be stale by the open.
A liquidity warning that applies to all three: the September 21 series is a thin Monday expiration. Quoted spreads on the strikes below run roughly 5% to 19% of mid. These are workable with limit orders at or near the midpoint, but do not expect to get filled by hitting the market, and size accordingly.
If you expect the range to hold: iron condor
- Trade: Sell the September 21 $325/$320 put spread and the $342.50/$347.50 call spread (four legs, one condor)
- Credit: $1.71 · Max profit: $171 · Max loss: $329 · Break-evens: $323.29 and $344.21
- Why it fits: A neutral bias, an estimated positive gamma regime that dampens moves, and premium that's fair rather than rich all argue for a defined-width credit structure instead of a directional one. The short strikes sit just inside the implied-range rails of $320.04 and $344.50, and the upper break-even at $344.21 lands right at the 52-week high. The call side is deliberately placed above both chart-model targets ($337.00 and $338.50) and above the $340.67 technical resistance, so the bullish technical read can be fully right and this trade still pays.
- Makes sense only if: you believe the $325–$342.50 corridor holds for ten days. If you think the chart model's bullish trend read wins outright, skip this one.
- The specific risk: max pain at $315 sits below the lower break-even. A drift toward that strike into expiration is the scenario that hurts the put side, and it's the reason the invalidation level below is where it is.
- Invalidated if: AAPL closes below $318.33 (close the put side) or above $340.00 (close the call side)
- Managing it: close at roughly 50% of max credit; exit regardless by September 18 to avoid the final-weekend gamma; if either short strike is breached on a closing basis, close that side rather than hope.
- Liquidity note: the $325 puts were quoted $1.95 / $2.18 (23¢ wide) and the $342.50 calls $1.40 / $1.66 (26¢ wide). The wings are the problem — the $347.50 calls are 15¢ wide on an 80¢ mid. Enter as a single four-leg order at a limit price, never leg by leg.
- Analyze this position →
If you lean bullish: short put spread
- Trade: Sell the September 21 $325/$320 put credit spread (collect premium; you keep it if AAPL stays above $325)
- Credit: $0.99 · Max profit: $99 · Max loss: $401 · Break-even: $324.01
- Why it fits: $325.00 is the exact level the 7-day technical model names as its own invalidation — the breakout base it says must hold. Selling the put there means the trade stays fully profitable as long as the bullish chart read isn't broken on its own terms. The long wing at $320 sits at the implied-range floor and the estimated gamma flip, so the structure's maximum pain zone is below the level where hedging behaviour is expected to change.
- Makes sense only if: you accept the 2.6% cushion is thin for a $401 risk — this is a 4-to-1 risk/reward that needs a high hit rate, which is precisely what selling into a strong uptrend is supposed to deliver.
- Invalidated if: AAPL closes below $325.00
- Managing it: take profits at 50% of the credit; with the short-term trend read flat against a bullish longer-term trend, don't hold this into the final two sessions hoping for the last twenty cents. Close by September 18.
- Liquidity note: $325 puts $1.95 / $2.18, $320 puts $0.99 / $1.17 — about 11% and 17% of mid respectively. Work the spread order near the mid; the combined quote is tighter than the legs suggest.
- Analyze this position →
If you lean bearish: bear call spread
- Trade: Sell the September 21 $340/$345 call credit spread (collect premium; you keep it if AAPL stays below $340)
- Credit: $1.03 · Max profit: $103 · Max loss: $397 · Break-even: $341.03
- Why it fits: $340.00 is the chain's heaviest call strike and its largest gamma concentration — 175,176 contracts held open across all expirations — and the biggest single positioning build of the week (the October 16 $340 calls) piled onto exactly that level. Heavy call open interest overhead tends to slow rallies, which is the structural argument for fading a push into it. The break-even at $341.03 also sits above the $340.67 upper-Bollinger resistance both technical reports name.
- Makes sense only if: you are willing to trade against a strong, confirmed uptrend read (ADX 44, +DI dominant) on the strength of the positioning cluster alone. This is the lowest-conviction of the three.
- Invalidated if: AAPL closes above $340.00
- Managing it: close at 50% of credit or on any daily close above $340, whichever comes first. Because the short-term trend is the one fighting you here, take profits earlier than you otherwise would.
- Liquidity note: these are the two most tradeable strikes in the expiration. The $340 calls were $2.00 / $2.20 (20¢ wide) with 5,882 contracts open and 4,011 traded; the $345 calls were $1.05 / $1.10 — just 5¢ wide on 2,277 contracts of volume.
- Analyze this position →
If none of these: no trade
There is a real case for standing aside. Premium is fair, not rich — roughly 0.4 vol points above delivered movement, which is richer than two-thirds of Apple's recent readings but still a fractional edge — and an IV rank of 44 means you are not being paid a premium-selling bonus for taking on ten days of gamma. Layer on a September 21 expiration whose bid-ask spreads run 5–19% of mid, and a meaningful share of the theoretical edge in every structure above gets handed to the market maker on entry and exit. If you want this exposure and don't need the exact September 21 date, the September 18 monthly expiration quotes far tighter (2.6–7% on its most active strikes) for a nearly identical implied range of $321.17–$343.37. Trading a thin tenor for the sake of three extra days is a choice you should make deliberately, not by default.
6 · Quick FAQ
What is AAPL's expected move into September 21? ±$12.23, or ±3.68%, giving a $320.04–$344.50 range — per the options market's straddle pricing as of the September 11 close.
Is AAPL expected to go up or down over the next 7 days? Options positioning as of September 11 reads neutral — call open interest is building fast while the most aggressive prints lean to puts, and near-dated sentiment turned negative while one-to-two-month sentiment turned more positive. That's a read of what traders have done, not a forecast. The actionable map is the $320.04–$344.50 range and the $315 / $340 levels.
Are AAPL options expensive right now? IV rank 44/100 says option prices are cheaper than about 56% of the past year's readings; on top of that, they're running only about 0.4 vol points above the movement AAPL has actually delivered — richer than roughly 67% of this stock's own recent readings, but a small absolute gap. The verdict: fair. Sell premium in defined-width structures if you want the exposure, but there's no fat edge on either side here.
Where is AAPL's biggest options support and resistance? For the September 21 expiration itself, the put wall is $315.00 and the call wall is $320.00 — but that expiration is thin, and its call wall already sits below spot. Across the whole chain, the heaviest put strike is $300.00 (87,528 contracts) and the heaviest call strike is $340.00 (175,176 contracts); $340 is the level that actually matters overhead.
What invalidates this read? A close below $318.33. Beneath that swing shelf the moving-average cluster at $317.97 and $316.63 gives way quickly to the $315.00 put wall and max-pain strike, and the range-hold thesis is done.
Methodology & disclosures. Data: end-of-day options-chain snapshot for AAPL, 2026-09-11, generated 2026-09-14T02:10:47.071Z. Prices shown are midpoints and will differ from live markets. Momentum/positioning scores and volatility-premium comparisons are descriptive measurements of past option flow and past price movement — not investment advice, signals, forecasts, or guarantees. All trade structures are hypothetical. Every structure shown has a defined maximum loss; you can lose the entire max-loss amount. Options involve substantial risk and are not suitable for all investors.