AAPL Options Are Pricing a $10.55 Move — and the Call Wall Already Sits Below Spot
The options market implies a $325.58–$346.68 range for Apple into the September 25 expiration, with the heaviest call open interest at $335 sitting just under Friday's close and max pain down at $325. Here's what the positioning says, where the chart model disagrees, and three defined-risk ways to trade it.
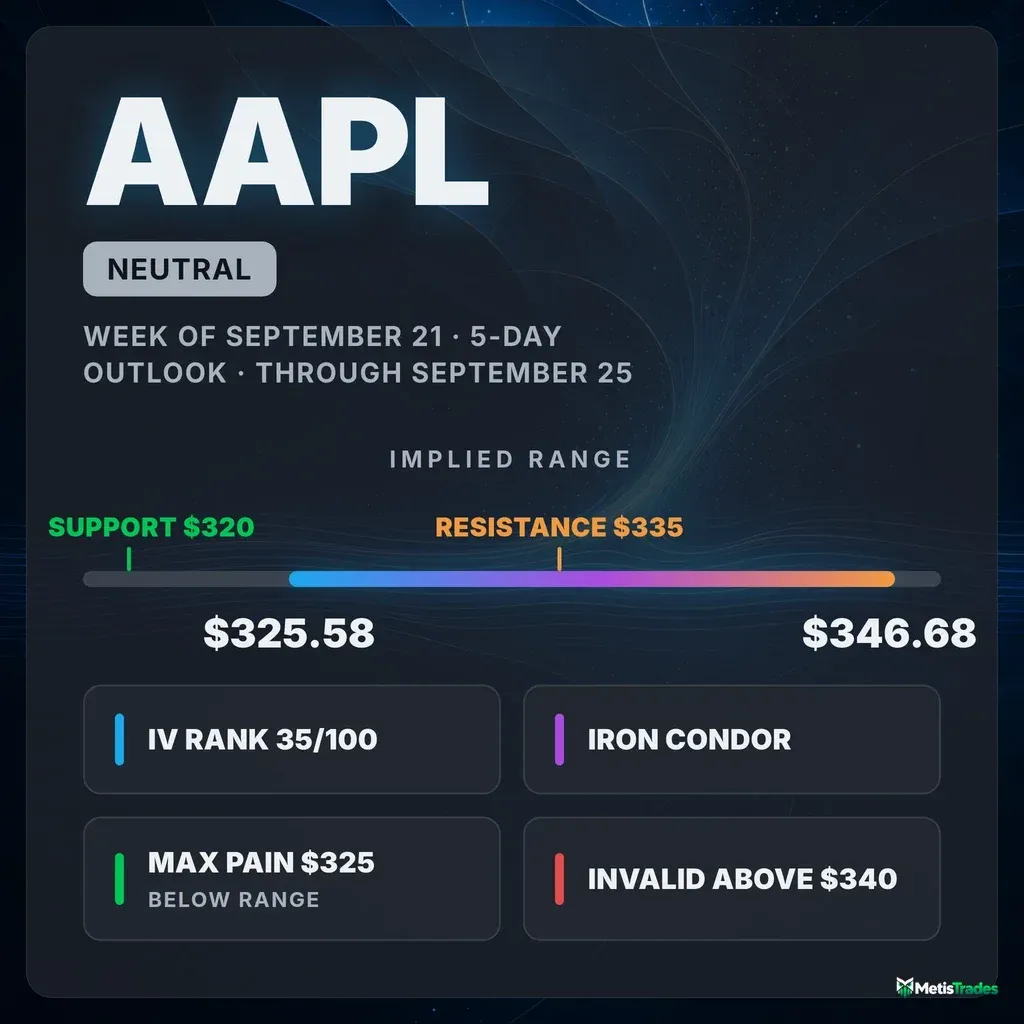
The options market implies a $325.58–$346.68 range into the September 25 expiration; here's what's driving it and three defined-risk ways to trade it.
Published Sunday, September 20, 2026 · Data as of Friday, September 18, 2026 close
Explore the live AAPL options data in the Detailed Options Analyzer →
Quick answer
| Item | Answer |
|---|---|
| Market bias | Neutral |
| Options-implied range (into Sept 25) | $325.58 – $346.68 (±3.14%) |
| Major support | $320.00 (put wall, Sept 25 expiration) |
| Major resistance | $335.00 (call wall, Sept 25 expiration) |
| Max pain (Sept 25) | $325.00 |
| Dealer gamma regime (estimate) | Positive — hedging tends to dampen moves; flip level ≈ $225 |
| Volatility condition | Falling — IV rank 35/100 · premium fair: options priced ~1 vol point above delivered movement |
| Technical check | Mixed (bullish, 3-day and 5-day chart models) |
| Best-fitting strategy | Iron condor (range-holding) |
| Analysis invalidated if | AAPL closes above $340.00 |
1 · What matters today
Apple closed Friday, September 18 at $336.13 after a 1.2% gain over five sessions and an 8.0% run over the past month. The options market is pricing a move of about $10.55 in either direction over the next five days — that's the move implied by what straddles cost at the September 25 expiration, or roughly $325.58 to $346.68. Our read of the flow lands squarely neutral: short-dated sentiment and call-side building lean positive, but the single most important structural fact cuts the other way. The strike with the biggest pile of open call contracts for September 25 — the level that tends to act as a ceiling — sits at $335, which is below Friday's close. Apple is already pressed against its own overhead positioning, with max pain (the price where the most option value would expire worthless) down at $325. Both chart models we checked lean bullish, which is the honest tension in this week's setup. A close above $340 breaks the range read.
2 · What the options market is pricing
What changed this week
The story of the last five sessions is a grind higher on cheapening volatility. Apple added 1.16% while at-the-money implied volatility — the market's estimate of how much AAPL will move, baked into option prices — fell 6.0% over five days and 9.0% over thirty, landing at 22.7% against a 30-day average of 24.4%. IV rank, which places today's reading inside the past year's range, has dropped to 35/100 from a 7-day average of 45 and a 14-day average of 48. Positioning tilted call-side while that happened: put/call open interest fell to 0.50, meaning one put contract held open for every two calls, against a 14-day average of 0.55. Put/call volume at 0.58 was almost exactly its 7-day norm of 0.58, so this isn't a hedging surge — it's slow call accumulation. The largest still-live open-interest build was the September 21 $345 calls, up 4,465 contracts, followed by 3,491 new September 25 $360 calls. (Into Friday's expiration, the settled $342.50 calls shed and rebuilt violently, adding 15,144 contracts on 39,354 of volume — settled history now, not a live level.) Total option volume ran at 0.93× its 20-day average, so none of this was frantic. The short- and long-term trend reads agree here: momentum has been pointing the same direction across the five-day, one-month and two-month lookbacks, with the one-month read the strongest of the three.
Expected move
Into September 25, the options market is pricing ±3.14%, or about ±$10.55 around the $336.13 spot — a band of $325.58 to $346.68. Here is how that scales across the near expirations:
| Expiration | Implied move | Range around $336.13 |
|---|---|---|
| Sept 21 (3 days) | ±1.45% | $331.26 – $341.00 |
| Sept 23 (5 days) | ±2.43% | $327.96 – $344.30 |
| Sept 25 (7 days) | ±3.14% | $325.58 – $346.68 |
| Oct 2 (14 days) | ±4.39% | $321.37 – $350.89 |
The ladder steps up smoothly with time rather than jumping at any single rung — there's no scheduled-event bump hiding in these expirations, and the next earnings report is not until November 2, well past everything quoted here.
Volatility
At-the-money implied volatility is 22.7%, an IV rank of 35/100 — cheaper than about 65% of the past year's readings — and an IV percentile of 18, meaning AAPL options have actually traded below today's level on only 18% of sessions in the past year. Direction is uniformly down: −4.0% on the day, −6.0% over five sessions, −9.0% over thirty, with the current print sitting under both the 30-day (24.4%) and 90-day (25.3%) averages. The front-month read is unavailable today because Friday was an expiry day and the nearest contract had already settled — that's a calendar artifact, not missing data, and it returns next session.
Two readings versus this stock's own recent history are worth noting. Twenty-day realized volatility — how much Apple has actually been moving — is 21.7%, unusually depressed compared to its own norm. And the five-day-to-twenty-day movement ratio is 0.53, meaning the last week's actual movement ran at roughly half the pace of the prior month. Apple has been coasting.
Premium: rich or cheap? The volatility risk premium — the gap between how much movement options are priced for and how much AAPL has actually delivered — sits at about 1 vol point (22.7% implied against 21.7% realized). When that gap is positive, option sellers have been collecting more than realized movement cost them. One point is thin in absolute terms, but it is richer than about two-thirds of this stock's own recent readings, and that gap has itself widened slightly versus its norm. The path matters more than the level: in early September this premium was running near 5 to 6 vol points and it has compressed steadily since, as realized movement caught up to what options were charging. Combine an IV rank of 35 with a 68th-percentile premium over delivered movement and you get a genuinely middling verdict — there is no fat edge in either selling or owning volatility here, which argues for structures that make money from price staying put rather than from volatility collapsing.
Skew and sentiment
Puts and calls the same distance from the stock price don't cost the same — when puts are pricier, traders are paying up for crash protection. Here, 25-delta puts are running at 23.6% implied volatility against 21.8% for calls, a gap of 1.75 vol points versus a 60-day median of 1.73 for this name. That is protection priced at almost exactly its normal cost — no fear premium, no complacency. It has steepened mildly over the past two weeks (the 14-day average gap was 1.45 points), which is the one quietly defensive note in an otherwise call-tilted chain.
Sentiment in short-dated options is the most bullish input in the file. The 0–7 day bucket scores +42 and the 7–30 day bucket +33, driven by delta-weighted volume running half a turn to the call side and by call open interest building faster than put open interest (+36,545 calls versus +25,445 puts in the front bucket). The summary read across the curve is broadly bullish, and it has firmed over the past three sessions from a 7-day average of +14 in the front bucket. Eight call contracts versus seven puts cleared the unusual-volume bar against peers — call-side sweeps edging it, but barely.
The key levels map
| Level | Price | Why it matters |
|---|---|---|
| Top of implied range (Sept 25) | $346.68 | Upper edge of the move options are pricing this week |
| 52-week high | $344.57 | Apple sits 2.45% below it |
| Whole-chain heaviest call strike | $340.00 | 187,302 calls open across all expirations and the single largest gamma strike — a thicker ceiling than the Sept 25 wall |
| Chart-model resistance | $337.70 | Both technical reports name this as the breakout trigger |
| Swing resistance | $336.22 | Recent pivot cluster, essentially at spot |
| Spot / close | $336.13 | Friday's close |
| Call wall (Sept 25) | $335.00 | 9,083 calls open — the heaviest call strike for this week's expiration, and it sits below spot |
| Swing support / chart-model support | $332.90 / $331.50 | Recent pivot shelf and the 5-day model's invalidation line |
| Max pain (Sept 21 and Sept 23) | $330.00 | The nearer expirations' gravity point, and a dense put strike |
| Bottom of implied range (Sept 25) | $325.58 | Lower edge of the priced move |
| Max pain (Sept 25) | $325.00 | Where the most option value would expire worthless this week |
| 20-day moving average | $322.64 | Price is 4.18% above it |
| 50-day moving average | $320.14 | Price is 4.99% above it |
| Put wall (Sept 25) | $320.00 | 5,941 puts open — the heaviest downside strike for this week |
| Whole-chain heaviest put strike | $300.00 | 84,762 puts open across all expirations — the structural floor |
Note the disagreement worth flagging: the whole chain's heaviest call strike is $340 and its heaviest put strike is $300, a wide corridor built mostly from October and November positioning. For this week specifically, the corridor is much tighter — $320 to $335 — and Apple is trading at the top of it.
Positioning and unusual flow
One rough estimate of dealer positioning puts both the whole chain and the September 25 expiration in a positive gamma regime, meaning market makers' hedging of the options they've sold tends to dampen moves rather than amplify them. The estimated flip level — below which that hedging would start accelerating selling instead of cushioning it — sits at roughly $225, far below anything in play, and spot currently sits unusually far above that estimate even by this stock's own recent standards. Treat those figures as estimates built on an assumed dealer convention, not observed inventory; the practical read is simply that nothing in the structure currently argues for cascade risk.
Three live flow items stand out. The September 21 $337.50 calls traded 26,198 contracts against just 1,561 of open interest — nearly seventeen times turnover, a burst of very short-dated upside positioning right at the resistance shelf. On this week's expiration, the $335 calls were the single biggest premium magnet at $4.32 million changing hands on 8,948 contracts, with the $337.50 calls close behind at $3.70 million; both cluster exactly where the call wall sits. On the other side, the September 25 $340 puts traded 4,629 contracts for $2.90 million against only 404 open — someone paid up for in-the-money downside into this week's expiry. Call money is pressing the ceiling while a smaller, more expensive put bet leans the other way.
3 · Technical check
Both chart models lean bullish, and both name the same trigger. The 3-day report targets $338.50 by September 23 with a projected range of $329.50 to $342.50; the 5-day report targets $339.50 by September 25 with a projected range of $326.50 to $345.00. Both sit comfortably inside what options are pricing — the 5-day options-implied band of $325.58 to $346.68 is wider on both ends than the model's $326.50–$345.00 projection — so this is a directional disagreement, not a magnitude one.
The technical case rests on trend strength: ADX at 33.6 with directional indicators firmly bullish-tilted, price above every major moving average, and a tight consolidation under $337.70 that both reports read as a continuation flag. The counterweight, which both reports also flag, is a fresh MACD bearish crossover and a money-flow reading that rolled from +0.13 to −0.095 over the past several sessions — distribution creeping in near the highs while price held. That combination is exactly what a market pinned under heavy call open interest looks like from the chart side.
Model vs. Market: The options market implies $325.58–$346.68 into September 25 with max pain at $325; the 5-day technical model targets $339.50. The chart wants a push into the zone where the whole chain's heaviest call open interest ($340) sits — the gap resolves only if buyers absorb that $335–$340 supply, and that is precisely what the positioning data says is hard.
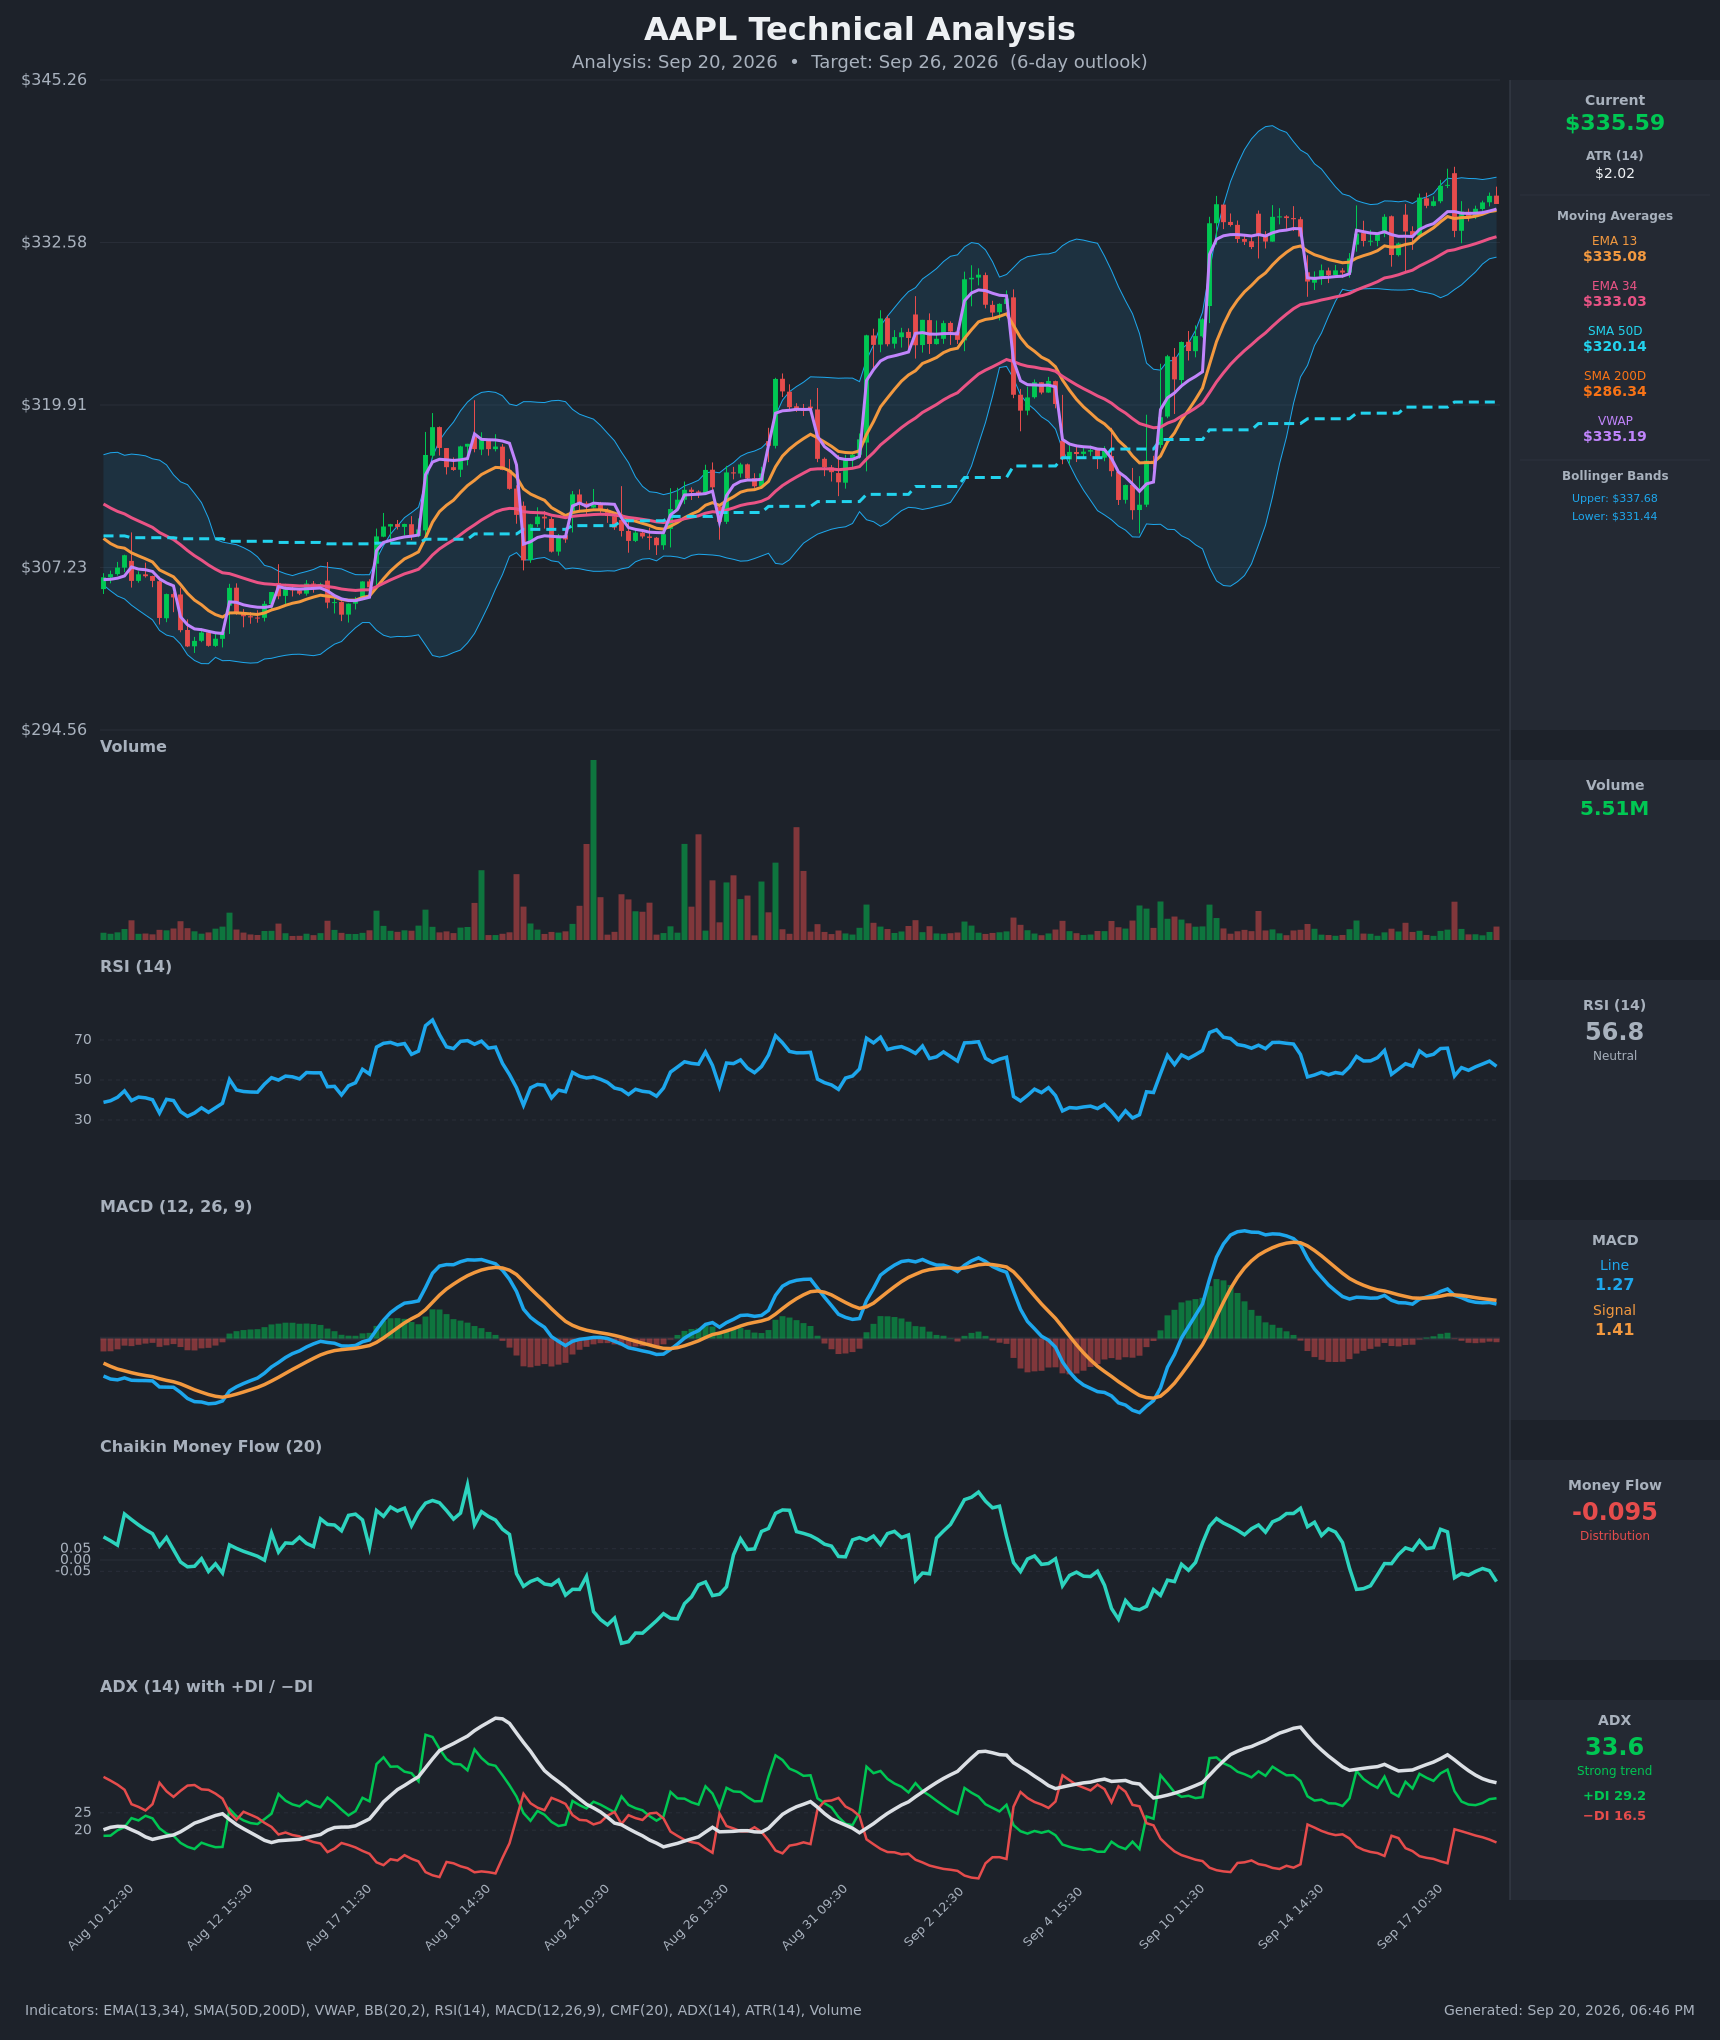
The practical effect on strike selection below: because both models are bullish and both name $331.50–$332.50 as their downside invalidation, the put side of every structure here is shaded to $330 or lower — under the chart support, not on top of it.
Full technical write-ups: 3-day report → · 5-day report →
4 · Three ways the next five days can go
If AAPL pushes above the Sept 25 call wall ($335) and clears $340: the week's heaviest call open interest is already behind price at $335, so the immediate ceiling is really the whole chain's $340 strike, where 187,302 calls sit open and gamma exposure is by far the largest of any strike. Positioning that heavy tends to slow rallies as it is absorbed; above it, the next meaningful shelf is the 52-week high at $344.57 and then the top of the implied range at $346.68. This is the branch that kills the neutral read.
If AAPL drifts between the walls: this is the base case the positioning supports. With dealer hedging estimated to be in the dampening regime and max pain for September 25 at $325 — more than $11 below spot — expiring open interest exerts a mild downward tug rather than an upward one. A drift that ends the week anywhere between $325 and $335 would be entirely ordinary given the corridor, and the $330 strike (max pain for both the September 21 and September 23 expirations) is a natural waypoint.
If AAPL breaks below the put wall ($320): that strike carries 5,941 open puts for this week and sits just under both the 20-day ($322.64) and 50-day ($320.14) moving averages — a three-way confluence. Below it, this week's positioning thins out quickly and the next dense level is the whole chain's $300 put strike. The estimated gamma flip level is far below at roughly $225, so one rough read is that hedging would still be cushioning rather than amplifying on the way down, which argues for an orderly retracement rather than a cascade.
5 · Three defined-risk structures
Prices are end-of-day midpoints as of 2026-09-18. All structures are hypothetical. Verify live prices before trading — these will be stale by the open.
If you expect the range to hold: iron condor
- Trade: Sell the Sept 25 $325/$320 put spread and the Sept 25 $347.50/$352.50 call spread (four legs, one condor)
- Credit: $0.96 · Max profit: $96 · Max loss: $404 · Break-evens: $324.04 and $348.47
- Why it fits: The short strikes bracket the options-implied range almost exactly — $325 is this week's max pain and sits at the bottom edge of the priced move, $347.50 is just above the top edge at $346.68. You collect a credit for the market doing what the neutral read, the dampening gamma estimate, and a 0.53 five-day-to-twenty-day movement ratio all describe: not much.
- Makes sense only if: you believe the $335–$340 call overhang caps the upside and the $320 put wall holds the downside — both of which have to be true for the credit to be earned.
- Invalidated if: AAPL closes above $340.00 or below $320.00.
- Managing it: close at ~50% of max credit; exit the whole structure by September 24 regardless rather than carrying four legs into expiration Friday. If either short strike is breached on a close, close that side rather than hope — with only seven days on the clock, gamma risk dominates the remaining theta.
- Liquidity note: the $325 puts traded 15¢ wide on a $0.90 mid with 2,954 contracts changing hands, the $320 puts 4¢ wide, the $347.50 calls 26¢ wide on a $0.76 mid, the $352.50 calls 6¢. The call-side spreads are the wide legs — work the mid and don't pay the ask on a $96 credit.
- Analyze this position →
If you lean bullish: short put spread
- Trade: Sell the Sept 25 $330/$325 put credit spread (you collect a credit up front and keep it if AAPL stays above $330)
- Credit: $0.97 · Max profit: $97 · Max loss: $403 · Break-even: $329.03
- Why it fits: The short strike sits under both chart models' stated support ($331.50–$332.50) and above this week's max pain, with the long leg parked exactly on the $325 max-pain strike. Short-dated sentiment is the most bullish input in the chain, and the $330 put carries a delta of −0.26 — a standard premium-selling distance.
- Makes sense only if: you side with the technical read that the current consolidation is a pause in an uptrend rather than distribution under a ceiling.
- Invalidated if: AAPL closes below $330.00.
- Managing it: close at ~50% of max credit; exit by September 24 regardless. Because the short-term trend read is flat while the one-month read is the strong one, take profits earlier than you otherwise would rather than pressing for the last few cents.
- Liquidity note: the $330 puts traded 17¢ wide on a $1.87 mid with 5,439 contracts done; the $325 puts 15¢ wide on 2,954. Both are among the busiest strikes on the expiration — fills should be straightforward at or near the mid.
- Analyze this position →
If you lean bearish: short call spread
- Trade: Sell the Sept 25 $340/$345 call credit spread
- Credit: $1.27 · Max profit: $127 · Max loss: $373 · Break-even: $341.27
- Why it fits: The short strike is the whole chain's heaviest call strike — 187,302 contracts open and the single largest gamma concentration anywhere on the board. It is also above this week's own call wall at $335 and above both chart models' resistance trigger of $337.70. You are selling into the thickest overhead supply in the name.
- Makes sense only if: you think the $335–$340 zone absorbs this rally, which is the most direct expression of the positioning read and the most direct bet against both chart models.
- Invalidated if: AAPL closes above $340.00.
- Managing it: close at ~50% of max credit; exit by September 24 regardless. If AAPL closes above $337.70 on volume, close rather than wait — that is the level both technical reports call the breakout trigger, and this spread has only $2.30 of cushion above it.
- Liquidity note: the $340 calls traded 24¢ wide on a $2.38 mid with 12,894 contracts done ($3.07 million of premium); the $345 calls 25¢ wide on 6,278 contracts. Deep, active strikes — but the quarter-wide markets mean patience on the fill.
- Analyze this position →
If none of these: no trade
There is a legitimate case for standing aside. The premium on offer is only fair — about one vol point above what Apple has actually delivered, on an IV rank of 35 — so the seller's cushion is thin even though it screens as richer than two-thirds of this stock's own recent readings. Seven days to expiration means gamma risk dominates the remaining time decay, which is why the shortlist of premium-selling candidates keeps flagging this window as the wrong end of the curve for income. And the central tension here is unresolved: the chain says capped, the chart says breakout, and neither side of that argument is cheap to take. If you have no strong view on whether $337.70 breaks, the honest answer is that a $96 credit is not enough compensation for finding out.
6 · Quick FAQ
What is AAPL's expected move this week? About ±$10.55 (±3.14%) into the September 25 expiration, or a range of $325.58 to $346.68 around the $336.13 close — that's what straddle pricing implied as of Friday, September 18.
Is AAPL expected to go up or down over the next five days? Options positioning as of September 18 reads neutral — short-dated flow leans call-side, but Apple is trading above the strike carrying the heaviest call open interest for this week, and max pain sits $11 below spot. That's a description of what traders have already done, not a forecast. The actionable map is the $325.58–$346.68 range and the $320/$335 levels.
Are AAPL options expensive right now? IV rank of 35/100 says option prices are lower than 65% of the past year's readings; on top of that, they're running about 1 vol point above the movement AAPL has actually delivered, which is richer than roughly 68% of this stock's own recent readings. Net: fair, not cheap and not rich — a middling backdrop that favors range structures over outright volatility bets in either direction.
Where is AAPL's biggest options support and resistance? For the September 25 expiration, the put wall is $320.00 and the call wall is $335.00. Across the whole chain those levels widen to $300.00 and $340.00 — a much broader corridor built mostly from October and November positioning.
What invalidates this week's read? A close above $340.00.
Methodology & disclosures. Data: end-of-day options-chain snapshot for AAPL, 2026-09-18, generated 2026-09-20T18:46:46.400Z. Prices shown are midpoints and will differ from live markets. Momentum/positioning scores and volatility-premium comparisons are descriptive measurements of past option flow and past price movement — not investment advice, signals, forecasts, or guarantees. Earnings dates and reported results are from the data provider's earnings feed as of 2026-09-20T18:46:46.400Z; report dates can change. All trade structures are hypothetical. Every structure shown has a defined maximum loss; you can lose the entire max-loss amount. Options involve substantial risk and are not suitable for all investors.