AMD Options Are Pricing a $34 Move Into September 18 — But the Chart Model Sees Half That
AMD's options market implies a $481.91–$550.35 range into the September 18 expiration, while both technical models target $521.50. Here's what the positioning data shows and three defined-risk ways to trade the gap.

The options market implies a $481.91–$550.35 range into the September 18 expiration; here's what's driving it and three defined-risk ways to trade it.
Published Sunday, September 13, 2026 · Data as of Friday, September 11, 2026 close
Explore the live AMD options data in the Detailed Options Analyzer →
Quick answer
| Item | Answer |
|---|---|
| Market bias | Neutral with a bullish tilt |
| Spot (Friday, September 11 close) | $516.13 |
| Options-implied range (into September 18) | $481.91 – $550.35 (±6.63%, or ±$34.22) |
| Major support | $450.00 — the put wall for the September 18 expiration |
| Major resistance | $500.00 — the call wall for the September 18 expiration (now below spot; the nearest overhead pile-up is $530) |
| Max pain (September 18) | $492.50 |
| Dealer gamma regime (estimate) | Positive — hedging tends to dampen moves; flip level ≈ $390 |
| Volatility condition | Falling — IV rank 16/100 · premium thin: options priced about 3 vol points below delivered movement |
| Technical check | Confirms (bullish, 3-day and 5-day models both target $521.50) |
| Best-fitting strategy | September 18 $515/$530 call debit spread, conditional on AMD holding above $505 |
| Analysis invalidated if | AMD closes below $505.00 |
1 · What matters today
AMD closed Friday at $516.13 after a 13.2% run over five sessions, and the options market is pricing a move of roughly $34 either way into the September 18 expiration — a $481.91 to $550.35 range. That figure comes from what straddles cost at that expiration; it is the market's own estimate of how far the stock travels, not a direction.
Our read of the flow leans mildly positive: call-side volume and open-interest building are running well above this stock's own recent norm, and the short-dated sentiment read is bullish. Pulling the other way, puts have quietly gotten pricier than calls versus their usual relationship, and the expiring open interest for September 18 sits below the current price — max pain is $492.50. Both technical models agree with the mild upward tilt, targeting $521.50.
The single level that changes the picture: a close below $505.
2 · What the options market is pricing
What changed this week
The five-day story is a sharp rally into flat volatility. AMD is up 13.2% over the trailing five sessions and 6.9% over twenty. Put/call volume came in at 0.45 — for every put contract traded there were more than two calls — against a 7-day average of 0.57 and a 14-day average of 0.64. The open-interest ratio told the same story louder: put/call open interest is 0.58 today versus a 7-day average of 0.80 and 0.90 over fourteen days. Put positioning has been dismantled at pace while call positioning was built.
Total option volume ran 1.56× its 20-day average. The largest genuine build of new positioning at the target expiration was the September 18 $540 call, which went from an unlisted strike to 5,414 contracts of open interest on 2,997 contracts of volume — traders reaching for a strike 4.6% above spot. Further out, the November 20 $630 call added 2,943 contracts on $5.5 million of premium. (Into Friday's now-settled September 11 expiry, the $510 calls churned 18,190 contracts — about $12.7 million of premium — but that expiration has settled and is history, not a live level.)
The short- and long-term trend reads mostly agree here: the past week and the past month both read bullish, while the ~50-day read is flat with price still down 4.4% over that window. So the near-term flow is running ahead of the bigger trend rather than fighting it — which argues for short-dated expressions and taking profits early rather than holding for a measured move.
Expected move
Into September 18, the options market is pricing a 1-sigma move of ±6.63%, or ±$34.22 around the $516.13 spot — a range of $481.91 to $550.35. Here is the ladder across the next four tradeable expirations:
| Expiration | Implied move | Range around $516.13 |
|---|---|---|
| September 14 (3 DTE) | ±3.02% | $500.54 – $531.72 |
| September 16 (5 DTE) | ±5.29% | $488.83 – $543.43 |
| September 18 (7 DTE) | ±6.63% | $481.91 – $550.35 |
| September 25 (14 DTE) | ±9.32% | $468.03 – $564.23 |
The jump between the first two rungs is the interesting one: the Monday, September 14 expiration carries an ATM implied volatility of just 33.3%, while September 16 prices 45.2% and September 18 prices 47.9%. The market is treating the front two sessions as quiet and the back half of the window as where the movement lives.
Volatility
ATM implied volatility — the market's estimate of how much AMD will move, baked into option prices — sits at 48.85%. IV rank is 16/100, meaning today's reading is cheaper than roughly 84% of the past year's. That is not a fluke of one session: the 30-day moving average of ATM IV is 57.5% and the 90-day average is 68.9%, so implied volatility has been grinding lower for a while (down 38.1% over thirty sessions). It slipped 2.7% on Friday alone even as it is up 5.0% over five sessions. The front-month read is unavailable for this snapshot — September 11 was an expiry day, and front-month ATM IV cannot be interpolated from a same-day-expiring contract.
Underneath that, realized movement is unusual for this name: 20-day realized volatility of 52.1% is well below AMD's own recent norm, even though it looks high in absolute terms. Short-run movement is running a touch hot against that month-long baseline (the 5-day/20-day realized ratio is 1.08, a bit above typical).
Premium: thin, not rich. The volatility risk premium — the gap between how much movement options are priced for and how much AMD has actually delivered — is running at about −3.2 vol points. Option sellers have been collecting less than the stock's realized movement has cost them. Where today's gap sits versus this stock's own recent readings is the nuance: at the 66th percentile, it is richer than about two-thirds of AMD's recent gaps, because the gap has been even more negative lately. A week and a half ago the gap was positive (around +4 vol points on September 2) and it has walked steadily back below zero as the rally delivered real movement. Combine IV rank 16 with a negative premium over delivered movement and the verdict is straightforward: this is a week to own optionality rather than sell it, and any credit structure needs to be sized with that in mind.
Skew and sentiment
Puts and calls the same distance from the stock price don't cost the same. Today, 25-delta puts are running 0.4 vol points over 25-delta calls (49.45% vs 49.00%) — against a 60-day median where calls were 0.5 vol points over puts. That is roughly a 0.9 vol-point swing toward downside protection versus this stock's own norm, and it is the one genuinely cautious reading in the file. Compared against AMD's own recent history, put demand is stretched about as far as it has been in months.
Everything else in the sentiment stack leans the other way. Call-tilted volume and call-side open-interest building are both running well above their normal range for this name. Sentiment in short-dated options — the read of how the chain is positioned across expiration buckets — scores +22 in the 0–7 day bucket and +34 in the 7–30 day bucket, driven by call-side delta-weighted flow and call open interest building; the 30–60 day and 60–120 day buckets are flat at −3 each. The overall regime label is Mixed: the front of the curve is positioned constructively while the back is indifferent.
The key levels map
| Level | Price | Why it matters |
|---|---|---|
| 52-week high | $584.73 | 11.7% above spot; range position is 84/100 |
| Upper rail, implied range | $550.35 | Top of the September 18 expected move |
| Swing resistance | $546.44 | Recent pivot cluster |
| Heaviest overhead calls (Sep 18) | $530.00 | 7,442 contracts open; the first real ceiling for this expiration |
| Swing resistance / technical ceiling | $527.20 – $528.67 | Upper Bollinger Band and pivot cluster |
| Call wall, whole chain | $520.00 | 22,756 calls open across all expirations — also the single largest gamma strike |
| Swing resistance | $517.35 | Nearest pivot overhead |
| Spot | $516.13 | Friday, September 11 close |
| Technical support / kill switch | $505.00 | The 5-day model's invalidation level; ours too |
| Call wall (Sep 18) | $500.00 | 9,651 calls open — the expiration's heaviest call strike, now in the money |
| 50-day moving average | $496.55 | Spot is 3.9% above it |
| Swing support | $494.87 | First pivot support below spot |
| Max pain (Sep 18) | $492.50 | Where the most option value would expire worthless |
| 20-day moving average | $482.04 | Spot is 7.1% above it |
| Lower rail, implied range | $481.91 | Bottom of the September 18 expected move |
| Put wall (Sep 18) | $450.00 | 6,355 puts open — the expiration's biggest downside pile |
| Gamma flip estimate | ≈ $390 | One rough estimate of where hedging would turn from cushioning to amplifying — far below spot |
Note the disagreement worth naming: the whole chain's heaviest call strike is $520, but the September 18 expiration's own call wall is $500 — a strike the stock has already run through. What caps this window in practice is the $520/$530 band, where 7,199 and 7,442 contracts sit open for the target expiration.
Positioning and unusual flow
The dealer gamma estimate is positive both for the chain as a whole and for the September 18 expiration specifically — under this estimate, market-maker hedging tends to dampen moves rather than amplify them, which fits a stock that has spent the last several sessions chopping in a range after a sharp advance. Treat it as an estimate built on an assumed hedging convention, not observed dealer inventory. The flip level is estimated near $390, and spot is sitting unusually far above it for this name, so the fragile side of that regime is nowhere near this week's map.
Three live flow items stood out on Friday, all at the target expiration:
- September 18 $530 calls — 6,449 contracts traded against 7,442 open, about $5.2 million of premium. This was the largest single-contract dollar flow at the September 18 expiration, and it sits right on the expiration's heaviest overhead OI.
- September 18 $540 calls — a brand-new strike that built 5,414 contracts of open interest on 2,997 of volume. Traders paying up for a strike almost 5% out of the money in a seven-day window.
- September 18 $517.50 puts — 747 contracts traded against just 11 open. Small in dollars, but a turnover ratio near 68× is fresh at-the-money hedging, not a roll.
3 · Technical check
Both technical reports read bullish, and both land at the same number. The 3-day model (target date September 16) targets $521.50 with a projected range of $503.50–$529.50. The 5-day model (target date September 18) also targets $521.50, with a projected range of $501.00–$531.50. Both cite the same structure: price holding above rising short-term moving averages, ADX at 32.4 with +DI (29.2) well clear of −DI (15.5) — a strong, established uptrend — and a flag-shaped consolidation after the run from roughly $459 to $540.
Both also flag the same caution: the MACD line has crossed below its signal and RSI has cooled from ~75 to 59.6 while price held near its highs, a mild momentum divergence. The 5-day report's dominant scenario (45%) is continuation on a sustained close above $521 toward $530–$534; its invalidation is a close below $505. That is where our kill switch comes from.
Classification: Confirms. The technical direction matches the options lean, and the $521.50 target sits comfortably inside the options-implied range. What the two disagree about is magnitude, not direction.
Model vs. Market: The options market implies $481.91–$550.35 into September 18; the 5-day technical model targets $521.50 within a $501.00–$531.50 band. The chart model expects roughly half the travel the options are charging for — which is another way of saying the options market is not obviously overcharging for a stock that just moved 13% in a week.
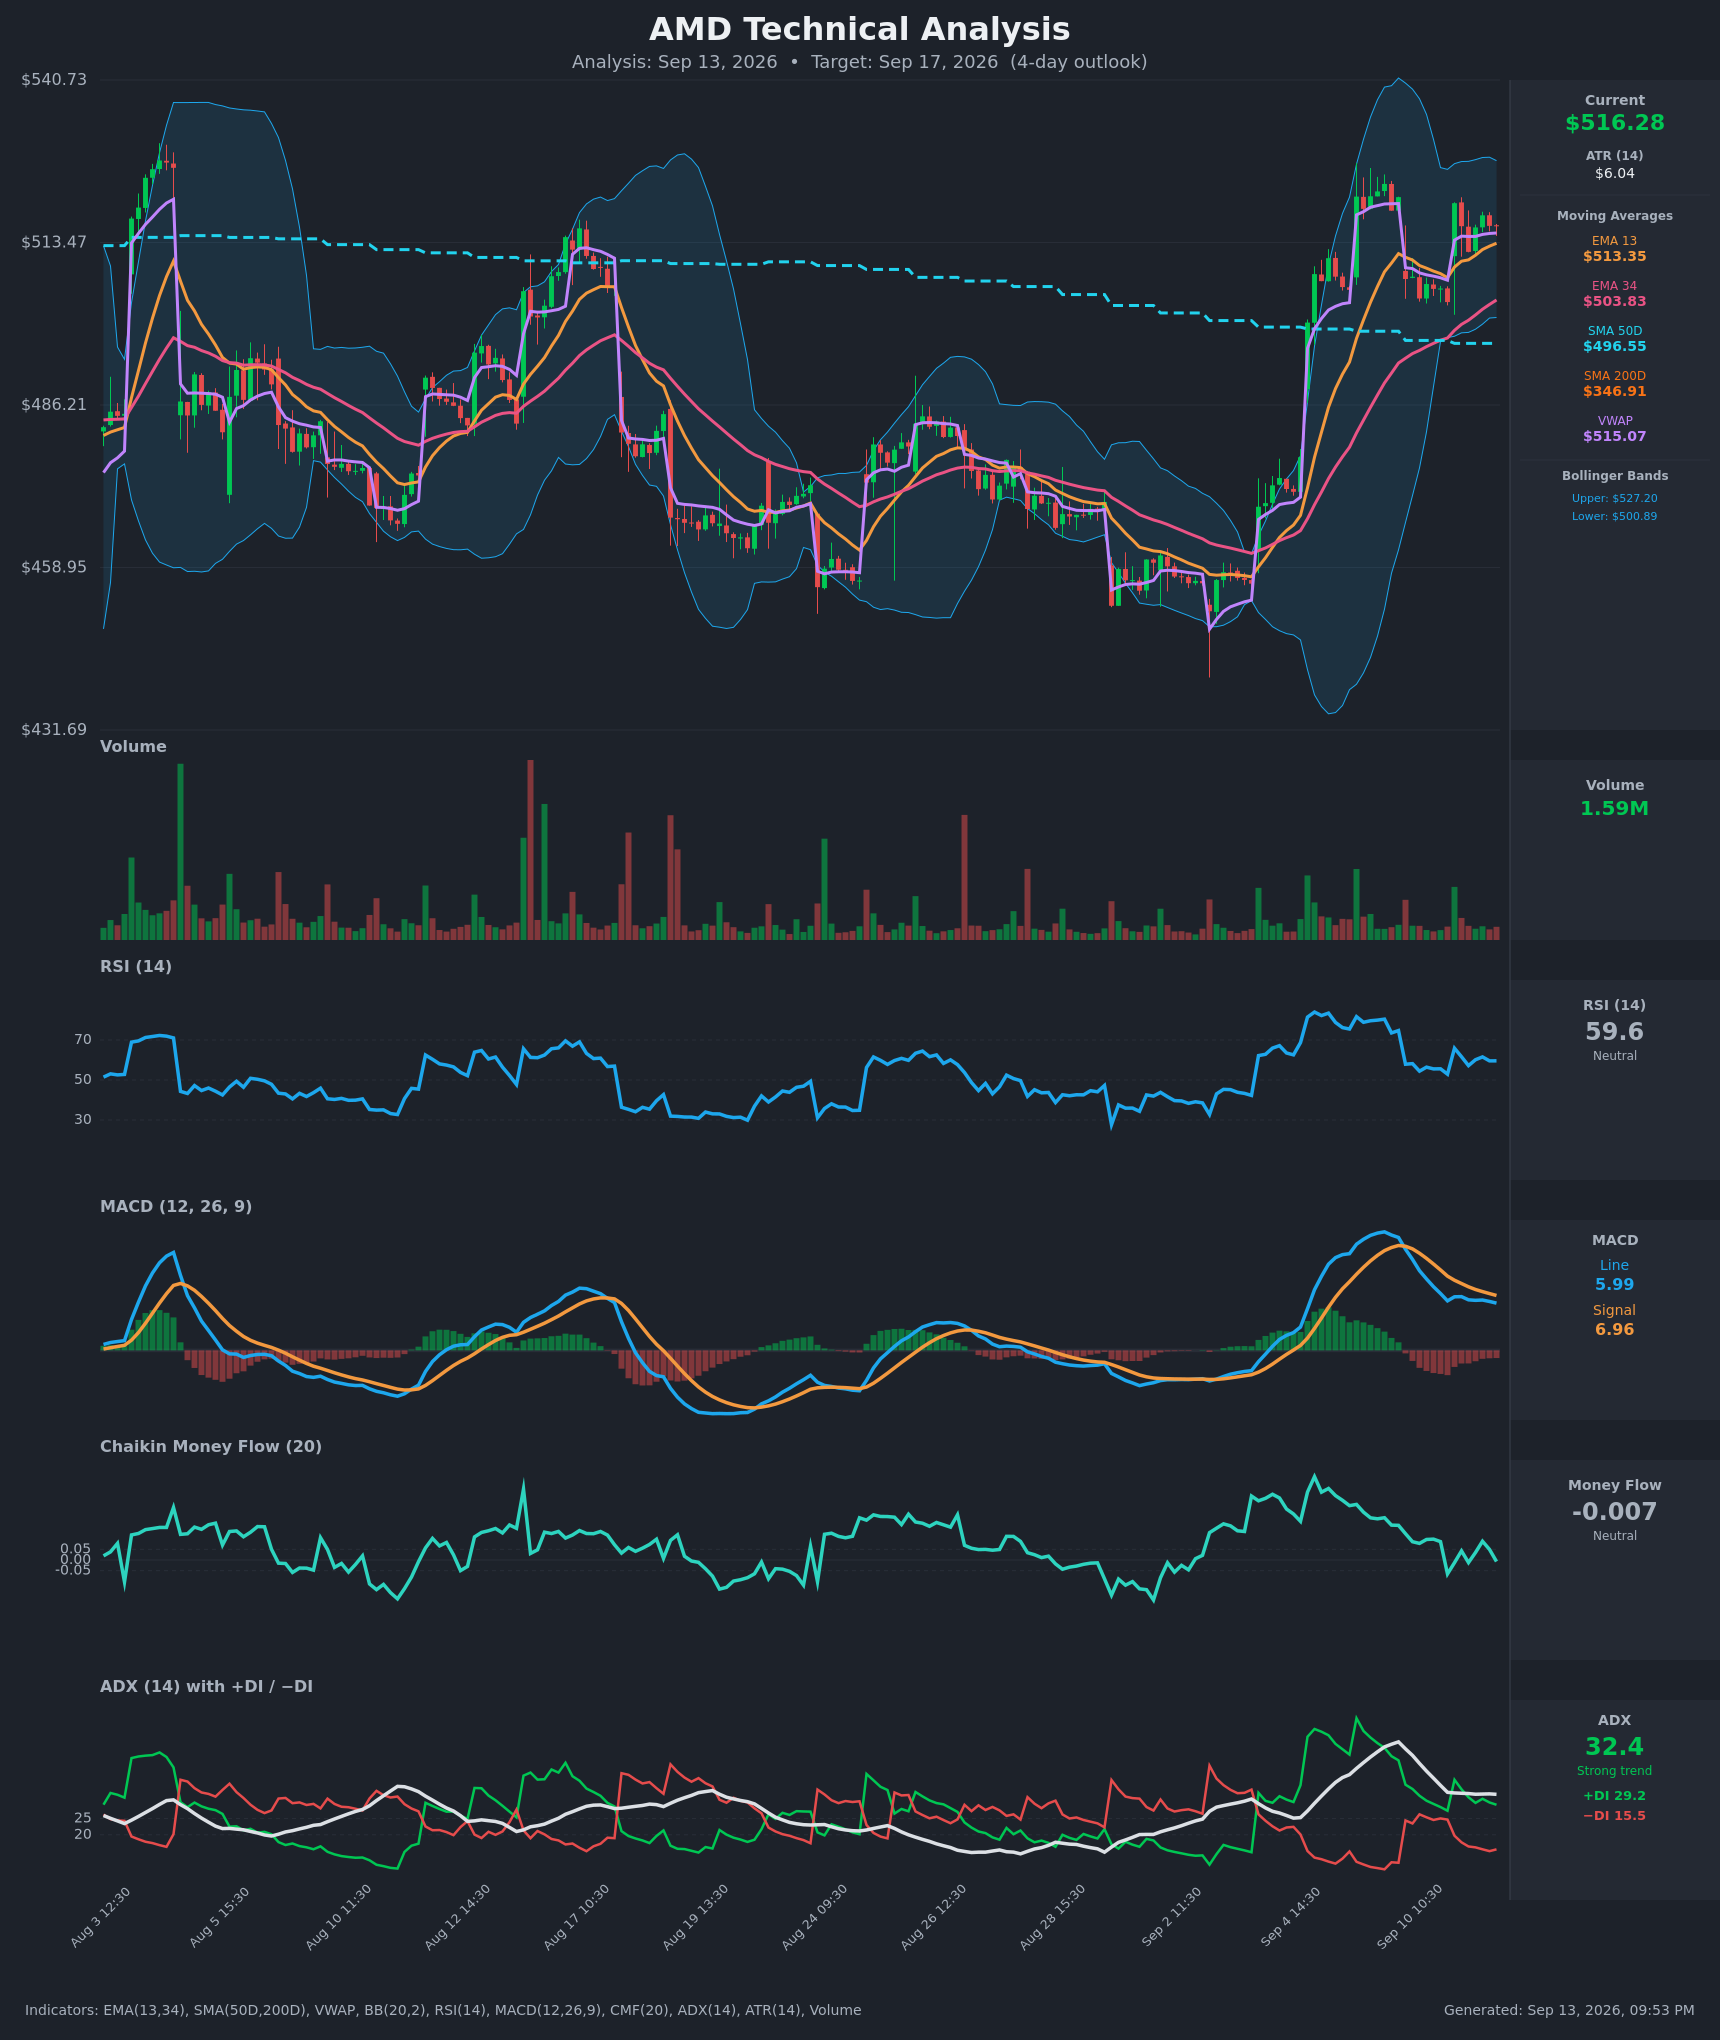
The TA nudged strike selection in one place: the short call of the bullish spread below sits at $530, which is both the technical continuation target zone and the expiration's heaviest overhead open interest.
Full technical write-ups: 3-day report → · 5-day report →
4 · Three ways the next five days can go
If AMD pushes above $520 and then $530: $520 is the heaviest call strike in the entire chain (22,756 contracts) and the largest gamma strike; $530 carries the biggest overhead pile for September 18 specifically. Heavy call open interest overhead has historically acted like a speed bump — dealers hedging those positions tend to sell into strength. Above $530, positioning thins quickly: $540 and $545 have far smaller blocks, and the implied upper rail is $550.35.
If AMD drifts between $500 and $530: this is the path the expiring open interest favors. Max pain for September 18 is $492.50, meaningfully below spot, and the dealer gamma estimate is positive — hedging that dampens moves is the mechanical backdrop for a range. The pull toward $500–$505 is where those two forces meet the 50-day average at $496.55 and swing support at $494.87.
If AMD breaks below $505: the September 18 call wall at $500 becomes the first real test, with the 50-day average ($496.55), swing support ($494.87) and max pain ($492.50) stacked immediately beneath it. That trio is a dense zone; below it the map opens toward the 20-day average at $482.04 and the implied lower rail at $481.91, with the put wall a long way down at $450. Spot is sitting unusually far above the gamma flip estimate (~$390) for this stock, so nothing in the positioning data suggests the accelerate-the-selling regime is close.
5 · Three defined-risk structures
Prices are end-of-day midpoints as of 2026-09-11. All structures are hypothetical. Verify live prices before trading — these will be stale by the open.
If you lean bullish: September 18 $515/$530 call debit spread
- Trade: Buy the September 18 $515 call ($14.38), sell the September 18 $530 call ($8.08). A debit spread: you pay up front and are betting the stock finishes above your break-even.
- Debit: $6.30 · Max profit: $870 · Max loss: $630 · Break-even: $521.30
- Why it fits: This is the structure the volatility picture argues for. With IV rank at 16/100 and options priced about 3 vol points below AMD's delivered movement, you are buying cheap optionality rather than selling thin premium. The break-even at $521.30 sits essentially on both technical models' $521.50 target, and the short strike at $530 is the expiration's heaviest overhead open interest — the level positioning says is hardest to clear.
- Makes sense only if: you believe the bull-flag consolidation resolves upward inside seven days. A flat tape costs you the full debit.
- Invalidated if: AMD closes below $505.00.
- Managing it: because the week's flow is running ahead of a flat ~50-day trend, take profits early rather than holding for max value — closing at roughly 60–70% of max on any move into $528–$530 is the realistic exit. Cut at half the debit if AMD closes below $505.
- Liquidity note: the $515 calls traded 65¢ wide and the $530 calls 35¢ wide, and both were among the expiration's biggest dollar-premium contracts ($3.2M and $5.2M). Fills should be easy at or near the mid.
- Analyze this position →
If you expect the range to hold: September 18 $485/$490/$540/$545 iron condor
- Trade: Sell the $490 put ($4.33) / buy the $485 put ($3.43); sell the $540 call ($5.25) / buy the $545 call ($4.15), all September 18. You collect a credit and keep it if AMD finishes between the short strikes.
- Credit: $2.00 · Max profit: $200 · Max loss: $300 · Break-evens: $488.00 and $547.00
- Why it fits: the profitable band sits just inside the implied $481.91–$550.35 range, with the short call above the $530 pile-up and the short put below max pain, the 20-day average and swing support. The positive dealer gamma estimate is the mechanical argument for a range holding.
- Health warning: you are selling premium that hasn't been rich lately. At IV rank 16 and a negative gap versus delivered movement, this is the structure the volatility data argues against — size it small or skip it, and do not stack multiples.
- Makes sense only if: you think the 13% five-day move has exhausted itself and the consolidation continues.
- Invalidated if: AMD closes above $532 or below $492.50 — either close puts a short strike within reach with days to run.
- Managing it: close at ~50% of max credit, and exit the whole structure by September 17 regardless rather than carrying expiration-day gamma risk.
- Liquidity note: the $490 and $485 puts each traded 25¢ wide and the $540/$545 calls 40¢ and 30¢ wide — 6–8% of mid on the wings. Work the order as a package with a limit; do not leg in at market.
- Analyze this position →
If you lean bearish: September 18 $510/$495 put debit spread
- Trade: Buy the September 18 $510 put ($10.70), sell the September 18 $495 put ($5.50).
- Debit: $5.20 · Max profit: $980 · Max loss: $520 · Break-even: $504.80
- Why it fits: this is the max-pain trade. Expiring open interest for September 18 clusters below spot, with max pain at $492.50 — the spread reaches full value at $495 or lower. The skew story supports it too: 25-delta puts have gone from 0.5 vol points cheaper than calls to 0.4 points richer, a genuine shift toward paying up for downside protection. And you're buying it in a 16 IV-rank tape, not paying a fear premium.
- Makes sense only if: you read the MACD crossover and RSI divergence as the start of a retest of the $497–$505 moving-average confluence, which is the 5-day model's own 35% scenario.
- Invalidated if: AMD closes above $521.50 — the level both technical models target and the trigger for the continuation scenario.
- Managing it: take profit at $492.50–$495 rather than waiting for expiration; positive dealer gamma tends to slow the last leg of a move toward a pin.
- Liquidity note: the $510 puts traded 50¢ wide and the $495 puts 30¢ wide — both under 6% of mid, fine for a two-leg fill.
- Analyze this position →
If none of these: no trade
There is an honest case for standing aside. The composite read here is genuinely mild — call-side flow and the short-dated sentiment read pull one way, steepening put skew and a wall structure that leaves spot above the expiration's own call wall pull the other — and a seven-day window after a 13% run is where whipsaw lives. Selling premium is the weakest of the available choices: with implied volatility below what AMD has actually delivered, the condor above is collecting $200 against $300 of risk in a stock that moved more than $57 in five sessions. If you don't have conviction about direction, the better version of "trade the range" is to wait for the $505 or $530 boundary to be tested and trade the reaction, rather than pay to sit inside a band that has already proven it can be crossed in two sessions.
6 · Quick FAQ
What is AMD's expected move this week? ±$34.22 (±6.63%) into the September 18 expiration, implying a $481.91–$550.35 range, per the options market's straddle pricing as of the September 11 close.
Is AMD expected to go up or down over the next five days? Options positioning as of September 11 leans neutral with a bullish tilt — call-side flow and open-interest building are well above this stock's own norm, offset by steepening put skew and expiring open interest that sits below spot. That's a read of what traders have done, not a forecast. The actionable map is the $481.91–$550.35 range and the $505/$530 levels.
Are AMD options expensive right now? IV rank 16/100 says option prices are lower than roughly 84% of the past year's readings; on top of that, they're running about 3 vol points below the movement AMD has actually delivered over the past month — though that gap is still richer than about two-thirds of this stock's own recent readings. Net: this is a week to buy optionality rather than sell it.
Where is AMD's biggest options support and resistance? For the September 18 expiration, the put wall is $450.00 (6,355 contracts) and the call wall is $500.00 (9,651 contracts) — the latter already below spot, which makes $530 (7,442 contracts) the practical ceiling for the week, and $520 the heaviest call strike across the whole chain.
What invalidates this week's read? A close below $505.00.
Methodology & disclosures. Data: end-of-day options-chain snapshot for AMD, 2026-09-11, generated 2026-09-13T21:53:21.077Z. Prices shown are midpoints and will differ from live markets. Momentum/positioning scores and volatility-premium comparisons are descriptive measurements of past option flow and past price movement — not investment advice, signals, forecasts, or guarantees. All trade structures are hypothetical. Every structure shown has a defined maximum loss; you can lose the entire max-loss amount. Options involve substantial risk and are not suitable for all investors.