AMD Options Price a ±$36.56 Move Into September 25 — and a Call Wall Sitting at $570
The options market implies a $523.26–$596.38 range for AMD into the September 25 expiration, with the heaviest call open interest parked at $570 and max pain down at $535. Here's what the positioning says, where the levels sit, and three defined-risk ways to trade it.
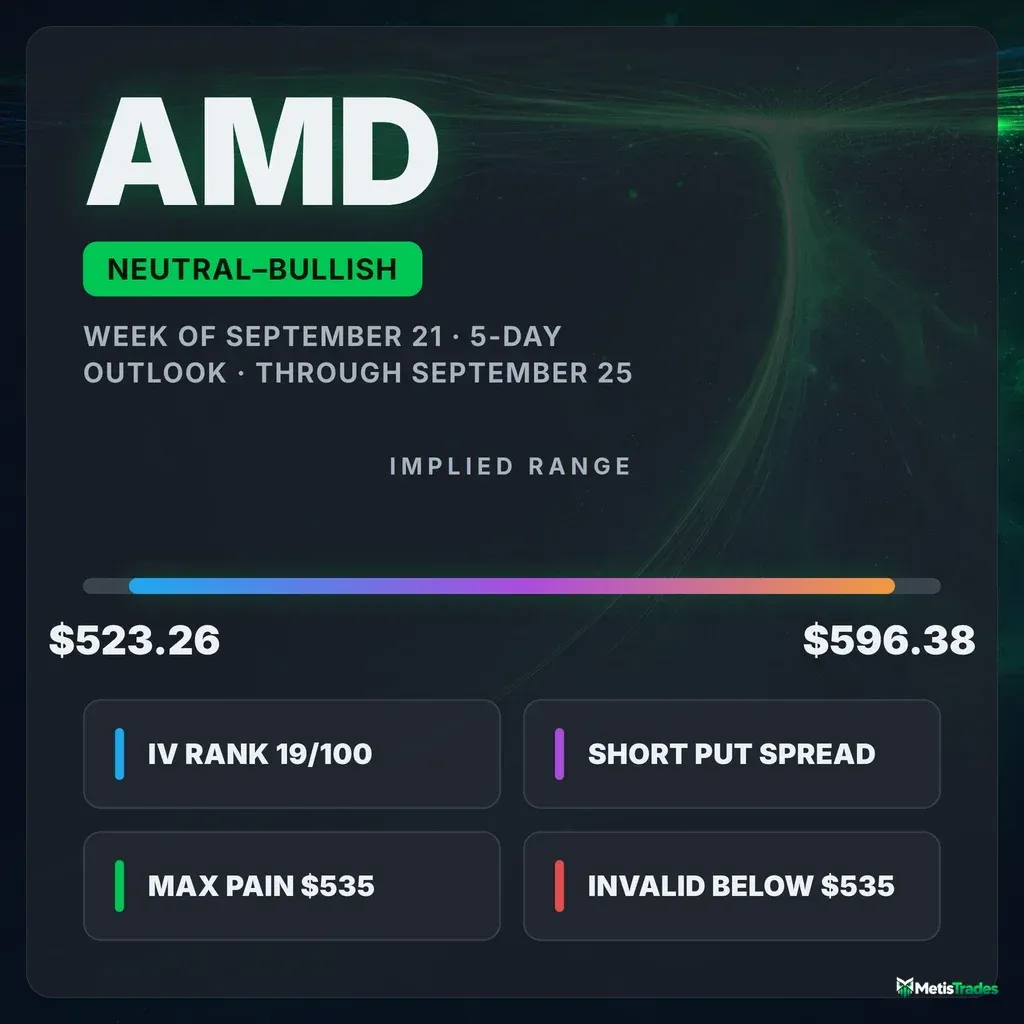
The options market implies a $523.26–$596.38 range into the September 25 expiration; here's what's driving it and three defined-risk ways to trade it.
Published Sunday, September 20, 2026 · Data as of Friday, September 18, 2026 close
Explore the live AMD options data in the Detailed Options Analyzer →
Quick answer
| Item | Answer |
|---|---|
| Market bias | Slightly bullish |
| Options-implied range (into September 25) | $523.26 – $596.38 (±6.53%) |
| Major support | $425.00 (September 25 put wall — far below spot); nearest structural support $546.44 |
| Major resistance | $570.00 (September 25 call wall) |
| Max pain (September 25) | $535.00 |
| Dealer gamma regime (estimate) | Positive — hedging tends to dampen moves; flip level ≈ $400 |
| Volatility condition | Falling over the past month — IV rank 18.6/100 · premium modestly rich: options priced ~1 vol point above delivered movement |
| Technical check | Confirms (bullish, 3-day and 5-day) |
| Best-fitting strategy | Short put spread — sell the September 25 $540/$530 put spread |
| Analysis invalidated if | AMD closes below $535 |
1 · What matters today
AMD closed Friday, September 18 at $559.82 after an 8.5% five-day run, and the options chain leans mildly with it. Call activity dominates, puts have been thinning out, and the sentiment read in short-dated contracts is the most bullish it has been in two weeks. That earns a slightly bullish bias — a lean, not a conviction call.
The market is pricing a $36.56 move either way into the September 25 expiration, which frames a $523.26–$596.38 range. Directly overhead sits the strike with the biggest pile of open call contracts for that date, $570 — these often act like a magnet or a ceiling into expiry. Below, max pain (the price where the most option value would expire worthless) sits well away at $535.
Both technical reads confirm the upward lean. A close below $535 kills this thesis.
2 · What the options market is pricing
What changed this week
The underlying did the heavy lifting: AMD is up 8.46% over the past five sessions and 19.25% over the past twenty, closing within 4.3% of its 52-week high at $584.73. Positioning followed. The put/call open-interest ratio — how many put contracts are held open for every call — slid from 0.58 to 0.51 over five days, against a 14-day average of 0.79. In plain terms, traders have been letting downside protection lapse while adding call exposure at a steady clip. Put/call volume on Friday came in at 0.54, well under the 7-day average of 0.65 and the 14-day 0.63, and total option volume ran 1.42× its 20-day norm.
Implied volatility — the market's estimate of how much AMD will move, baked into option prices — ticked up 4.09% over five days but is down 23.56% over thirty, so the medium-term direction is still lower. The single biggest open-interest build on Friday was in contracts that have since settled (the September 18 $530 puts added 3,599 contracts into their final session, and should be read as closed history). Among still-live strikes, the standouts are all calls: the September 25 $570 calls added 2,246 contracts on 5,513 of volume, the September 25 $580 calls sprang from nothing to 2,542 contracts, and the October 16 $600 calls added 2,259. The short- and long-term trend reads agree here — bullish over the past week and the past month, flat over the past two months — so there is no cross-horizon tension to argue about this time.
Expected move
Into September 25, the options market is pricing a move of roughly ±$36.56, or ±6.53% — that figure is the size of the move, derived from what at-the-money straddles cost, not a price. Around Friday's $559.82 close that maps to $523.26 to $596.38.
| Expiration | Implied move | Range around $559.82 |
|---|---|---|
| September 23 | ±5.26% | $530.37 – $589.27 |
| September 25 | ±6.53% | $523.26 – $596.38 |
| October 2 | ±9.73% | $505.35 – $614.29 |
| October 16 | ±14.01% | $481.39 – $638.25 |
The ladder steps up smoothly with time rather than humping at any single rung — there is no event bulge hiding in the near-dated chain. (The September 21 rung is skipped: call- and put-side quotes disagreed too much for that expiration to be priced reliably.)
Volatility
At-the-money implied volatility sits at 50.85%, with an IV rank of 18.6/100 — today's IV is cheaper than roughly 81% of the past year's readings. It is below both its 30-day average (52.7%) and its 90-day average (68.0%), and down 23.56% over the past month, so the longer arc is one of steady compression even after Friday's 1.27% single-day dip and a 4.09% five-day uptick. The front-month read is unavailable today because the nearest expiration was the same-day one, so the usual comparison of option prices across expiration dates can't be computed; that returns on the next trading day.
Two readings stand out against AMD's own recent history. Twenty-day realized volatility — how much the stock has actually moved — is 49.90%, which is unusually low for this name despite the headline number looking large. At the same time, the ratio of five-day to twenty-day realized movement is 1.23 and running well above its norm: the stock's day-to-day movement has accelerated sharply in the last week relative to the month behind it.
Premium rich or cheap. The volatility risk premium — the gap between how much movement options are priced for and how much AMD has actually delivered — is currently about +1 vol point. When that gap is positive, option sellers have been collecting more than realized movement cost them. At the 74th percentile versus this stock's own recent readings, today's gap is richer than about three-quarters of them, even though it's small in absolute terms. Over the past week the gap has chopped between roughly −3 and +3.6 vol points and has been positive on four of the last five sessions, so there is no clean trend, just a mild persistent tilt toward sellers. The combination — an IV rank of 18.6 and a 74th-percentile premium over delivered movement — argues for collecting premium rather than owning it, but the cushion is a single vol point, not a fat one: size accordingly and don't treat it as an edge that forgives bad strike selection.
Skew and sentiment
Normally puts and calls the same distance from the stock price don't cost the same, and puts are usually pricier because traders pay up for crash protection. AMD has flipped that. The 25-delta skew reads −2.3 vol points — 25-delta calls (51.86% implied) cost more than equidistant puts (49.55%) — against a 60-day median of just −0.3 vol points. That is roughly 2 vol points more call-rich than this stock's own norm. Traders are paying up for upside, not protection.
The flow backs it up. Twenty-six call contracts cleared the unusual-volume bar on Friday versus twelve puts, a call-side skew that is running well above its typical level for this name. Sentiment in short-dated options scores +45 in the 0–7 day bucket and +61 in the 7–30 day bucket, both clearly bullish, while the 30–60 day bucket is flat at +9 and the 60–120 day bucket is marginally negative at −4 — a mixed picture overall where the near end carries all the conviction. Averaged over the past seven sessions those front buckets score +13 and +20, so Friday's reading is a meaningful step up, not a continuation.
The key levels map
| Level | Price | Why it matters |
|---|---|---|
| 52-week high | $584.73 | The ceiling of the past year; spot sits 4.26% below it |
| Heavy call strike (chain-wide) | $580.00 | 15,389 call contracts open across all expirations; also the September 23 call wall |
| Swing resistance | $574.20 | Recent pivot cluster from price structure |
| Call wall (September 25) | $570.00 | 4,057 call contracts — the heaviest call strike for the target expiration, and the level most likely to cap this window |
| Swing resistance | $560.94 | Nearest overhead pivot, roughly at spot |
| Spot | $559.82 | Friday, September 18 close |
| Heaviest call strike (whole chain) / largest gamma strike | $550.00 | 25,427 calls open across all expirations and the single biggest gamma concentration — a genuine magnet on pullbacks |
| Swing support | $546.44 | Nearest structural support beneath spot |
| Second-largest gamma strike | $540.00 | Dense option positioning; the September 21 and September 23 max-pain strike |
| Max pain (September 25) | $535.00 | Where the most option value would expire worthless for the target date |
| Swing support | $528.04 | Prior breakout base |
| 50-day moving average | $495.85 | Spot sits 12.9% above it — the trend is stretched |
| 20-day moving average | $490.75 | Spot sits 14.07% above it |
| Heaviest put strike (whole chain) | $450.00 | 16,773 puts open across all expirations — the chain's real downside anchor |
| Put wall (September 25) | $425.00 | The target expiration's heaviest put strike, 2,022 contracts — so far below spot it offers no practical support this week |
| Gamma flip estimate | ≈ $400 | One rough estimate of where market-maker hedging would start amplifying selling instead of cushioning it |
Note the disagreement worth naming: the whole chain's heaviest call strike is $550, but the September 25 expiration's own call wall is $570. For this week's map, $570 is the one that matters; $550 is a legacy pile built up across longer-dated contracts. Same story on the put side — $450 chain-wide versus $425 for September 25 — and neither is close enough to act as a floor in a five-day window.
Positioning and unusual flow
Under the standard assumption about how dealers are positioned, the estimated gamma regime is positive both across the whole chain and for the September 25 expiration specifically — meaning market-maker hedging in this zone tends to dampen moves rather than amplify them, nudging price back toward the heavy strikes. Treat that as an estimate built on an assumed convention, not as observed dealer inventory.
Three live flow items stand out. The September 25 $570 calls traded 5,513 contracts and added 2,246 of open interest — buyers paying directly at the call wall, roughly $5.79 million of premium changing hands. The September 25 $580 calls appeared from a standing start with 2,542 contracts of open interest, extending the reach above the wall. On the other side, the September 21 $560 puts printed 1,289 contracts against just 28 held open — a 46× turnover that is pure short-dated hedging or speculation, not a position anyone is carrying. The single largest premium print of the day among still-live contracts was the September 25 $545 calls at roughly $12.0 million.
3 · Technical check
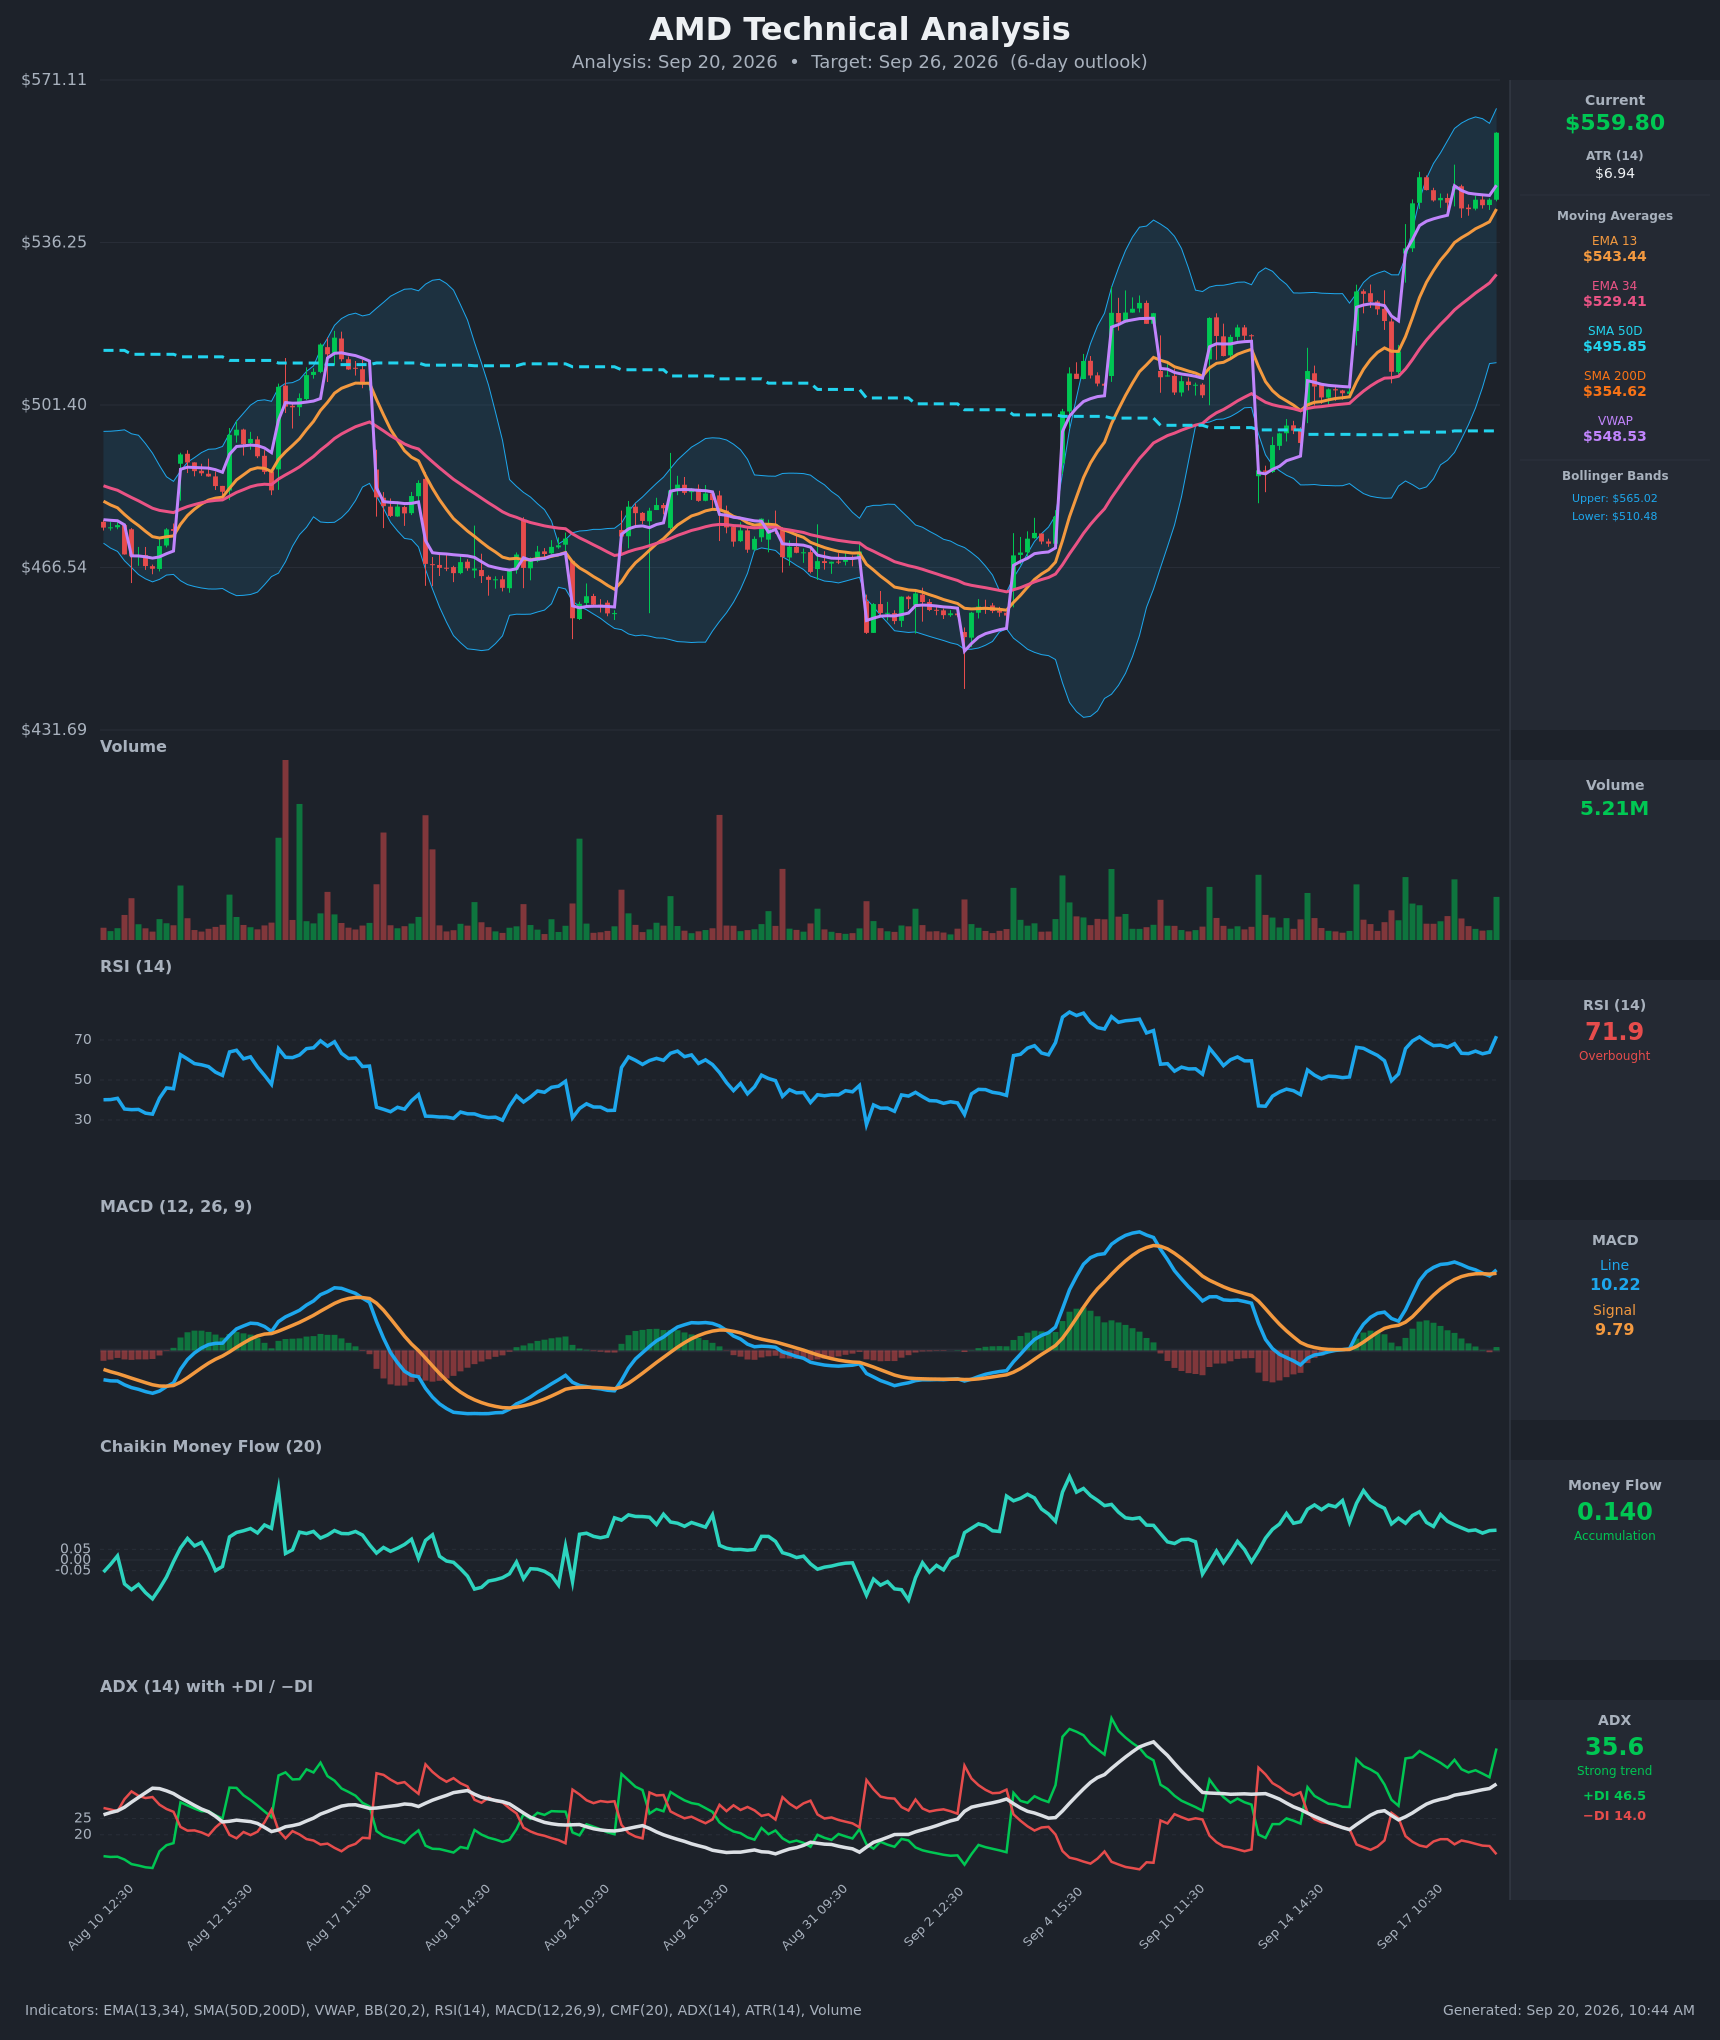
Both chart reads are bullish and both sit inside what the options market is pricing, which is the cleanest kind of confirmation. The 3-day model targets $567.00 by September 23 with a projected range of $543.00–$573.00; the options-implied range for that same date is $530.37–$589.27, so the chart model is calling for a narrower, upward-drifting path inside the market's brackets. The 5-day model targets $571.00 by September 25 with a projected range of $543.00–$579.00, again comfortably inside the $523.26–$596.38 the options are pricing.
The supporting reads are consistent: a trend-strength indicator at 35.6 and rising with upside direction firmly dominant, and money-flow at +0.140 showing sustained accumulation. The caution is equally clear — RSI at 71.9 with price pressing the upper volatility band is a stretched condition that often produces a pause. Both reports flag $543 (the short-term moving average) as the level whose loss would break the near-term structure, and $565 as the band the stock must clear to extend.
Model vs. Market: The options market implies $523.26–$596.38 into September 25; the 5-day technical model targets $571.00. That target sits $1 above the $570 call wall — the chart wants exactly the level where the heaviest call open interest for this expiration is parked, which is precisely where that kind of rally tends to stall.
Practically, the technical confirmation did one thing to the structures below: it kept the short call strikes at or above $570 rather than shading them down into the expected move.
Full technical write-ups: 3-day report → · 5-day report →
4 · Three ways the next five days can go
If AMD pushes above the call wall ($570): the heaviest call open interest for September 25 sits right there, and rallies into that kind of concentration usually slow before they accelerate. A clean break leaves thinner positioning until the $580 pile and the 52-week high at $584.73, which is also where the 5-day chart model's upper projection ($579.00) runs out.
If AMD drifts between the levels: this is the base case the positioning describes. With the estimated gamma regime positive for this expiration, hedging flows tend to pull price toward the dense strikes rather than push it away — and $550 is the biggest gamma concentration on the board, with $540 next. Max pain for September 25 sits at $535, well below spot, so any drift-lower pressure into expiry has a long way to travel before it becomes the story.
If AMD breaks below $546.44: the swing-support cluster gives way and the $535 max-pain strike becomes the obvious gravity point, with $528.04 behind it. The comfort here is that spot sits roughly 28.5% above the estimated gamma flip level — unusually far above it for this name — so the mechanism where market-maker hedging amplifies selling is nowhere near in play this week. A break lower would be ordinary profit-taking in a stretched trend, not a positioning cascade. The September 25 put wall at $425 is too distant to matter.
5 · Three defined-risk structures
Prices are end-of-day midpoints as of 2026-09-18. All structures are hypothetical. Verify live prices before trading — these will be stale by the open.
If you lean bullish: short put spread
- Trade: Sell the September 25 $540 / $530 put credit spread (sell the $540 put, buy the $530 put). You collect premium up front and keep it if AMD stays above the short strike.
- Credit: $2.50 · Max profit: $250 per spread · Max loss: $750 · Break-even: $537.50
- Why it fits: The short strike sits below the $546.44 swing support and just above the $535 max-pain strike, in the zone where the second-largest gamma concentration ($540) tends to slow declines. It also lines up with the premium read: at a 74th-percentile gap over delivered movement, selling is modestly favoured even with IV rank at 18.6.
- Makes sense only if: you accept that the bullish lean rests on flow and skew, not on the stock being cheap — this is a bet on the $535–$546 shelf holding for five sessions, not on a breakout.
- Invalidated if: AMD closes below $535.
- Managing it: close at roughly 50% of max credit; with the short-term trend stretched 12.9% above its 50-day average, take profits early rather than holding for the last few cents. Use the September 23 checkpoint as a hard review date, and if AMD closes through $540, close rather than hope.
- Liquidity note: the $540 puts quoted $6.80/$7.05 and the $530 puts $4.30/$4.55 — each 25¢ wide, about 3.6% and 5.6% of mid. Work the spread as a package.
- Analyze this position →
If you expect the range to hold: iron condor
- Trade: Sell the September 25 $535 / $530 put spread and the September 25 $585 / $590 call spread. Four legs, one net credit, and you keep it all if AMD finishes between $535 and $585.
- Credit: $2.20 · Max profit: $220 · Max loss: $280 · Break-evens: $532.80 and $587.20
- Why it fits: Both break-evens sit inside the $523.26–$596.38 implied range, and the short strikes bracket both chart models' projected paths ($543–$573 and $543–$579). You are collecting 44% of the wing width, which is generous for a five-day condor and reflects that 74th-percentile premium over delivered movement.
- Makes sense only if: you genuinely expect the stretched move to pause rather than extend. RSI near 72 supports the pause case; the call-side flow into $570 and $580 argues against it.
- Invalidated if: AMD closes below $535 or above $585.
- Managing it: close at roughly 50% of max credit, or close the untested side once one wing loses most of its value. Exit the whole package by September 24 rather than carrying gamma risk into the final session.
- Liquidity note: the four legs quoted 25–35¢ wide (roughly 5.4%, 5.6%, 6.0% and 6.3% of their mids) — wider than ideal. Enter as a single limit order on the full package; legging in will leak a meaningful share of the $2.20 credit.
- Analyze this position →
If you lean bearish: short call spread at the wall
- Trade: Sell the September 25 $570 / $580 call credit spread. You collect premium and keep it if AMD finishes below $570.
- Credit: $3.30 · Max profit: $330 · Max loss: $670 · Break-even: $573.30
- Why it fits: The short strike sits exactly at the September 25 call wall, the single heaviest call strike for this expiration at 4,057 contracts — the level where rallies most often stall into expiry. It is the honest counter-trade to this article's lean: if you think the 8.5% five-day run is exhausted, this gets paid for that view with defined risk.
- Makes sense only if: you are willing to fade an intact uptrend. Note that the 5-day chart model targets $571.00 — one dollar above your short strike — and Friday's biggest live flow was buyers at this exact strike.
- Invalidated if: AMD closes above $570.
- Managing it: close at roughly 50% of max credit; because this fights the prevailing direction, take profit faster than you would on the put side and cut on the first daily close above $570 rather than waiting for the break-even.
- Liquidity note: the $570 calls quoted $10.30/$10.70 and the $580 calls $7.05/$7.35 — 40¢ and 30¢ wide, about 3.8% and 4.2% of mid. The tightest of the three structures.
- Analyze this position →
If none of these: no trade
There is a real case for standing aside even though premium is technically rich. The richness is one vol point — a 74th-percentile reading for this stock, but on an absolute basis a thin edge — and IV rank at 18.6 means you are selling options that are cheap by the standards of the past year. Layer on the execution cost: three of the four condor legs quote 5–6% wide, which can eat a quarter of the theoretical credit before the trade even breathes. And the underlying is 12.9% above its 50-day average with a momentum indicator near 72 after an 8.5% five-day run — a setup where a sharp two-day mean reversion or a sharp two-day extension are both entirely ordinary, and either one runs through a short strike. If you don't have a view on which of those happens, the honest answer is that a one-vol-point premium doesn't pay you enough to find out.
6 · Quick FAQ
What is AMD's expected move this week? ±$36.56 (±6.53%) into the September 25 expiration, which frames a $523.26–$596.38 range around Friday's $559.82 close, per the options market's straddle pricing as of September 18.
Is AMD expected to go up or down over the next five days? Options positioning as of September 18 leans slightly bullish — call-rich skew, thinning put open interest, and bullish sentiment in short-dated contracts — but that's a read of what traders have already done, not a forecast. The actionable map is the $523.26–$596.38 range and the $546.44 support / $570 resistance pair.
Are AMD options expensive right now? IV rank of 18.6/100 says option prices are lower than about 81% of the past year's readings; on top of that, they're running about 1 vol point above the movement AMD has actually delivered — richer than roughly 74% of this stock's own recent readings. The verdict: mildly favours selling premium, but the edge is thin enough that strike selection and execution matter more than the premium itself.
Where is AMD's biggest options support and resistance? For the September 25 expiration, the call wall is $570.00 and the put wall is $425.00 — but that put wall is so far below spot that the practical downside markers are the $546.44 swing support and the $535 max-pain strike.
What invalidates this week's read? A close below $535.
Methodology & disclosures. Data: end-of-day options-chain snapshot for AMD, 2026-09-18, generated 2026-09-20T10:44:52.643Z. Prices shown are midpoints and will differ from live markets. Momentum/positioning scores and volatility-premium comparisons are descriptive measurements of past option flow and past price movement — not investment advice, signals, forecasts, or guarantees. All trade structures are hypothetical. Every structure shown has a defined maximum loss; you can lose the entire max-loss amount. Options involve substantial risk and are not suitable for all investors.