AMZN Options Outlook: Will the $260 Call Wall Hold Through September 21?
Amazon's options market is pricing a $245.69–$267.71 range into the September 21 expiration, with the heaviest call open interest parked at $260 and max pain at $255. Here's what the positioning says and three defined-risk ways to trade a market that is genuinely undecided.

The options market implies a $245.69–$267.71 range into the September 21 expiration; here's what's driving it and three defined-risk ways to trade it.
Published Sunday, September 13, 2026 · Data as of Friday, September 11 close
Explore the live AMZN options data in the Detailed Options Analyzer →
Quick answer
| Item | Answer |
|---|---|
| Market bias | Neutral |
| Options-implied range (into September 21) | $245.69 – $267.71 (±4.29%) |
| Major support | $240.00 (put wall, September 21 expiration) |
| Major resistance | $260.00 (call wall, September 21 expiration) |
| Max pain (September 21) | $255.00 |
| Dealer gamma regime (estimate) | Positive — hedging tends to dampen moves; flip level ≈ $260 |
| Volatility condition | Neutral-to-falling — IV rank 18.9/100 · premium fair: options priced ~3.4 vol points above delivered movement |
| Technical check | Mixed (bullish, 4-day and 7-day chart models) |
| Best-fitting strategy | Iron condor, if you want the range to do the work |
| Analysis invalidated if | AMZN closes above $260 |
1 · What matters today
Amazon closed Friday, September 11 at $256.78 after a two-session bounce off the $251 area, and the options market is pricing a move of about $11.01 either way — roughly $245.69 to $267.71 — through the September 21 expiration. That number comes from what straddles cost: it is the market's own estimate of how far the stock travels, not a direction.
And direction is exactly what the positioning refuses to give. Short-dated sentiment leans call-side, skew is flatter than normal, and fresh call open interest piled in on Friday — but price momentum is still slightly negative and put-side sweeps outnumbered call-side ones. Our composite read lands squarely in the neutral band. The level that settles the argument is $260: the heaviest call open interest for this expiration sits there, and it is also where one rough estimate places the dealer-hedging pivot. The chart models lean mildly bullish, targeting $260.75 — right into that wall.
2 · What the options market is pricing
What changed this week
The tape went nowhere and the flow quietly rotated. AMZN is down 0.78% over the last five sessions and down 3.20% over twenty, yet Friday's session added far more call positioning than put: call open interest grew by 57,703 contracts day over day while put open interest fell by 15,048. That is the single loudest data point in the file, and by the export's own "vs its own norm" reading — today's figure measured against this stock's recent history — the pace of net new call positioning was unusually heavy for AMZN.
Volatility barely moved: at-the-money implied volatility finished at 29.47%, up 1.5% over five days but down 44.5% over thirty, and sitting under both its 30-day average (30.43%) and its 90-day average (33.57%). Put/call volume came in at 0.46 — for every 100 call contracts traded there were 46 puts — essentially on top of its 7-day average of 0.46 and below its 14-day average of 0.51. Put/call open interest at 0.62 is likewise within a whisker of its two-week norm. Nothing here looks like panic or like a chase.
The biggest open-interest build on a still-tradeable contract was the September 18 $265 calls, up 2,777 contracts to 25,758 on 8,742 traded — buyers reaching for a strike above the wall. Working against that, the October 16 $220 puts added 2,846 contracts, far-downside insurance being restocked. Into Friday's own expiration, the $265 calls shed 5,112 contracts of open interest as they settled worthless — history, not a live magnet.
One more piece of context: the short-, medium- and long-horizon trend reads all come back flat, which is unusual given they describe a stock down 3.2% over the past month but up 6.3% over roughly two and a half. A fresh momentum crossover turned bearish on Friday, but it registered as one of the weakest in the file — a coin landing on its edge, not a turn.
Expected move
Into the September 21 expiration, the options market is pricing ±4.29%, or about ±$11.01 around the $256.70 chain-snapshot price — a range of roughly $245.69 to $267.71. Here is how that scales across the near rungs (the September 11 expiration has already settled and is excluded):
| Expiration | Implied move | Range around $256.70 |
|---|---|---|
| September 14 (3 DTE) | ±1.66% | $252.44 – $260.96 |
| September 18 (7 DTE) | ±3.78% | $247.00 – $266.40 |
| September 21 (10 DTE) | ±4.29% | $245.69 – $267.71 |
| October 16 (35 DTE) | ±9.27% | $232.91 – $280.49 |
The ladder steps up smoothly with time — no kinks, no humps, no single date the chain is bracing for. That smoothness is itself information: the market is pricing ordinary drift, not an event.
Volatility
At-the-money implied volatility — the market's estimate of how much AMZN will move, baked into option prices — is 29.47%, with an IV rank of 18.9/100. That means today's reading is cheaper than about 81% of the past year's readings; the percentile measure agrees, with only about a quarter of the last 52 weeks printing lower. Against its own 7-day average IV rank of 20.4, today is marginally softer still. The front-month term-structure read is unavailable today because Friday was an expiry day and front-month at-the-money volatility can't be interpolated from a same-day-expiring contract — that's a calendar artifact, not missing data. The 60-day tenor is quoted at 36.68%, so the curve still slopes upward.
Underneath, the stock has been quiet. Twenty-day realized volatility — how much AMZN has actually been moving — is 26.09% annualized, an unusually low reading compared against this stock's own recent history. The 5-day-over-20-day pace is 0.82, meaning the last week has been calmer still than the last month.
Premium rich or cheap? The gap between what options are priced for and what the stock has actually delivered — the volatility risk premium — sits at about 3.4 vol points in favor of sellers. That reading is richer than roughly 47% of this stock's own recent readings: dead middle. So the two lenses disagree mildly and cancel out. IV rank says option prices are historically cheap; the premium-over-delivered-movement gap says they are neither generous nor a bargain. That combination favors neither aggressive premium selling nor aggressive premium buying, which is why the structures below are all defined-risk spreads rather than naked bets on volatility in either direction. Over the past week the gap widened from about 3.0 points to 5.7 and then eased back to 3.4 — drift, not a regime change.
Skew and sentiment
Skew — the fact that puts and calls the same distance from the stock price don't cost the same — is unusually flat. Twenty-five-delta puts are priced at 29.70% versus 29.59% for the equivalent calls, a gap of just 0.11 vol points against a 60-day median of 0.31. Traders are paying almost nothing extra for downside protection relative to what they normally pay in this name, which reads as complacency rather than fear.
Sentiment across the curve is more clearly constructive. The 0–7 day bucket scores +29 and the 7–30 day bucket +41 on a −100 to +100 scale, both driven by call-side delta-weighted flow and call open interest building — the file labels the overall state a "Bullish Recovery." That is the strongest single input on the bullish side of the ledger.
The counterweight: among the contracts that cleared the peer-relative unusual-volume bar on Friday, six were puts and five were calls — a put-side tilt that is unusually pronounced for AMZN versus its own recent norm. Sweeps and open-interest builds are pointing in opposite directions, which is the honest reason this article's bias is neutral rather than tilted.
The key levels map
| Level | Price | Why it matters |
|---|---|---|
| 52-week high | $287.20 | 10.6% above spot; the ceiling of the past year |
| Swing resistance | $274.75 | Heuristic pivot cluster from the August decline |
| Top of implied range (Sep 21) | $267.71 | Upper rail of the ±4.29% expected move |
| Swing resistance | $266.98 | Next structural shelf above the wall |
| Swing resistance | $261.12 | Nearest overhead pivot; 7-day chart model resistance $261.50 |
| Call wall (Sep 21) / gamma flip (estimate) | $260.00 | Heaviest call open interest for this expiration, the whole chain's heaviest call strike (88,363 contracts), the largest gamma-by-strike pile, and the estimated hedging pivot — four reasons one level matters |
| 20-day moving average | $258.96 | Price closed 0.84% below it |
| Spot / last close | $256.70 / $256.78 | Chain-snapshot price and official close |
| 100-day moving average | $255.41 | Price 0.54% above |
| 50-day MA / max pain (Sep 21) | $255.25 / $255.00 | The moving-average shelf and the strike where the most option value would expire worthless |
| Swing support | $250.38 | The floor of the early-September base |
| Bottom of implied range (Sep 21) | $245.69 | Lower rail of the ±4.29% expected move |
| Put wall (Sep 21) | $240.00 | Heaviest put open interest for this expiration and for the whole chain (67,673 contracts) |
| 200-day moving average | $239.80 | Price 7.08% above; the long-term trend line |
| Swing supports | $238.25 / $233.59 | Deeper pivot clusters if the base fails |
A caveat worth stating plainly: the September 21 expiration is a light one. Its own call wall ($260, 747 contracts) and put wall ($240, 137 contracts) land on the same strikes as the whole chain's heaviest call and put piles, which is a genuine confirmation — but the September 21 open interest behind them is tiny next to the 88,363 calls and 67,673 puts stacked across all expirations at those strikes. The levels matter because the chain as a whole cares about them, not because this particular expiration does.
Positioning and unusual flow
One rough estimate of dealer positioning labels the overall regime positive — meaning market-maker hedging tends to dampen moves rather than amplify them — while placing the pivot at $260. Spot sits about 1.3% under that pivot, a distance that is about typical for this stock. Read together, the cushioning effect the estimate describes isn't fully engaged until price reclaims $260; below it, the same estimate says hedging flows stop helping.
Two flow items stand out. The September 18 $265 calls traded 8,742 contracts and added 2,777 of open interest — real money reaching above the wall, but in a contract that expires three days before this article's target date. Second, the October 16 $220 puts added 2,846 contracts on 1,664 traded, a downside hedge roughly 14% below spot being rebuilt rather than a bet on the next ten days. Neither is a conviction trade about the September 21 expiration itself.
3 · Technical check
Both chart reports lean bullish, and both hang on the same evidence: a MACD crossover and a +DI/−DI flip that both fired on September 11, RSI recovering from the low 30s to just under 59, and money-flow readings confirming accumulation as price reclaimed the 13/34 EMA and 50-day moving-average cluster near $255.
The 4-day model (target date September 18) projects $259.75 with a range of $252.50 to $263.00, naming support at $254.50 and resistance at $258.00, and invalidating its dominant scenario on a close back below $254.50. The 7-day model (target date September 21) projects $260.75 with a range of $250.50 to $264.00, support at $252.00, resistance at $261.50, and invalidation below $254.00.
Classified against the options read, this is mixed: the direction diverges from a neutral options bias, but the magnitude confirms it. Both targets sit comfortably inside the options-implied range, and the 7-day target of $260.75 lands almost exactly on the $260 call wall — the chart model's best case is the options market's ceiling. That coincidence is why the structures below keep their short call strikes above $260 rather than at it, and why the bullish structure leans on the downside rails rather than chasing a target the wall already caps.
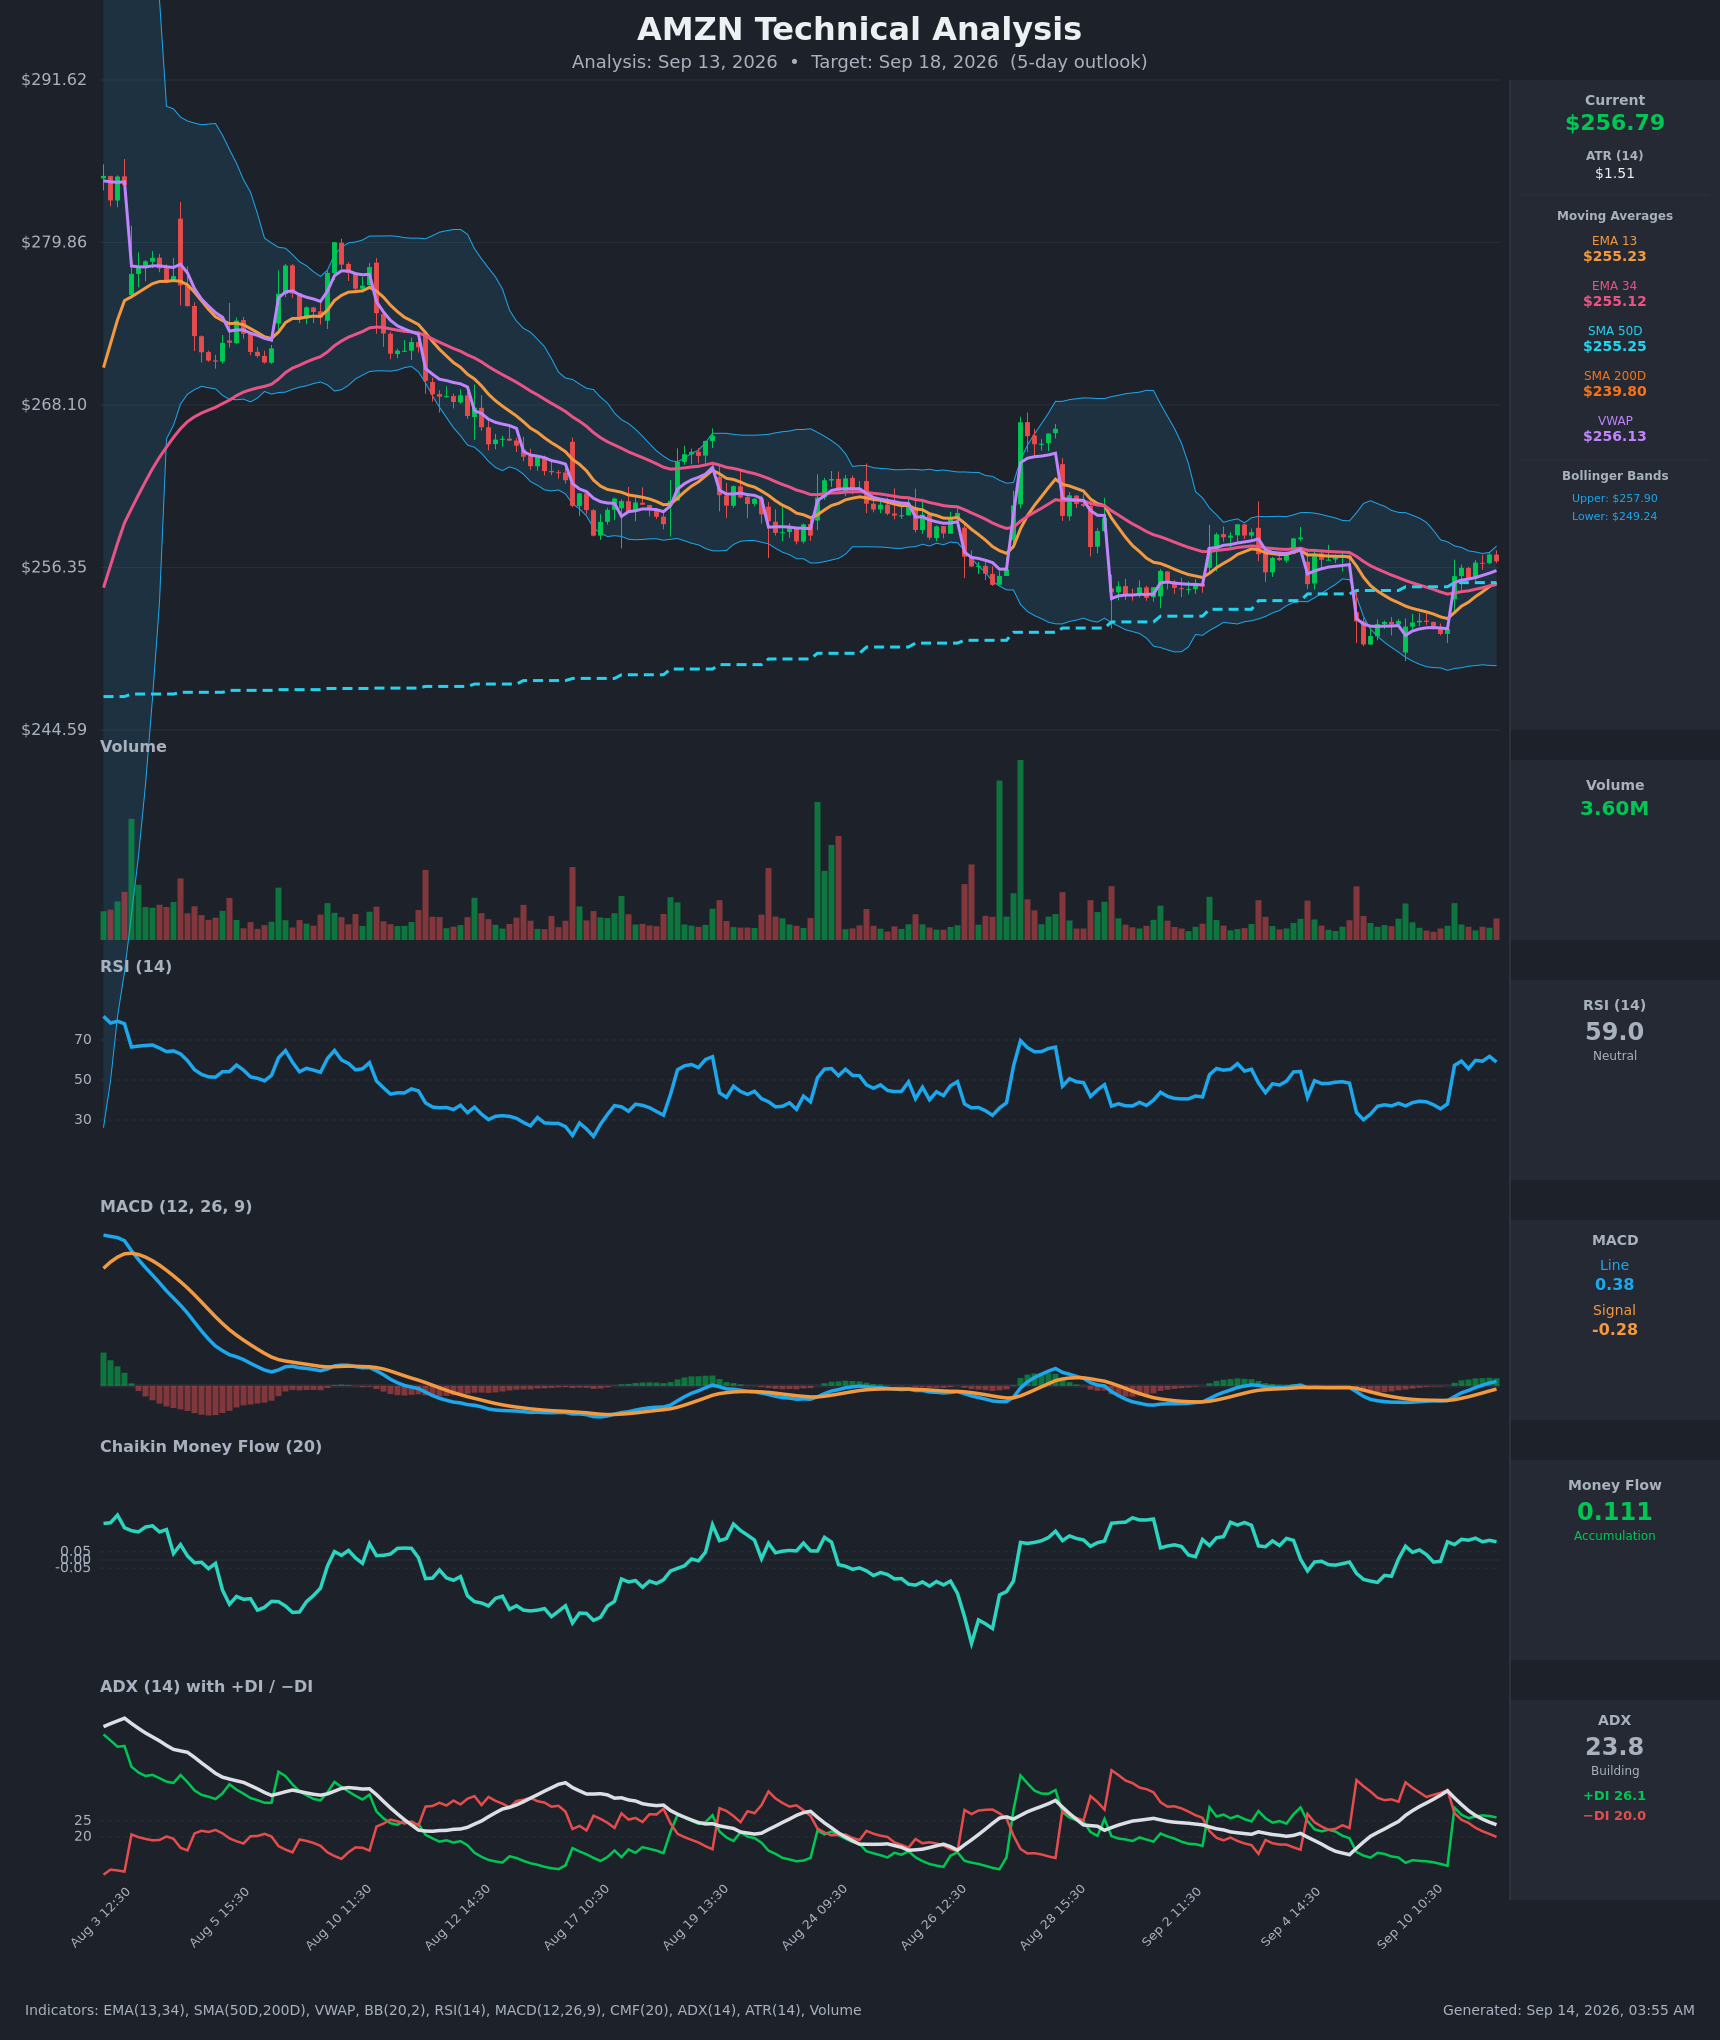
Model vs. Market: The options market implies $245.69–$267.71 into September 21; the 7-day technical model targets $260.75. The chart sees a grind into the wall, the options chain sees a range twice that wide in both directions — which means the market is pricing plenty of room for the chart model to be wrong in either direction without anything structural breaking.
Full technical write-ups: 4-day report → · 7-day report →
4 · Three ways the next 7 days can go
If AMZN pushes above the call wall ($260): the heaviest call open interest in the entire chain sits at that strike, and piles that size tend to slow rallies as they are approached. A clean close through it would also put price back above the estimated hedging pivot, where the same rough estimate says market-maker flows start cushioning rather than fighting. Positioning thins out quickly above: the next meaningful shelves are $261.12 and then the $266.98–$267.71 zone at the top of the implied range.
If AMZN drifts between the walls: this is the path the data describes best. Max pain for September 21 is $255.00, just $1.70 below spot, and the 50- and 100-day moving averages sit in the same $255.25–$255.41 pocket. Expirations sometimes gravitate toward the strike where the most option value expires worthless, and here that strike coincides with a moving-average shelf and with the quietest realized volatility this stock has shown in months. A $252–$260 chop into the expiration would surprise nobody in this data.
If AMZN breaks below the put wall ($240): that would require a move well outside the lower rail of the implied range ($245.69) and through the $250.38 swing support and the 200-day moving average at $239.80 on the way. Spot is already sitting under the estimated $260 flip level, at a distance that is about typical for this name — so on the way down, the positioning estimate offers no cushion until the $240 put pile itself comes into play.
5 · Three defined-risk structures
Prices are end-of-day midpoints as of 2026-09-11. All structures are hypothetical. Verify live prices before trading — these will be stale by the open.
If you expect the range to hold: iron condor
- Trade: Sell the September 21 $247.50/$242.50 put spread and the $265/$270 call spread
- Credit: $1.47 · Max profit: $147 · Max loss: $353 · Break-evens: $246.03 and $266.47
- Why it fits: a neutral composite read, max pain at $255.00 just below spot, and short strikes placed outside the $260 call wall and above the $240 put wall. You collect a credit up front and keep it if AMZN finishes between the short strikes. Both break-evens sit just inside the ±$11.01 implied range — you are getting paid a little less than the market's own estimate of the move, which is the honest cost of a middling premium environment.
- Makes sense only if: you believe the quiet realized volatility of the last month persists and $260 keeps capping rallies.
- Invalidated if: AMZN closes above $260 or below $250.38.
- Managing it: close at ~50% of max credit; exit the whole structure by September 18 regardless, rather than carrying pin risk into a thin expiration; if either short strike is breached on a closing basis, close that side rather than hoping.
- Liquidity note: this is the weak point. The September 21 $265 calls quoted 26¢ wide and the $247.50 puts 23¢ wide — roughly 15–20% of mid on a light, non-standard expiration. Work the order at the mid in one package and never pay the market; if you can't get filled near the mid, the September 18 chain is several times more liquid.
- Analyze this position →
If you lean bullish: short put spread
- Trade: Sell the September 21 $252.50 put, buy the September 21 $247.50 put
- Credit: $1.32 · Max profit: $132 · Max loss: $368 · Break-even: $251.18
- Why it fits: a credit spread pays you now and profits if AMZN simply stays above $252.50. The short strike sits below max pain ($255.00), below the 50-day moving average ($255.25), and below the 7-day chart model's stated support ($252.00). It is also the side of the trade that short-dated sentiment is leaning toward, with the 0–7 day and 7–30 day buckets both positive and call open interest building.
- Makes sense only if: you think the early-September base near $250 is real and the bounce off $251 has legs.
- Invalidated if: AMZN closes below $250.38.
- Managing it: close at ~50% of max credit; because the short-term trend read is flat rather than confirmed, take profits early rather than holding for the last few cents, and exit by September 18 if the trade hasn't worked.
- Liquidity note: the $252.50 puts quoted 43¢ wide and the $247.50 puts 23¢ — wide enough that a careless fill eats a third of the credit. Limit orders at the mid only.
- Analyze this position →
If you lean bearish: short call spread
- Trade: Sell the September 21 $262.50 call, buy the September 21 $267.50 call
- Credit: $1.03 · Max profit: $103 · Max loss: $397 · Break-even: $263.53
- Why it fits: the short strike sits above the $260 call wall and above the $261.12 swing pivot, so the trade only loses if price clears the single heaviest call strike in the chain and keeps going. Flat skew means call premium isn't being given away cheaply relative to puts, and the 20-day moving average at $258.96 is still overhead.
- Makes sense only if: you think $260 caps this bounce the way the open-interest structure suggests.
- Invalidated if: AMZN closes above $260.
- Managing it: this is the structure that fights the chart models — both lean bullish, and the 7-day projection's range high of $264.00 sits above your break-even. Size it smaller than the other two, take 50% quickly, and close on a daily close above $260 rather than waiting for the short strike.
- Liquidity note: the $262.50 calls quoted 26¢ wide, the $267.50 calls 23¢ — the same thin-expiration slippage warning applies.
- Analyze this position →
If none of these: no trade
There is a clean case for standing aside here. Premium is not rich — the gap between priced-in and delivered movement is middling by this stock's own standards, and an IV rank of 18.9/100 means you are selling some of the cheapest volatility of the past year. Meanwhile the September 21 expiration carries thin open interest and 10–20% quoted spreads, so a meaningful slice of any credit you collect goes straight to the market maker before the thesis even gets tested. When the edge is a neutral composite, a middling premium, and a wide bid-ask, the sum of those three can easily be negative. Waiting for either a decisive close through $260 or a retest of the $250 base — and for the far more liquid October expirations — is a defensible decision, not a missed trade.
6 · Quick FAQ
What is AMZN's expected move over the next 7 days? About ±$11.01, or ±4.29%, into the September 21 expiration — a range of roughly $245.69 to $267.71 — per the options market's straddle pricing as of September 11.
Is AMZN expected to go up or down over the next week? Options positioning as of September 11 reads neutral: short-dated sentiment and fresh call open interest lean bullish, while put-side sweeps and slightly negative price momentum lean the other way, and they cancel. That is a read of what traders have already done, not a forecast. The actionable map is the $245.69–$267.71 range plus the $240 and $260 levels.
Are AMZN options expensive right now? Two lenses, two answers. An IV rank of 18.9/100 says option prices are lower than about 81% of the past year's readings. On top of that, they are running about 3.4 vol points above the movement AMZN has actually delivered — richer than roughly 47% of this stock's own recent readings, which is dead average. Net: fairly priced, with no strong edge in either buying or selling premium.
Where is AMZN's biggest options support and resistance? For the September 21 expiration, the put wall is $240.00 and the call wall is $260.00 — and those same two strikes carry the heaviest put and call open interest across the entire chain.
What invalidates this week's read? A close above $260. That level is simultaneously the call wall, the largest gamma-by-strike pile, and the estimated dealer-hedging pivot; through it, the rangebound case gives way to a trend leg toward $266.98–$267.71.
Methodology & disclosures. Data: end-of-day options-chain snapshot for AMZN, 2026-09-11, generated 2026-09-14T03:55:38.933Z. Prices shown are midpoints and will differ from live markets. Momentum/positioning scores and volatility-premium comparisons are descriptive measurements of past option flow and past price movement — not investment advice, signals, forecasts, or guarantees. All trade structures are hypothetical. Every structure shown has a defined maximum loss; you can lose the entire max-loss amount. Options involve substantial risk and are not suitable for all investors.