ARM Options Are Pricing a $24 Move Into Friday — The Chart Model Sees Less Than Half That
ARM's options market implies a $240.65–$288.43 range into the September 18 expiration while the technical model projects just $257–$276.50. Here's what the positioning data says, where the walls sit, and three defined-risk ways to trade the gap.

The options market implies a $240.65–$288.43 range into the September 18 expiration; here's what's driving the bullish positioning read and three defined-risk ways to trade it.
Published Saturday, September 12, 2026 · Data as of the 2026-09-11 close
Explore the live ARM options data in the Detailed Options Analyzer →
Quick answer
| Item | Answer |
|---|---|
| Market bias | Bullish |
| Options-implied range (into Sep 18) | $240.65 – $288.43 (±9.03%, or ±$23.89 around a $264.54 spot) |
| Major support | $250.00 — the Sep 18 put wall and max pain |
| Major resistance | $281.50 — the 100-day moving average, the first structural ceiling inside the implied range; the Sep 18 call wall sits far above it at $310.00 |
| Max pain (Sep 18) | $250.00 |
| Dealer gamma regime (estimate) | Positive — one rough estimate suggests market-maker hedging is currently dampening moves; the same estimate's flip marker sits near $310 |
| Volatility condition | Falling on the month, firmer on the week — IV rank 35.9/100 · premium rich: options priced about 11 vol points above delivered movement |
| Technical check | Confirms (bullish, 3-day and 5-day chart models) |
| Best-fitting strategy | Short put spread — sell the Sep 18 $245 put, buy the $235 put |
| Analysis invalidated if | ARM closes below $250 |
1 · What matters today
ARM closed at $264.79 after a 9.2% run over five sessions, and the options data leans bullish across nearly every input we track: call-side volume is running far ahead of puts, put open interest is thinning, and 25-delta calls are actually priced above 25-delta puts — traders are paying up for upside, not for crash protection. For the September 18 expiration the options market is pricing a move of roughly $23.89 in either direction — that's the move implied by what straddles cost — putting the range at $240.65 to $288.43.
The level that matters most is $250: it is both the heaviest put open interest for that expiration and its max pain strike. Both chart models we ran also lean bullish, which confirms rather than fights the flow read. A close below $250 breaks the thesis.
2 · What the options market is pricing
What changed this week
Money moved to the call side, quickly. Put/call open interest — how many puts are held open for every call — went from 1.17 to 0.97 over five sessions, a 17% drop, against a 14-day average of 1.14. In plain terms, for every call contract held open there is now slightly less than one put, where a week ago there were nearly 1.2. Put/call volume printed 0.43 on Friday versus a 7-day average of 0.61 and a 14-day average of 0.61, on total option volume running 2.0× its 20-day norm. Call open interest grew by 6,229 contracts day-over-day while put open interest shed 4,322.
Implied volatility — the market's estimate of how much ARM will move, baked into option prices — rose 10.9% over five days but is still down 25.5% over thirty, sitting at 64.6% versus a 30-day average of 71.0% and a 90-day average of 88.3%. The forward-looking builds were modest and call-tilted: the Sep 18 $280 calls added 275 contracts of open interest to 4,347 and the $270 calls added 213 to 2,272, while the Oct 2 $250 calls picked up 501. Into Friday's already-settled expiration, the $270 calls shed the single largest position change in the file — historical context only, not a live level.
One tension deserves naming. Our short-, medium- and long-horizon trend reads disagree outright: the past week's move is +9.2%, but ARM is down 5.1% over roughly twenty sessions and down 21.2% over fifty. The near-term flow and the bigger trend are pointing different ways, and that argues for shorter-dated structures and earlier profit-taking rather than sitting on a directional position for weeks.
Expected move
Into September 18, the options market is pricing about ±9.03%, or ±$23.89 around the $264.54 chain-snapshot price — a $240.65 to $288.43 range. Here is the ladder across the covered expirations:
| Expiration | Implied move | Range around $264.54 |
|---|---|---|
| Fri, Sep 18 (7 DTE) | ±9.03% | $240.65 – $288.43 |
| Fri, Sep 25 (14 DTE) | ±12.6% | $231.21 – $297.87 |
| Fri, Oct 16 (35 DTE) | ±19.85% | $212.03 – $317.05 |
The rungs scale almost exactly with the square root of time — ATM implied volatility is 65.2% at the September 18 tenor and 64.1% at the October 16 tenor — so there is no bump or kink anywhere in the curve. Nothing in the chain is being priced as a dated event inside this window; the ladder is simply time.
Volatility
At-the-money implied volatility is 64.6%, with an IV rank of 35.9/100 — meaning today's reading is cheaper than roughly 64% of the past year's readings — and an IV percentile of 50. IV slipped 1.2% on the day, rose 10.9% over the week, and is down 25.5% over thirty days. The front-month read is unavailable today: Friday was an expiry day, so the nearest-expiration interpolation and the term-structure comparison across expiration dates can't be computed.
The most striking "vs its own norm" reading in the file is realized volatility: ARM's 20-day realized movement of about 53% is unusually depressed for this stock's own recent history, even though 53% would be an extreme number for most names. The 10-day reading (58.8%) is running above the 20-day, so movement has been picking back up from that low base.
Premium rich or cheap. The volatility risk premium — the gap between how much movement options are priced for and how much ARM has actually delivered — sits at about 11 vol points in favor of sellers, and that gap is richer than roughly 81% of this stock's own recent readings. When it's positive, option sellers have been collecting more than realized movement cost them. That gap was deeply negative through late August (around −18 points on August 31) and flipped positive on September 1 as the violent late-August sessions aged out of the 20-day realized window; it peaked near 18 points on September 8 and has eased to 11 since. The combination — a middling IV rank of 35.9 alongside a premium over delivered movement in the 81st percentile of its own history — favors collecting premium this week rather than owning it, and the snapshot's implied-minus-realized reading is modestly above its own norm too.
Skew and sentiment
Options the same distance from the stock price don't cost the same — and here the usual relationship is inverted. The 25-delta put is marked at 64.1% implied volatility while the 25-delta call is marked at 67.7%: calls are running 3.6 vol points richer than puts, against a 60-day median of 3.1 points of the same call-rich tilt. Traders are paying up for upside exposure, not for downside protection — though the last three sessions averaged 6.1 points of call richness, so Friday's reading is a step back toward normal rather than a fresh extreme.
Sentiment in short-dated options is positive but uneven. The 0–7 day bucket scores +26 and the 7–30 day bucket +42 (both bullish, driven by call-side open-interest builds and call-dominated delta-weighted flow), while the 60–120 day bucket sits slightly negative at −8. The file's own summary label for that spread is "Mixed" — the front end is bought, the long end isn't. In the latest positioning snapshot, call-tilted volume and net new call-side open interest both registered well above this symbol's own recent norms.
The key levels map
| Level | Price | Why it matters |
|---|---|---|
| Whole chain's heaviest call strike | $320 | 23,037 call contracts open across all expirations, concentrated in November — not a Sep 18 level |
| Call wall (Sep 18) / gamma flip marker (estimate) | $310 | 6,831 call contracts open — the strike that caps upside this week; the dealer-gamma estimate also places its flip marker here |
| Swing resistance | $298.83 – $303.67 | Heuristic swing-pivot cluster from the daily price feed |
| Swing resistance | $291.55 | Nearest clustered pivot above the implied range |
| Top of implied range (Sep 18) | $288.43 | One standard deviation up, per straddle pricing |
| Prior swing high zone | $283 – $285 | The August peak the chart model names as the measured-move target |
| 100-day moving average | $281.50 | The first structural ceiling inside the implied range |
| Bollinger upper / 50-day SMA | $269.27 / $267.08 | Overhead confluence both chart models flag; price sits 0.86% below the 50-day |
| Swing resistance | $266.53 | Nearest heuristic resistance |
| Spot / last close | $264.54 / $264.79 | Chain-snapshot price and official close |
| EMA13 / VWAP confluence | $261.00 | The chart models' first support and their stated invalidation |
| EMA34 | $257.43 | Trend-structure support on the near-term chart |
| 20-day SMA | $251.21 | Price is 5.41% above it |
| Put wall (Sep 18) / max pain / largest gamma strike | $250.00 | 4,682 put contracts open; the price where the most option value would expire worthless; also the chain's single largest gamma concentration |
| Swing support | $243.12 | Heuristic pivot cluster |
| Bottom of implied range (Sep 18) | $240.65 | One standard deviation down |
| Swing support | $233.29 / $227.07 | Deeper pivot clusters from the daily feed |
| Whole chain's heaviest put strike | $200 | 12,477 put contracts across all expirations — a longer-dated hedging shelf, not this week's level |
Note the disagreement worth flagging: the aggregate walls across all ten covered expirations sit at $320 (calls) and $200 (puts), while the September 18 expiration's own walls sit at $310 and $250. For this week, use $310 and $250 — the aggregate figures are dominated by November and December positioning.
Positioning and unusual flow
The dealer-gamma block is an estimate, and this week it reads awkwardly: it labels the regime positive — market-maker hedging that tends to dampen moves rather than amplify them — while placing its flip marker at $310, above spot. That combination is an artifact of the estimate's assumed sign convention, not an observation of dealer inventory, so treat the $310 marker as a rough reference and lean on the wall and max-pain levels instead. The September 18 expiration's own gamma reading is positive as well.
Three flow items stand out, all of them live contracts:
- Sep 18 $282.50 calls: 1,955 contracts traded against just 57 held open — turnover of 34× open interest, at the 100th percentile versus peer contracts, and roughly $762,000 of premium changing hands. That's fresh, aggressive upside positioning about 7% above spot.
- Sep 18 $272.50 calls: 2,046 contracts traded on 463 open, about $1.35 million of premium — the single biggest dollar print in the week's expiration.
- Sep 18 $290 calls: 1,864 contracts traded against 2,168 open, at the 83rd peer percentile, roughly $492,000 of premium. That strike now carries the second-heaviest call open interest inside the implied range.
All three are calls, all three are in the week's expiration, and all three sit above the market. That's the clearest single statement in the data.
3 · Technical check
Both chart models run for this window are bullish, and both place their targets comfortably inside the options-implied range — so the read confirms the options bias rather than fighting it. The 3-day model targets $269.50 with a projected range of $258.50 to $273.00, citing a strong directional trend (ADX 33.2 with +DI at 36.3 versus −DI at 16.3), a fresh MACD crossover and money-flow accumulation, with support at $261.00 and resistance at $269.27. The 5-day model targets $271.00 with a projected range of $257.00 to $276.50, support at $260.00 and resistance at $269.50.
The interesting gap isn't direction — it's magnitude. For the same September 18 date, the chart model's projected range spans about $19.50, while the options market is pricing a range of nearly $48. Options are braced for roughly two and a half times the movement the chart model expects. That is exactly the condition the volatility-premium reading described above: priced-for movement running well ahead of delivered movement.
Model vs. Market: The options market implies $240.65–$288.43 into September 18; the 5-day technical model projects $257.00–$276.50 with a $271.00 target. If the chart model is closer to right, the outer rails of the options range never get tested — which is the case for selling the wings rather than buying them.
Both models name the same kill switch for their dominant scenario: a close back below $261 (the EMA13/VWAP confluence). That's tighter than our options-derived invalidation at $250, and it's a reasonable early-warning line for anyone holding a directional structure. The TA read did not change our bias — it did nudge the short call strike of the range structure below the chart model's $276.50 ceiling.
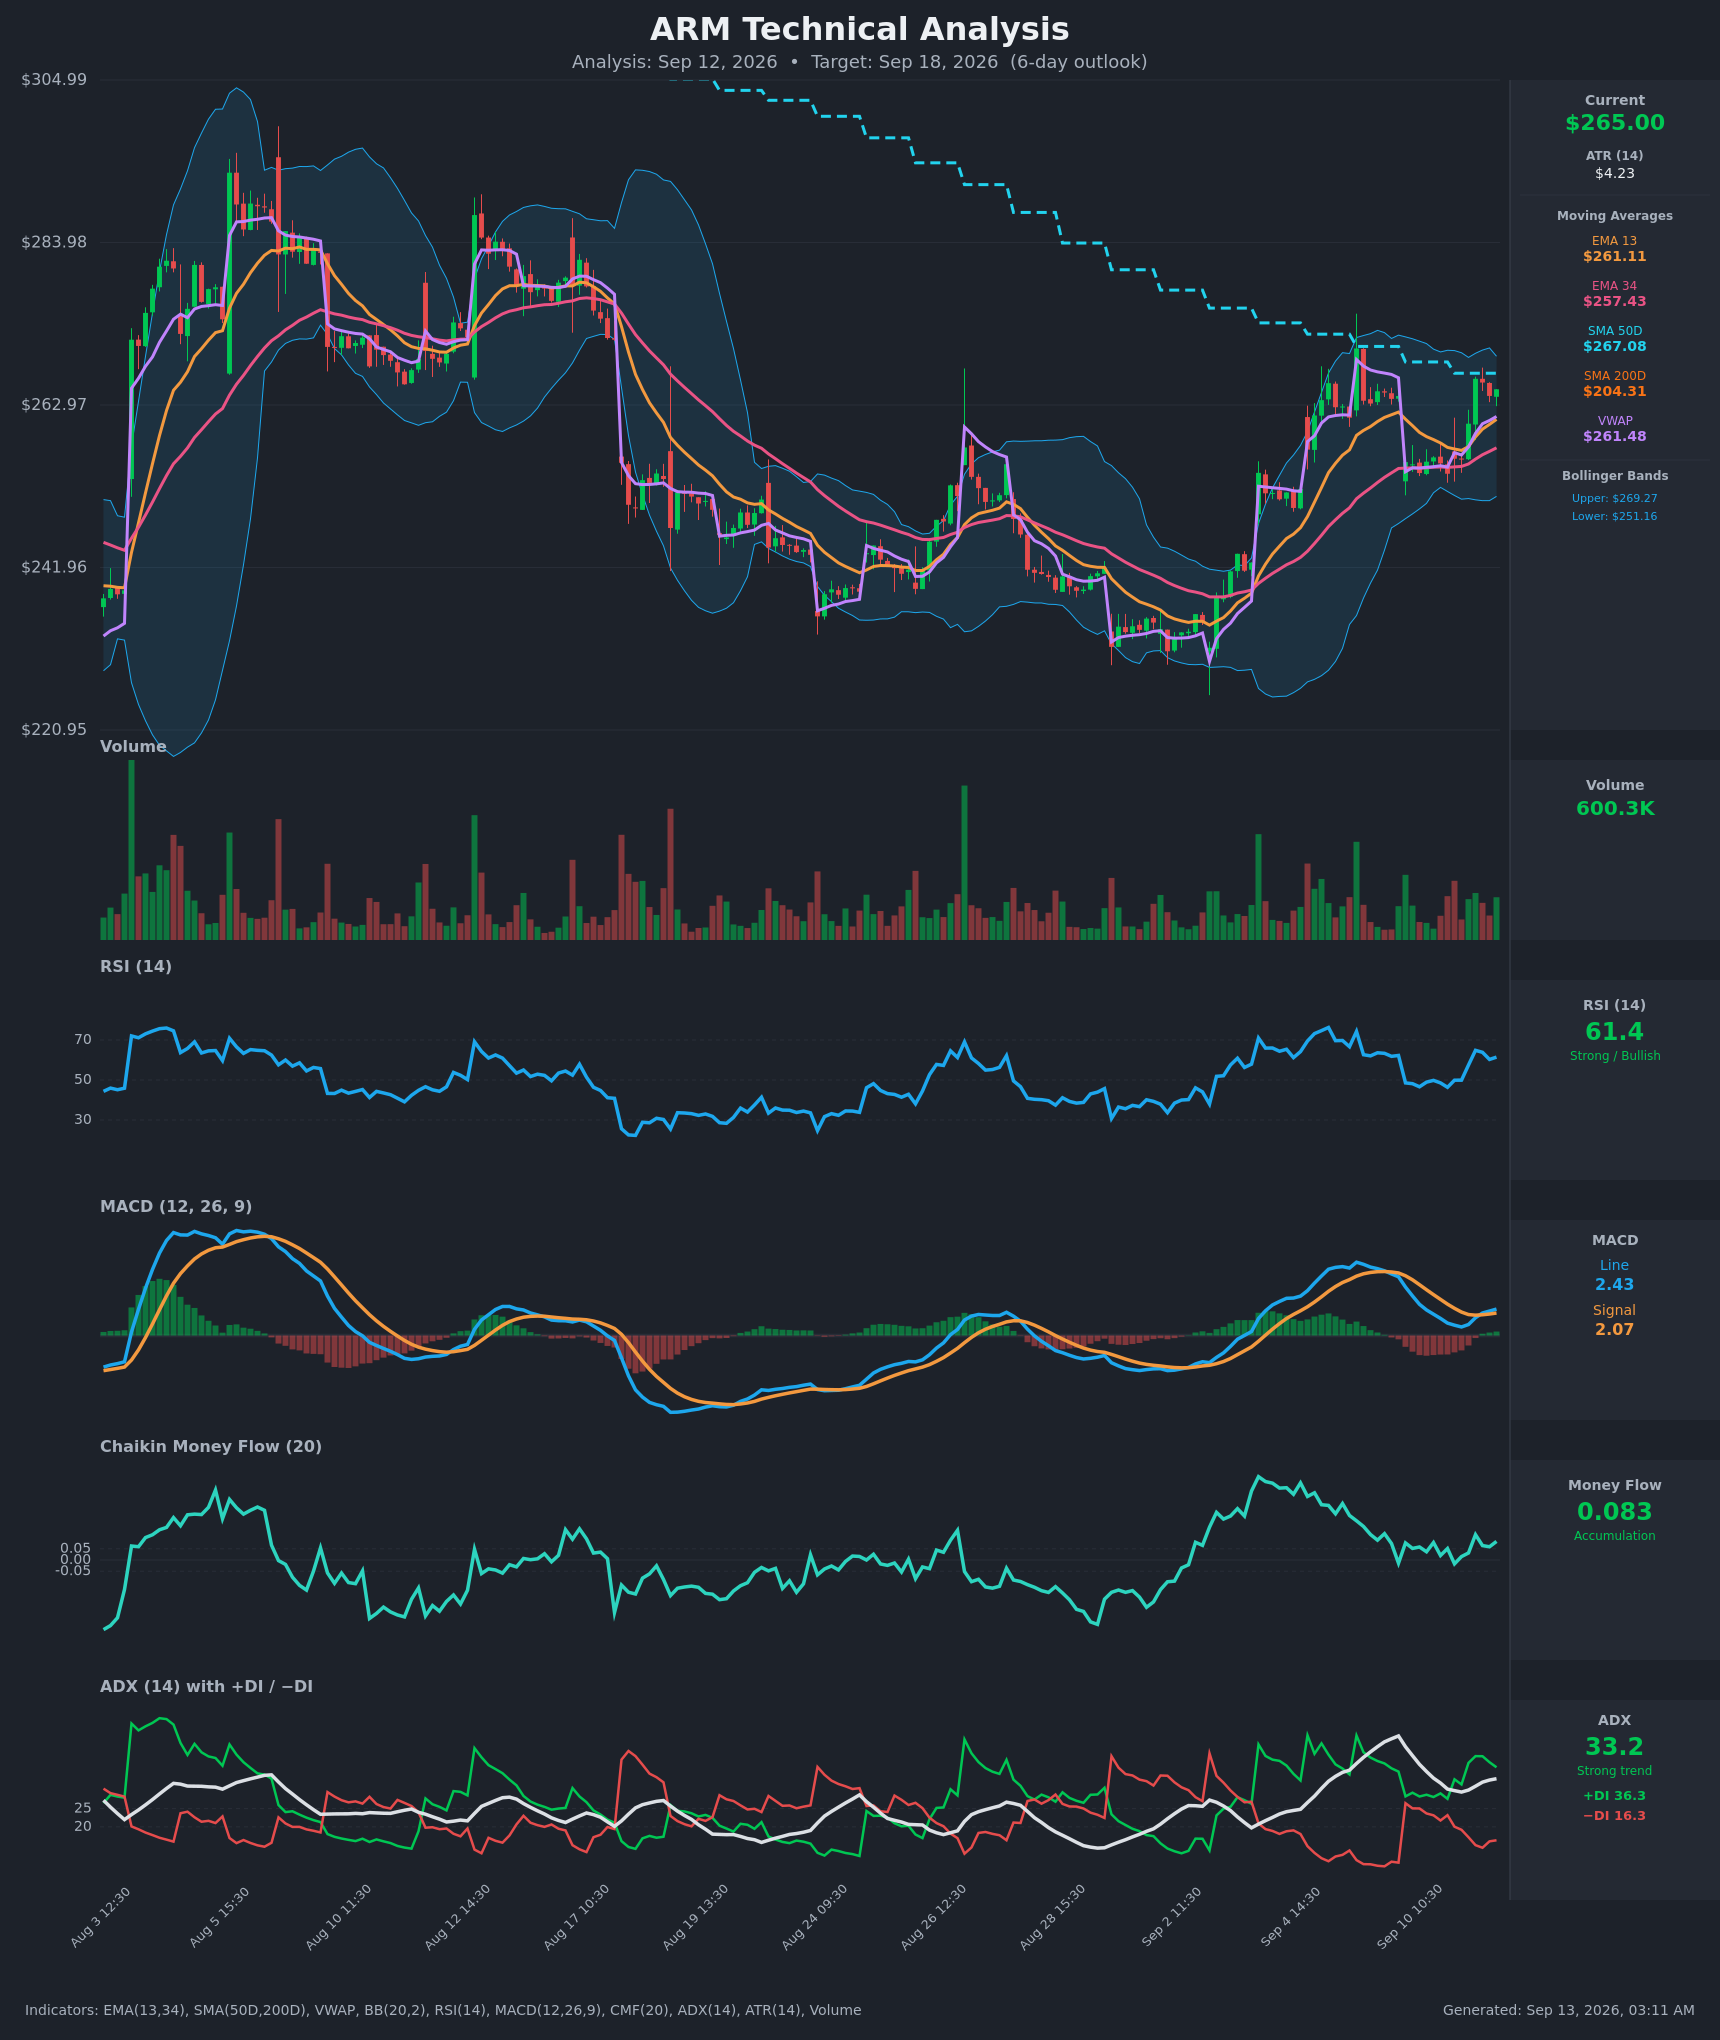
Full technical write-ups: 3-day report → · 5-day report →
4 · Three ways the next five days can go
If ARM pushes above the call wall ($310): that would require a 17% move in five sessions — well outside the implied range — and it would mean running through the heaviest call open interest on the board. Positioning above that strike thins out fast until the whole-chain $320 concentration, so the practical read is that $310 is a ceiling this week rather than a level in play.
If ARM drifts between the walls: this is the base case the positioning describes. Max pain for September 18 sits at $250, and $250 also carries the chain's single largest gamma concentration — expirations sometimes gravitate toward that kind of cluster. Between the $250 shelf and the $280–$290 call open interest overhead, the structure argues for a grind inside roughly $250–$290, with the $267–$269 moving-average and band confluence as the first real friction on the way up.
If ARM breaks below the put wall ($250): that strike is doing double duty as support and pin, so losing it means the week's supportive structure has failed. Below it, the next marked levels are the $243.12 swing pivot and the $240.65 lower rail of the implied range. The dealer-gamma estimate says hedging is currently dampening moves, but that block is an estimate built on an assumed convention — it should not be the reason anyone stays in a losing position.
5 · Three defined-risk structures
Prices are end-of-day midpoints as of 2026-09-11. All structures are hypothetical. Verify live prices before trading — these will be stale by the open.
If you lean bullish: Sep 18 $245/$235 put credit spread
- Trade: Sell the Sep 18 $245 put, buy the Sep 18 $235 put. You collect a credit up front and keep it if ARM stays above $245 at expiration.
- Credit: $1.43 · Max profit: $143 per spread · Max loss: $857 · Break-even: $243.58
- Why it fits: The short strike sits below both the $250 put wall and the $250 max-pain strike, and below the $240.65–$288.43 implied range's midpoint by a wide margin. You are selling a premium that is running about 11 vol points above what ARM has actually delivered — richer than roughly 81% of this stock's own recent readings.
- Makes sense only if: you're comfortable with the near-term flow read outweighing a 50-day downtrend that is still intact.
- Invalidated if: ARM closes below $250.
- Managing it: close at roughly 50% of max credit; because the short-term trend is fighting the longer-term one, take profits early rather than holding to expiration. If ARM closes below $261 — both chart models' own invalidation — tighten up; if it closes through $245, close rather than hope.
- Liquidity note: the $245 puts traded 11¢ wide on a $2.26 mid (about 5%); the $235 puts are 14¢ wide on an 83¢ mid, which is a big fraction of that leg — use limit orders and work the spread as a package.
- Analyze this position →
If you expect the range to hold: Sep 18 $235/$240/$290/$295 iron condor
- Trade: Sell the $240 put and buy the $235 put; sell the $290 call and buy the $295 call. You collect a credit and keep all of it if ARM finishes between $240 and $290.
- Credit: $1.27 · Max profit: $127 · Max loss: $373 · Break-evens: $238.73 and $291.27
- Why it fits: Both short strikes sit just outside the one-standard-deviation rails ($240.65 and $288.43), and both sit outside the 5-day chart model's projected $257.00–$276.50 range entirely. This is the direct expression of the Model vs. Market gap: if the chart model's much smaller expected move is closer to the truth, both wings expire worthless.
- Makes sense only if: you believe the 81st-percentile volatility premium is real and not the front edge of a genuine expansion — ARM's 10-day realized volatility (58.8%) is already running above its 20-day (53.2%).
- Invalidated if: ARM closes below $250 or through $290 — either side kills the range assumption well before expiration.
- Managing it: close at roughly 50% of max credit, or by Wednesday, September 16 — the halfway checkpoint — if neither side has moved in your favor. Five-day condors on a 65% implied-volatility name are gamma-sensitive; do not hold them into the final session hoping for a pin.
- Liquidity note: the $290 calls trade 8¢ wide (about 3% of the $2.64 mid) and the $295 calls 11¢; the put wing is wider, with the $235s at 14¢. Total quoted spread across all four legs is roughly 46¢ against a $1.27 credit — a real cost, so leg in on limits or skip it.
- Analyze this position →
If you lean bearish: Sep 18 $280/$290 call credit spread
- Trade: Sell the Sep 18 $280 call, buy the Sep 18 $290 call. You collect a credit and keep it if ARM stays below $280.
- Credit: $1.81 · Max profit: $181 · Max loss: $819 · Break-even: $281.81
- Why it fits: The $280 strike carries 4,347 call contracts open — the heaviest call open interest inside the implied range — and heavy call positioning overhead tends to slow rallies. It also sits above the chart model's $276.50 ceiling and above the $267–$269 moving-average confluence that has already rejected price once this month. This is the structure for someone who thinks the 20- and 50-day downtrends reassert themselves.
- Makes sense only if: you're willing to trade against the week's dominant flow — the unusual activity is overwhelmingly call-side and the 25-delta skew favors calls.
- Invalidated if: ARM closes above $280.
- Managing it: close at roughly 50% of max credit; exit if ARM closes above $269.50, the resistance confluence both chart models name, rather than waiting for the short strike to be breached.
- Liquidity note: the $280 calls trade 10¢ wide on a $4.45 mid (2.3%) and the $290 calls 8¢ wide — the tightest pair in this article.
- Analyze this position →
If none of these: no trade
The case for standing aside is not that premium is cheap — it isn't. It's the mismatch between a rich premium and a stock that can deliver a 9% week without anyone calling it unusual. ARM gapped down 4.25% on September 10 and up 3.73% on September 8 inside a single week; a $10-wide credit spread collecting $1.43 gives back six weeks of that credit in one such gap. If you can't watch the position intraday and wouldn't be comfortable closing at a loss on Monday morning, collecting an 81st-percentile premium on a name with 53% realized volatility is not free money — it's being paid a fair price for a real risk. A smaller position, or none, is a legitimate answer.
6 · Quick FAQ
What is ARM's expected move this week? About ±$23.89 (±9.03%) into the September 18 expiration — a $240.65 to $288.43 range — per the options market's straddle pricing as of the September 11 close.
Is ARM expected to go up or down over the next five days? Options positioning as of September 11 leans bullish — call-heavy volume, thinning put open interest, and calls priced richer than puts — but that's a read of what traders have done, not a forecast. The actionable map is the $240.65–$288.43 range plus the $250 support and the $281.50 overhead moving average, with the $310 call wall beyond it.
Are ARM options expensive right now? Two lenses. IV rank of 35.9/100 says option prices are lower than about 64% of the past year's readings. But relative to actual delivered movement, they're running about 11 vol points rich — richer than roughly 81% of this stock's own recent readings. Net: not expensive versus the year, but expensive versus what the stock has been doing, which favors selling premium over buying it.
Where is ARM's biggest options support and resistance? For the September 18 expiration, the put wall is $250 (4,682 contracts) and the call wall is $310 (6,831 contracts). Across the whole chain those levels sit at $200 and $320, but those are driven by November and December positioning.
What invalidates this week's read? A close below $250.
Methodology & disclosures. Data: end-of-day options-chain snapshot for ARM, 2026-09-11, generated 2026-09-13T03:11:30.958Z. Prices shown are midpoints and will differ from live markets. Momentum/positioning scores and volatility-premium comparisons are descriptive measurements of past option flow and past price movement — not investment advice, signals, forecasts, or guarantees. All trade structures are hypothetical. Every structure shown has a defined maximum loss; you can lose the entire max-loss amount. Options involve substantial risk and are not suitable for all investors.