ASTS Options Are Pricing a $5.53 Move Into September 18 — But the Chart Models See $58
The options market implies a $54.33–$65.39 range for ASTS into the September 18 expiration, and positioning leans mildly higher — while both chart models call for a slide toward $58. Here's the level map and three defined-risk ways to trade the gap.

The options market implies a $54.33–$65.39 range into the September 18 expiration; here's what's driving it, where the real levels sit, and three defined-risk ways to trade it.
Published Sunday, September 13, 2026 · Data as of the 2026-09-11 close
Explore the live ASTS options data in the Detailed Options Analyzer →
Quick answer
| Item | Answer |
|---|---|
| Market bias | Slightly bullish (neutral-bullish) |
| Options-implied range (into Sep 18) | $54.33 – $65.39 (±9.23%, about ±$5.53) |
| Major support | $60.00 — the Sep 18 put wall (6,209 contracts open); the whole chain's heaviest put strike is $55.00 |
| Major resistance | $125.00 is technically the Sep 18 call wall, but it's a lottery-ticket strike — the practical ceiling is $65.00 and then $70.00, the whole chain's heaviest call strike |
| Max pain (Sep 18) | $65.00 |
| Dealer gamma regime (estimate) | Negative for the Sep 18 expiration — in this regime hedging tends to amplify moves rather than cushion them; a flip level could not be estimated from today's data |
| Volatility condition | Falling — IV rank 5.71/100 · premium thin: options are priced about 7.5 vol points below delivered movement |
| Technical check | Diverges (bearish, 3-day and 5-day chart models) |
| Best-fitting strategy | Sep 18 $60/$64 call debit spread (long premium, defined risk) |
| Analysis invalidated if | ASTS closes below $55.70 |
1 · What matters today
ASTS closed at $59.86 and the options market is pricing roughly $5.53 up or down — about ±9.23% — through Friday, September 18. That's a $54.33 to $65.39 range, derived from what at-the-money straddles cost. Our read of the options flow tilts slightly bullish: short-dated sentiment is the firmest it has been in a week, call-side sweeps dominated the tape, and spot is sitting right on the biggest pile of open put contracts at $60.00 — the far edge of the corridor traders have built. The counterweight is real and worth saying plainly: price has fallen in every trend window we measure, and both chart models point lower into this same expiration. That's the tension. One level settles it — a close below $55.70 kills this read entirely.
2 · What the options market is pricing
What changed this week
ASTS slipped 3.64% over the past five sessions and is down 16.30% over twenty. The volatility side moved with it, but downward: at-the-money implied volatility — the market's estimate of how much ASTS will move, baked into option prices — sits at 69.29%, down 6.17% on the day, 3.56% over five sessions, and a striking 37.53% over thirty. It is now well beneath both its 30-day average (85.4%) and its 90-day average (102.8%). Today's IV rank of 5.71 compares to a 7-day average of 12.02 and a 14-day average of 8.47 — the air is coming out of this chain fast.
Positioning barely budged. Put volume ran at 0.47 contracts for every call (put/call ratio — above 1 means puts dominate), essentially on top of its 7-day average of 0.46 and below the 14-day 0.54. Open interest tells the same story: 0.64 puts per call against a 7-day average of 0.62. Among contracts still live, the biggest one-day open-interest changes were a 1,367-contract reduction in the October 16 $65 puts, a 381-contract build in the September 18 $80 calls and 286 more September 18 $65 calls — nothing that reshapes the board. Into Friday's now-settled expiration, the $68 calls added 2,173 contracts of open interest, but that's history.
The one genuine divergence is between flow and price. Our short-, medium- and long-term trend reads all point the same way — down — with price off 3.6% over the past week, 16.3% over the past month and 30.7% over roughly two months. The options flow has been pulling the other way since the September 3 momentum crossover. Near-term positioning and the bigger trend are not telling the same story, and that argues for short-dated structures and quick profit-taking rather than anything you'd hold for weeks.
Expected move
Into September 18, the chain prices ±9.23%, or about $5.53 either side of $59.86 — a $54.33 to $65.39 range. Stepping out the ladder (the already-expired September 11 rung is excluded):
| Expiration | Implied move | Range around $59.86 |
|---|---|---|
| Sep 18 (7 DTE) | ±9.23% | $54.33 – $65.39 |
| Sep 25 (14 DTE) | ±13.5% | $51.78 – $67.94 |
| Oct 16 (35 DTE) | ±22.23% | $46.55 – $73.17 |
The ladder scales almost exactly with the square root of time — no hump, no kink, no event being priced. Implied volatility is roughly flat across the curve (66.7% at Sep 18, 68.9% at Sep 25, 71.8% at Oct 16), which is the chain's way of saying it sees nothing special about any particular date in the next five weeks.
Volatility
At-the-money IV of 69.29% carries an IV rank of 5.71 out of 100 — where today's reading sits versus the past year, so 5.71/100 means option prices are cheaper than roughly 94% of the past year's readings. The 52-week percentile is under 1. This is, in the plainest terms, the cheapest ASTS options have been in a year. The front-month read is unavailable today (the snapshot landed on an expiry day, so front-month IV can't be interpolated), which also means no term-structure comparison this week.
Two "vs its own norm" observations are worth pulling out. First, 20-day realized volatility of 76.8% — how much the stock has actually been moving — is unusually low for this name, well below its own recent history, which is remarkable for a stock that has fallen 30% in two months. Second, today's call-side sweep activity was unusually heavy by this stock's standards: five call contracts cleared the peer-relative unusual bar against zero puts, one of the most call-tilted readings in the recent record.
Premium rich or cheap. The volatility risk premium — the gap between how much movement options are priced for and how much ASTS has actually delivered — sits at about minus 7.5 vol points (69.3% implied against 76.8% delivered). When that number is positive, option sellers have been collecting more than realized movement cost them; here it is negative, meaning recent sellers have been paid less than the stock's actual swings. The gap ranks around the 53rd percentile of this stock's own recent readings — middle of the pack for ASTS, which tells you how consistently negative this premium has been. Combine that with an IV rank of 5.71 and the verdict is unambiguous: this is a week to own optionality, not sell it. Defined-risk debit structures lead the list below for exactly that reason.
Skew and sentiment
ASTS carries inverted skew — puts and calls the same distance from the stock price don't cost the same, and here it's the calls that are expensive. The 25-delta call prices at 76.8% implied volatility against 69.4% for the equivalent put: calls run about 7.4 vol points over puts, against a 60-day norm of 6.8 points for this name. Traders are paying up for upside, not crash protection — a persistent feature of this stock, and today it's marginally less extreme than the 8.4-point average of the past week.
Sentiment in short-dated options is the firmest part of the picture. The 0–7 day bucket scores +65, driven by 6,696 contracts of call open interest added against 502 puts removed. The 7–30 day bucket is dead flat at +1, the 30–60 day bucket +21, and the 60–120 day bucket +17. Our read of the chain calls that regime broadly bullish — every bucket leans the same way, none dominates. The composite flow score of 5 is well off its 7-day average of 23, though, so this is a lean, not a stampede.
The key levels map
| Level | Price | Why it matters |
|---|---|---|
| Call wall, Sep 18 expiration | $125.00 | 24,188 contracts open — but 109% above spot, this is lottery-ticket inventory, not a ceiling |
| 200-day moving average | $81.55 | Price is 26.6% below it; the multi-month downtrend context |
| Whole-chain heaviest call strike | $70.00 | 28,680 contracts across all expirations, plus swing resistance at $70.10 — the practical overhead cap |
| Swing resistance | $67.20 | Recent pivot cluster from the price structure |
| Max pain, Sep 18 · heaviest gamma strike | $65.00 | The price where the most option value would expire worthless; also the single largest gamma pile in the chain. Expirations sometimes gravitate here |
| 50-day moving average | $65.04 | Sits on top of max pain — a double layer of resistance |
| Swing resistance | $64.17 | The September 2–4 bounce high zone |
| 20-day moving average | $63.16 | Price is 5.22% below it |
| Put wall, Sep 18 expiration | $60.00 | 6,209 puts open — the biggest downside pile for this expiration, and spot is sitting on it |
| Last close | $59.86 | Chain-snapshot spot; official close identical |
| Swing support · whole-chain put wall | $55.70 / $55.00 | Structural support at $55.70, with 30,651 puts open at $55.00 across the chain — the next real shelf |
| Swing support | $53.07 | Deeper pivot; below the implied range floor |
| 52-week low | $37.18 | Price sits 23.5% up its 52-week range (high $133.86) |
Note the disagreement worth flagging: the September 18 expiration's own call wall ($125.00) and the whole chain's heaviest call strike ($70.00) are nowhere near each other. The $125 line is an artifact of leftover speculative inventory, not a hedging magnet. When we talk about a ceiling this week, $65.00 and $70.00 are the levels that matter.
Positioning and unusual flow
One rough estimate of dealer positioning puts the September 18 expiration in a negative-gamma regime — market makers hedge the options they've sold, and in this regime their hedging tends to amplify moves rather than dampen them. The whole-chain estimate agrees. A gamma flip level could not be computed from today's data, so treat the regime read as directionally indicative only. It matters mostly for the downside branch below: if $60 breaks, hedging flows are more likely to press than to catch.
Three live flow items stand out. The September 25 $65 calls traded 14,165 contracts against 11,436 open — roughly $2.1 million of premium, the largest single ticket on the board, at a mid of $1.49. The September 18 $58 puts turned over 2,082 contracts against 556 open, about $276,000 of premium and a 3.7× turnover ratio — genuine new downside positioning inside the week. And the September 18 $70 calls traded 4,215 contracts against 9,092 open at 23½ cents, a cheap swing for a stock the market says can move $5.53. Call-side dollars outweigh put-side dollars, but the $58 put print is the tape's dissent.
3 · Technical check
Both chart models disagree with the options read, and they disagree firmly. The 3-day model (target date September 16) is bearish, targeting $58.60 with a projected range of $57.30 to $61.60. Its reference price of $59.84 matches the options snapshot, so there's no data-date mismatch. It cites RSI at 38.17 and falling, a MACD line below its signal with a widening negative histogram, and ADX at 26.4 with the negative directional indicator above the positive — a confirmed downtrend rather than chop. Its key levels: support $58.00, resistance $61.00.
The 5-day model (target date September 18, the same expiration this article is built around) is also bearish, targeting $58.10 with a projected range of $56.80 to $60.60. It flags a fresh bearish EMA13/EMA34 crossover between September 10 and 11 and a Chaikin Money Flow reading of −0.123, which reads as sustained distribution. Its dominant scenario invalidates on a reclaim and hold above $61.80.
Classification: both diverge. The chart models' entire projected range for September 18 sits in the lower half of what the options market is pricing, and their target sits below spot while positioning leans above it. This did change strike selection below: the bullish structure is kept tight and cheap rather than reaching for the $65–$70 zone, and the range-hold structure's short put strike sits at $55 rather than being pulled up toward $58, where the chart models expect price to spend time.
Model vs. Market: The options market implies $54.33–$65.39 into September 18; the 5-day technical model targets $58.10. The gap resolves the moment ASTS either reclaims $61.80 — which would confirm the options flow read and break the chart models' dominant scenario — or closes below $58.00, which hands the week to the trend.
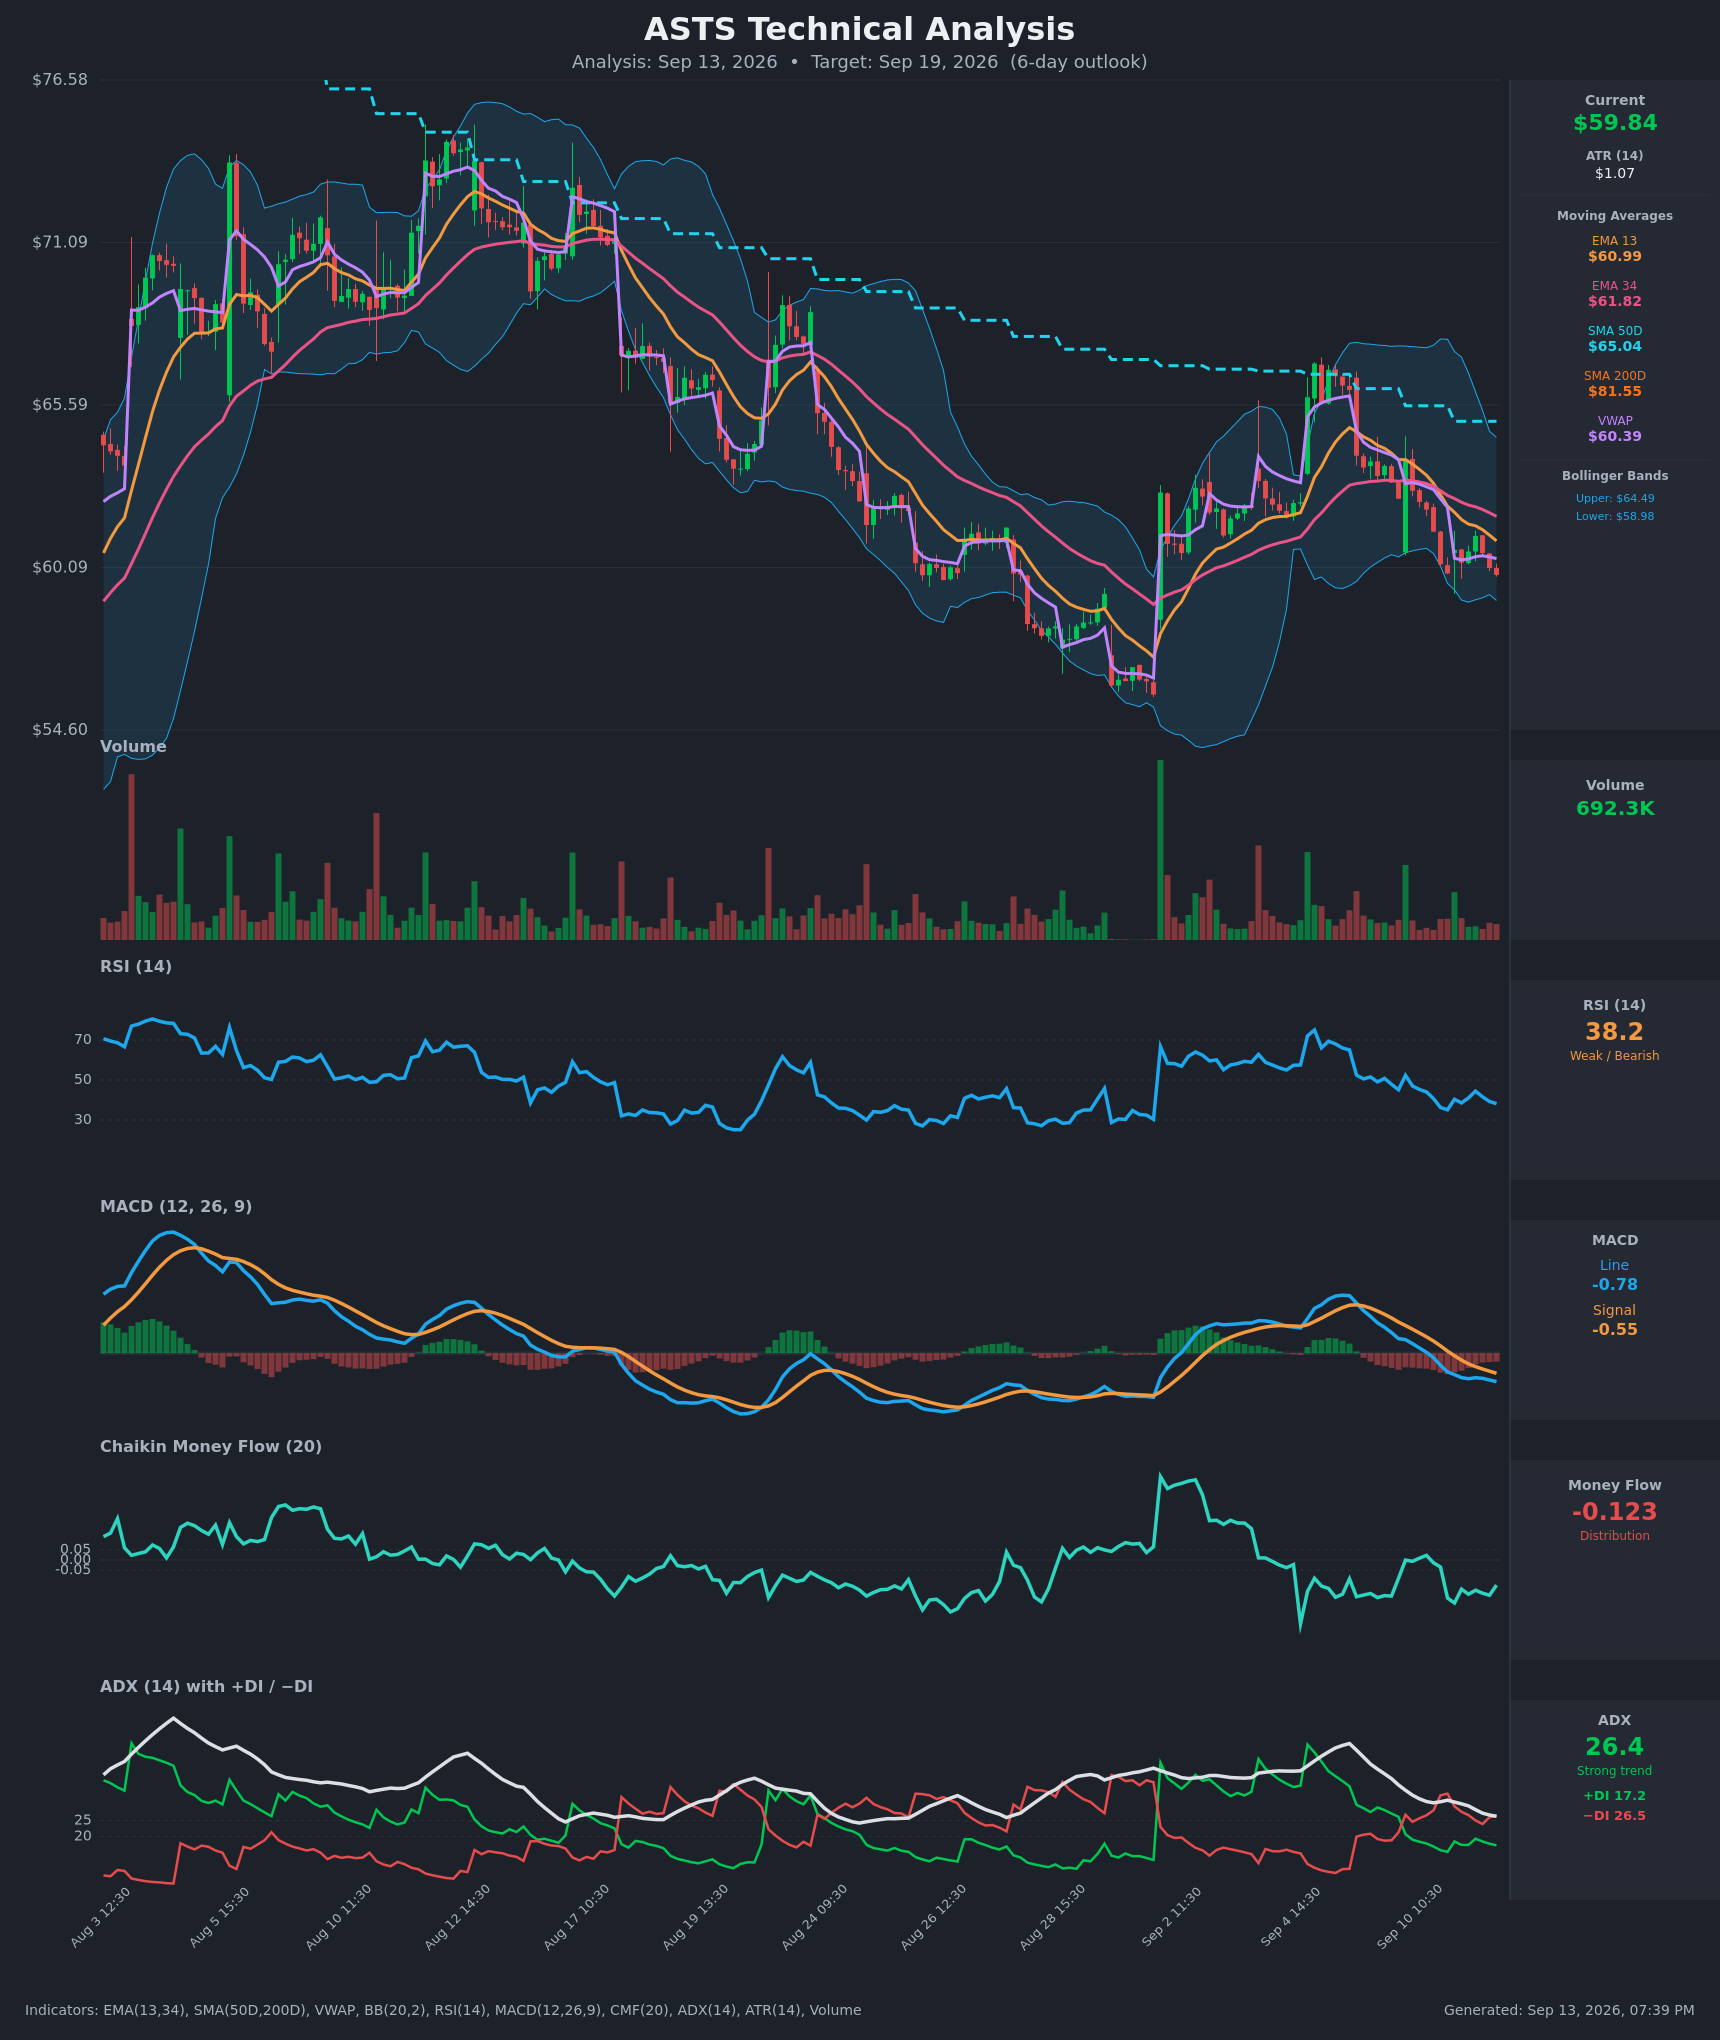
Full technical write-ups: 3-day report → · 5-day report →
4 · Three ways the next five days can go
If ASTS pushes above $65.00: That level is both the September 18 max-pain strike and the single heaviest gamma strike in the chain, sitting directly beneath the 50-day moving average at $65.04. Heavy open interest overhead tends to slow rallies as hedging flows lean against them. Positioning thins noticeably between there and $70.00, the whole chain's biggest call pile — so a clean break through $65 leaves less resistance than the map suggests until $70.
If ASTS drifts between $60.00 and $65.00: This is the pin case, and it's where the max-pain math points. With spot sitting on the September 18 put wall at $60.00 and the heaviest expiring value clustered at $65.00, the gravitational pull through Friday runs mildly upward. Nothing about that is a forecast — it's a description of where expiring open interest sits and how hedging flows tend to behave around it.
If ASTS breaks below $60.00: This is the acceleration branch. One rough estimate puts the September 18 expiration in a negative-gamma regime, where market-maker hedging tends to amplify selling rather than cushion it — and the $60 put wall is exactly where that inventory is concentrated. The next structural shelf is $55.70, with 30,651 puts open at $55.00 across the chain just below. Both chart models' dominant scenarios live in this branch.
5 · Three defined-risk structures
Prices are end-of-day midpoints as of 2026-09-11. All structures are hypothetical. Verify live prices before trading — these will be stale by the open.
If you lean bullish: Sep 18 $60/$64 call debit spread
- Trade: Buy the Sep 18 $60 call, sell the Sep 18 $64 call
- Debit: $1.27 ($2.14 paid − $0.87 collected) · Max profit: $273 · Max loss: $127 · Break-even: $61.27
- Why it fits: With an IV rank of 5.71 and options priced about 7.5 vol points below what ASTS has actually delivered, long premium is the structurally correct side of the trade this week. A debit spread — you pay upfront, and you're betting the stock finishes above your long strike by more than that payment — caps the cost of being wrong at $127. The short $64 strike sits just under the $65 max-pain and heaviest-gamma cluster, so you're not paying for territory the chain says is heavy.
- Makes sense only if: you believe the short-dated call-side flow (0–7 day sentiment at +65) matters more than the aligned downtrend the chart models are reading.
- Invalidated if: ASTS closes below $58.00 — the chart models' shared support level, and the point where the bullish premise stops being a lean and becomes hope.
- Managing it: Take profit at roughly 60–70% of max value; with short-term price direction fighting a two-month downtrend, don't wait for the last few cents. Exit by Thursday's close regardless — gamma risk in the final session of a 7-DTE spread dwarfs whatever time value is left.
- Liquidity note: the $60 calls quote 8¢ wide (3.7% of mark) — easy fills. The $64 calls are 6¢ wide, about 7% of a $0.87 mark, so work the spread as a package with a limit order rather than legging in.
- Analyze this position →
If you expect the range to hold: Sep 18 $50/$55/$65/$70 iron condor
- Trade: Sell the Sep 18 $55 put and buy the $50 put; sell the Sep 18 $65 call and buy the $70 call
- Credit: $0.87 · Max profit: $87 · Max loss: $413 · Break-evens: $54.13 and $65.87
- Why it fits: Both break-evens sit just outside the options-implied range of $54.33–$65.39, and the short strikes are anchored to real structure — $55.00 is the whole chain's heaviest put strike and sits under swing support at $55.70, while $65.00 is max pain and the heaviest gamma strike. A credit spread means you collect cash now and keep it if price stays between your short strikes.
- Health warning: you're selling premium that hasn't been rich lately — the volatility risk premium is negative and IV rank is 5.71/100, so this structure is fighting the volatility math. It earns its place only as a pure range bet, not as a premium harvest.
- Makes sense only if: you think the negative-gamma estimate overstates the fragility and ASTS simply chops between the walls into Friday.
- Invalidated if: ASTS closes below $55.70 or above $65.39 — either break puts a short strike in play with a 4.75-to-1 loss-to-gain ratio behind it.
- Managing it: Close at roughly 50% of max credit. If either short strike is breached on a closing basis, close the tested side rather than hoping — the risk/reward here punishes patience.
- Liquidity note: the $55 puts trade 4¢ wide and the $70 calls 1¢ wide; the $50 put wing is 6¢ wide on an 8¢ mark, which is wide in percentage terms but immaterial in dollars.
- Analyze this position →
If you lean bearish: Sep 18 $60/$56 put debit spread
- Trade: Buy the Sep 18 $60 put, sell the Sep 18 $56 put
- Debit: $1.58 ($2.275 paid − $0.695 collected) · Max profit: $242 · Max loss: $158 · Break-even: $58.42
- Why it fits: This is the structure that expresses the chart models' view — the 5-day model targets $58.10, comfortably below the $58.42 break-even and inside the spread's profitable zone. Cheap implied volatility makes the long put the right way to buy that view. The short $56 strike sits just above the $55.70 swing shelf, so you're selling the strike where structural support begins.
- Makes sense only if: you weight the ADX-confirmed downtrend and the $276,000 of fresh $58 put buying above the call-side sweep tally.
- Invalidated if: ASTS closes above $61.80 — the 5-day model's own invalidation level and the EMA34/VWAP cluster it names.
- Managing it: Because short-term direction here fights nothing — the trend and the near-term chart read agree — this is the structure with the cleanest thesis, but it still expires in seven days. Take 60–70% of max value and exit by Thursday's close.
- Liquidity note: the $60 puts trade 5¢ wide (2.2% of mark) on 6,209 contracts of open interest — the most liquid line on this expiration. The $56 puts are 7¢ wide.
- Analyze this position →
If none of these: no trade
There is a defensible case for standing aside. The options read and the technical read point in opposite directions with roughly equal conviction, and that is not a setup — it's a coin flip with commissions. The condor in particular deserves scrutiny: with IV rank at 5.71 and a negative volatility risk premium, you'd be selling the cheapest premium of the year into a stock whose 20-day realized volatility is still 76.8%. Neither directional spread is expensive, but a $127 or $158 debit on a thesis contradicted by the other half of the evidence is still a real loss when it goes wrong. Waiting for either $61.80 to be reclaimed or $58.00 to break — and then trading the resolution — costs nothing but a couple of days of time value.
6 · Quick FAQ
What is ASTS's expected move into September 18? About ±$5.53, or ±9.23%, giving a $54.33–$65.39 range — per the options market's straddle pricing as of the 2026-09-11 close.
Is ASTS expected to go up or down over the next five days? Options positioning as of September 11 leans slightly bullish — short-dated call open interest is building and call-side sweeps dominated the tape — but that's a read of what traders have done, not a forecast. Both chart models read the opposite way, targeting $58.10–$58.60. The actionable map is the $54.33–$65.39 range and the $60.00 / $65.00 levels.
Are ASTS options expensive right now? No — on both lenses. IV rank of 5.71/100 says option prices are lower than about 94% of the past year's readings, and on top of that they're running roughly 7.5 vol points below the movement ASTS has actually delivered, a gap that ranks around the 53rd percentile of this stock's own recent readings. That combination favors owning premium, not collecting it.
Where is ASTS's biggest options support and resistance? For the September 18 expiration, the put wall is $60.00 (6,209 contracts) — where spot is sitting right now. The expiration's own call wall prints at $125.00 but is far too remote to function as resistance; the practical ceiling is $65.00, the max-pain and heaviest-gamma strike, then $70.00, the whole chain's heaviest call strike.
What invalidates this week's read? A close below $55.70.
Methodology & disclosures. Data: end-of-day options-chain snapshot for ASTS, 2026-09-11, generated 2026-09-13T19:39:34.602Z. Prices shown are midpoints and will differ from live markets. Momentum/positioning scores and volatility-premium comparisons are descriptive measurements of past option flow and past price movement — not investment advice, signals, forecasts, or guarantees. All trade structures are hypothetical. Every structure shown has a defined maximum loss; you can lose the entire max-loss amount. Options involve substantial risk and are not suitable for all investors.