ASTS Options Outlook: Will the $30 Put Wall Hold Through November 20?
ASTS options imply a $27.80–$37.40 range into the November 20 expiration, and positioning reads neutral. Here's what is driving that read, where the key levels sit, and three defined-risk ways to trade it.
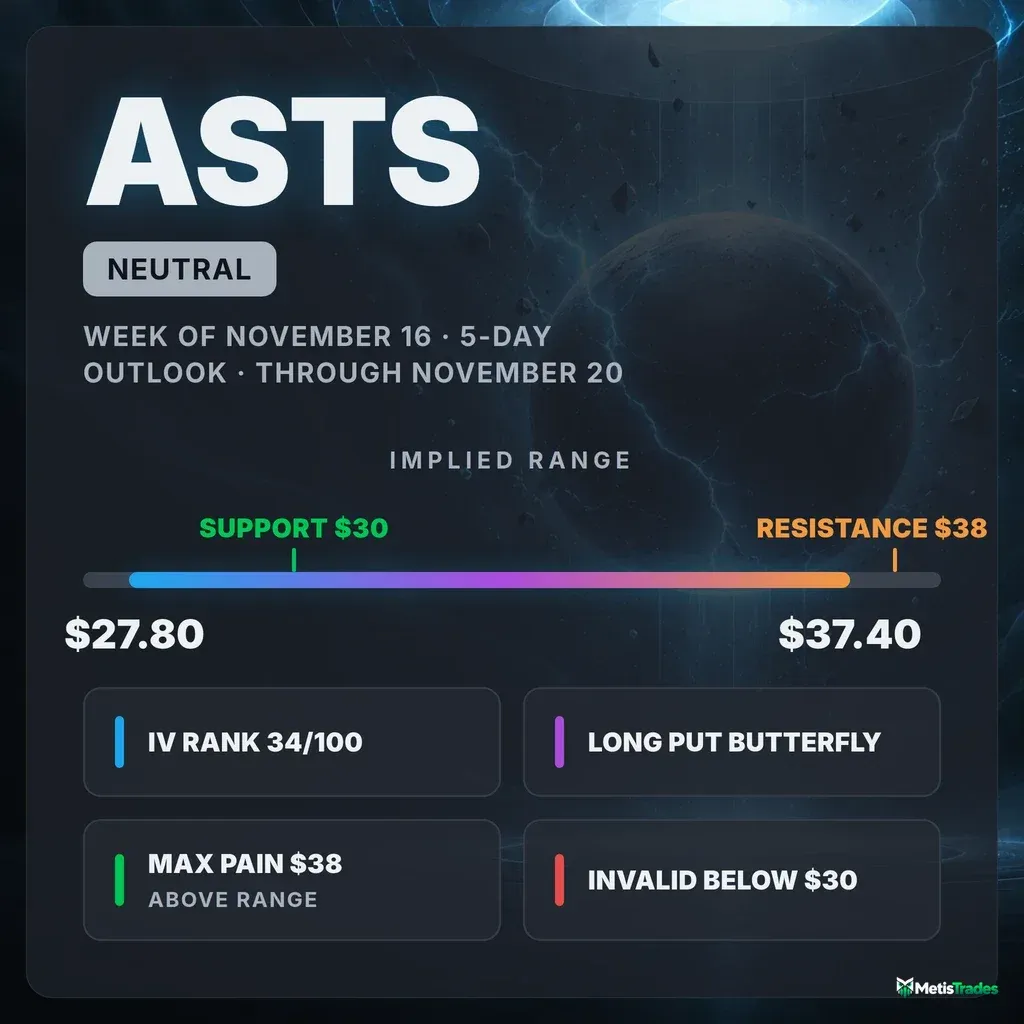
The options market implies a $27.80–$37.40 range into the November 20 expiration. Below: what's driving it, where the levels sit, and three defined-risk ways to trade it.
Published Sunday, November 15, 2026 · Data as of Friday, November 13, 2026 close
Explore the live ASTS options data in the Detailed Options Analyzer →
Quick answer
| Item | Answer |
|---|---|
| Market bias | Neutral |
| Options-implied range (into November 20) | $27.80 – $37.40 (±14.73%, ±$4.80) |
| Major support | $30.00 (put wall, November 20 expiration) |
| Major resistance | $38.00 (call wall, November 20 expiration) |
| Max pain (November 20) | $38.00 |
| Dealer gamma regime (estimate) | Negative: hedging tends to amplify moves. Flip level ≈ $15 |
| Volatility condition | Falling over five sessions (IV −16%), still above its 30-day average. IV rank 34/100. Premium thin: options priced ~12 vol pts below delivered movement |
| Technical check | Mixed (bearish chart model, 3-day target $31.80 and 5-day target $31.60, both inside the implied range) |
| Best-fitting strategy | Long put butterfly centered at $33 (November 20), fits only if the range holds |
| Analysis invalidated if | ASTS closes below $30.00 |
1 · What matters today
Our read of ASTS options positioning is neutral. The bearish flow of the past two weeks has faded to roughly flat. Put buyers are still active, but calls are now priced richer than puts. The stock closed at $32.60 on Friday, November 13.
The options market is pricing a move of about $4.80 either way by the November 20 expiration, which gives a range of $27.80 to $37.40. That figure is the expected move: the move the options market is pricing in, derived from what straddles cost.
The level that changes the picture is $30. It is the strike with the most open put contracts in this expiration and across the whole chain. A close below it removes the market's main floor.
The chart model leans bearish, with a $31.60 target for November 20. That target still sits comfortably inside the range the options market is pricing.
2 · What the options market is pricing
What changed this week
The stock itself went almost nowhere over five sessions, up 0.84%. Underneath that, the options market changed a lot:
- Implied volatility fell. It dropped 16.3% over the past five snapshots. IV rank slid to 34, against a 7-day average of 42.6. Traders have been paying less for movement even though the stock keeps lurching around.
- Put volume rose. For every call contract traded on Friday, about 1.03 puts changed hands. The 7-day average is 0.83 and the 14-day average is 0.76, so put trading is running heavier than normal for this name.
- Open puts edged up. The put/call open-interest ratio rose to 0.86, from a 7-day average of 0.80.
- The flow read turned. Our options-flow read was solidly put-heavy for most of the past two weeks, averaging −36 on a ±100 scale over seven sessions. On Friday it printed −2, essentially neutral.
- The biggest single open-interest change looks like closing. It was 2,745 contracts leaving the January 15, 2027 $80 puts. Those puts are deep in the money, so this looks like traders closing old protection rather than new bearish bets.
The short-term pause sits inside a trend that is still clearly down. ASTS fell 19.8% over roughly the past month and 47.5% over roughly the past 50 sessions. The short-term read is flat, but the bigger picture hasn't turned.
Expected move
Into the November 20 expiration, the options market is pricing a move of ±14.73%, or about $4.80 either way from $32.60. That is the move the options market is pricing in, derived from what straddles cost. It gives a range of $27.80 to $37.40. Here is how that range widens further out:
| Expiration | Implied move | Range around $32.60 |
|---|---|---|
| November 20 | ±14.73% | $27.80 – $37.40 |
| November 27 | ±19.51% | $26.24 – $38.96 |
| December 4 | ±23.68% | $24.88 – $40.32 |
| December 11 | ±27.71% | $23.57 – $41.63 |
The rungs widen in a smooth square-root pattern, with no unusual step between any two expirations. In other words, the market isn't pricing a specific dated event inside this ladder, just a persistently volatile stock.
Volatility
Where IV sits. At-the-money implied volatility is 101.64%. Implied volatility is the market's estimate of how much ASTS will move, baked into option prices. IV rank is 34/100, meaning today's IV sits about a third of the way up its 52-week range. It is higher than only about 41% of the past year's daily readings, so options are cheaper than most of the past year.
Direction.
- IV rose 4.3% on Friday but is down 16.3% over five sessions.
- It is still up 42.8% versus 30 sessions ago.
- It is above both its 30-day average (94.0%) and its 90-day average (91.0%).
Term structure. Term structure means comparing option prices across different expiration dates. The front-month read is unavailable today because Friday was an expiration day, so the near-term IV can't be measured from same-day contracts.
The stock has been moving more than usual, compared against its own recent history. ASTS's 20-day realized volatility is about 113%, well above its norm. The 10-day figure is 152%, so the past two weeks have been even wilder than the past month.
Premium is thin, not rich. The volatility risk premium is the gap between how much movement options are priced for and how much ASTS has actually delivered. When it's positive, option sellers have been collecting more than realized movement cost them. Right now it is negative.
- Options are priced about 12 vol points below the stock's 20-day realized movement.
- That gap sits at the 13th percentile of this stock's own recent readings, thinner than about 87% of them and unusually thin for this name.
- The path matters. As recently as November 5 options were about 32 points above realized movement. The gap flipped negative on November 10.
- That flip is largely mechanical. The violent early-November down days entered the 20-day realized-vol window and inflated the realized side.
Put together, IV rank 34 and a 13th-percentile premium over delivered movement favor owning premium through debit structures rather than collecting it this week.
Skew and sentiment
Skew means that puts and calls the same distance from the stock price don't cost the same. When puts are pricier, traders are paying up for crash protection. ASTS has the opposite tilt right now:
- 25-delta calls trade at 103.2% IV versus 95.4% for puts, so calls cost about 7.8 vol points more.
- This name's 60-day norm is calls about 3.9 points richer.
- Over the past week, puts averaged about 5.8 points richer than calls.
- In five sessions, the put premium bled out and flipped to a call premium, a swing that is stretched versus ASTS's own history. Fear of further downside eased fast in how options are priced.
Activity tells a different story. The put/call volume ratio measures how much put activity there is relative to calls, and above 1 means puts dominate. It hit 1.03, unusually put-tilted for ASTS. Option pricing has relaxed, but traders were still actively trading puts on Friday.
Sentiment in short-dated options is split:
- 0–7 day expirations: bearish (−22). Put open interest grew there.
- 7–30 day window: bullish (+37). Calls are priced about 11 vol points richer than usual.
The overall regime reads "Mixed." That is the core of our neutral call.
The key levels map
Open interest means contracts currently held open. A call wall or put wall is the strike with the biggest pile of open call or put contracts, and these often act like magnets or barriers. Max pain is the price where the most option value would expire worthless, and expirations sometimes gravitate toward it.
| Level | Price | Why it matters |
|---|---|---|
| Swing resistance | $44.85 | Next price-structure ceiling above the walls |
| Call wall (whole chain) | $40.00 | 16,429 open calls across all expirations, the larger overhead pile |
| Call wall + max pain (November 20) | $38.00 | 6,430 open calls in this expiration; also where the most November 20 option value would expire worthless |
| 20-day moving average | $37.81 | Price is 13.8% below it, a short-term trend ceiling |
| Implied range top (November 20) | $37.40 | Upper edge of the straddle-priced move |
| Swing resistance | $36.72 | Recent pivot high where rallies stalled |
| Large gamma strike | $35.00 | Heavy combined call and put interest; a hedging hot spot |
| Close | $32.60 | Friday, November 13 close |
| Put wall (November 20 and whole chain) | $30.00 | 7,469 open puts this expiration, 23,771 chain-wide; the largest gamma strike in the file |
| Implied range bottom (November 20) | $27.80 | Lower edge of the straddle-priced move |
| 52-week low / swing support | $27.58 | The last structural floor below the walls |
| Gamma strike | $25.00 | Large put concentration further out the curve |
| Gamma flip (estimate) | ≈ $15 | Rough estimate only; far from price this window |
One quirk stands out: max pain for November 20 sits at $38, well above the stock. Most open option value in this expiration was struck at higher prices from before the recent slide. That doesn't make $38 a target, but it explains why the overhead call strikes are so crowded.
Positioning and unusual flow
Dealer gamma (estimate). Market makers hedge the options they've sold. One rough estimate, built on an assumed convention for how dealers are positioned, puts both the November 20 expiration and the whole chain in negative gamma. In this regime their hedging tends to amplify moves rather than dampen them.
The gamma flip level is the price below which market-maker hedging tends to accelerate selling rather than cushion it. Its estimate sits near $15, far below the price, so it isn't a pivot that matters in this window. The practical takeaway is simply that moves can run further than the walls alone suggest.
Three non-expired items stood out on Friday:
- November 20 $35 calls. 2,612 contracts traded against 1,287 open, about $260,000 in premium. That was the heaviest live-contract dollar flow in the chain. It is someone positioning for, or hedging against, a bounce back toward $35 inside five sessions.
- November 20 $36 calls. 1,250 traded, and open interest rose 314 contracts to 996. That is heavy for this strike relative to its peers, and fresh call buying sits just below the $36.72 swing high.
- December 18 $20 puts. 2,053 traded against 808 open, about 2.5× the existing open interest. This is cheap, far-out-of-the-money crash protection a month out. The near-term call bets above and these tail puts below fit the "Mixed" read.
Into Friday's November 13 expiration, the expiring $35 puts added 1,785 contracts of open interest and traded 2,227 times. That is settled history now, but it shows how much hedging was concentrated just above the price as that expiration closed.
3 · Technical check
3-day report (target November 18). Our chart model is bearish, with a $31.80 target and a projected range of $30.20 to $33.70. Its reasons:
- Price sits below both its short moving averages.
- MACD turned negative on Friday.
- Sellers hold the directional edge on ADX, though ADX at 20 and falling says the trend is weak, not accelerating.
Against a neutral options read, the direction diverges. But the target sits inside the options-implied range, so we classify the 3-day read as Mixed.
5-day report (target November 20). Also bearish, with a $31.60 target and a $29.60–$34.20 projected range. It cites support at $31.16 (the lower Bollinger Band) and resistance at $33.44. Its dominant scenario is a bear-flag breakdown toward $29.80–$30.50, invalidated by a close above $34.30. That breakdown target lands right on the $30 put wall, the strike the options market has defended most heavily. The model's downside case and the options floor point at the same price.
Model vs. Market: The options market implies $27.80–$37.40 into November 20; the 5-day technical model targets $31.60. The model's call for a $1 drift lower is noise by options pricing. The real test is whether a close below $31.16 can carry through the $30 put wall.
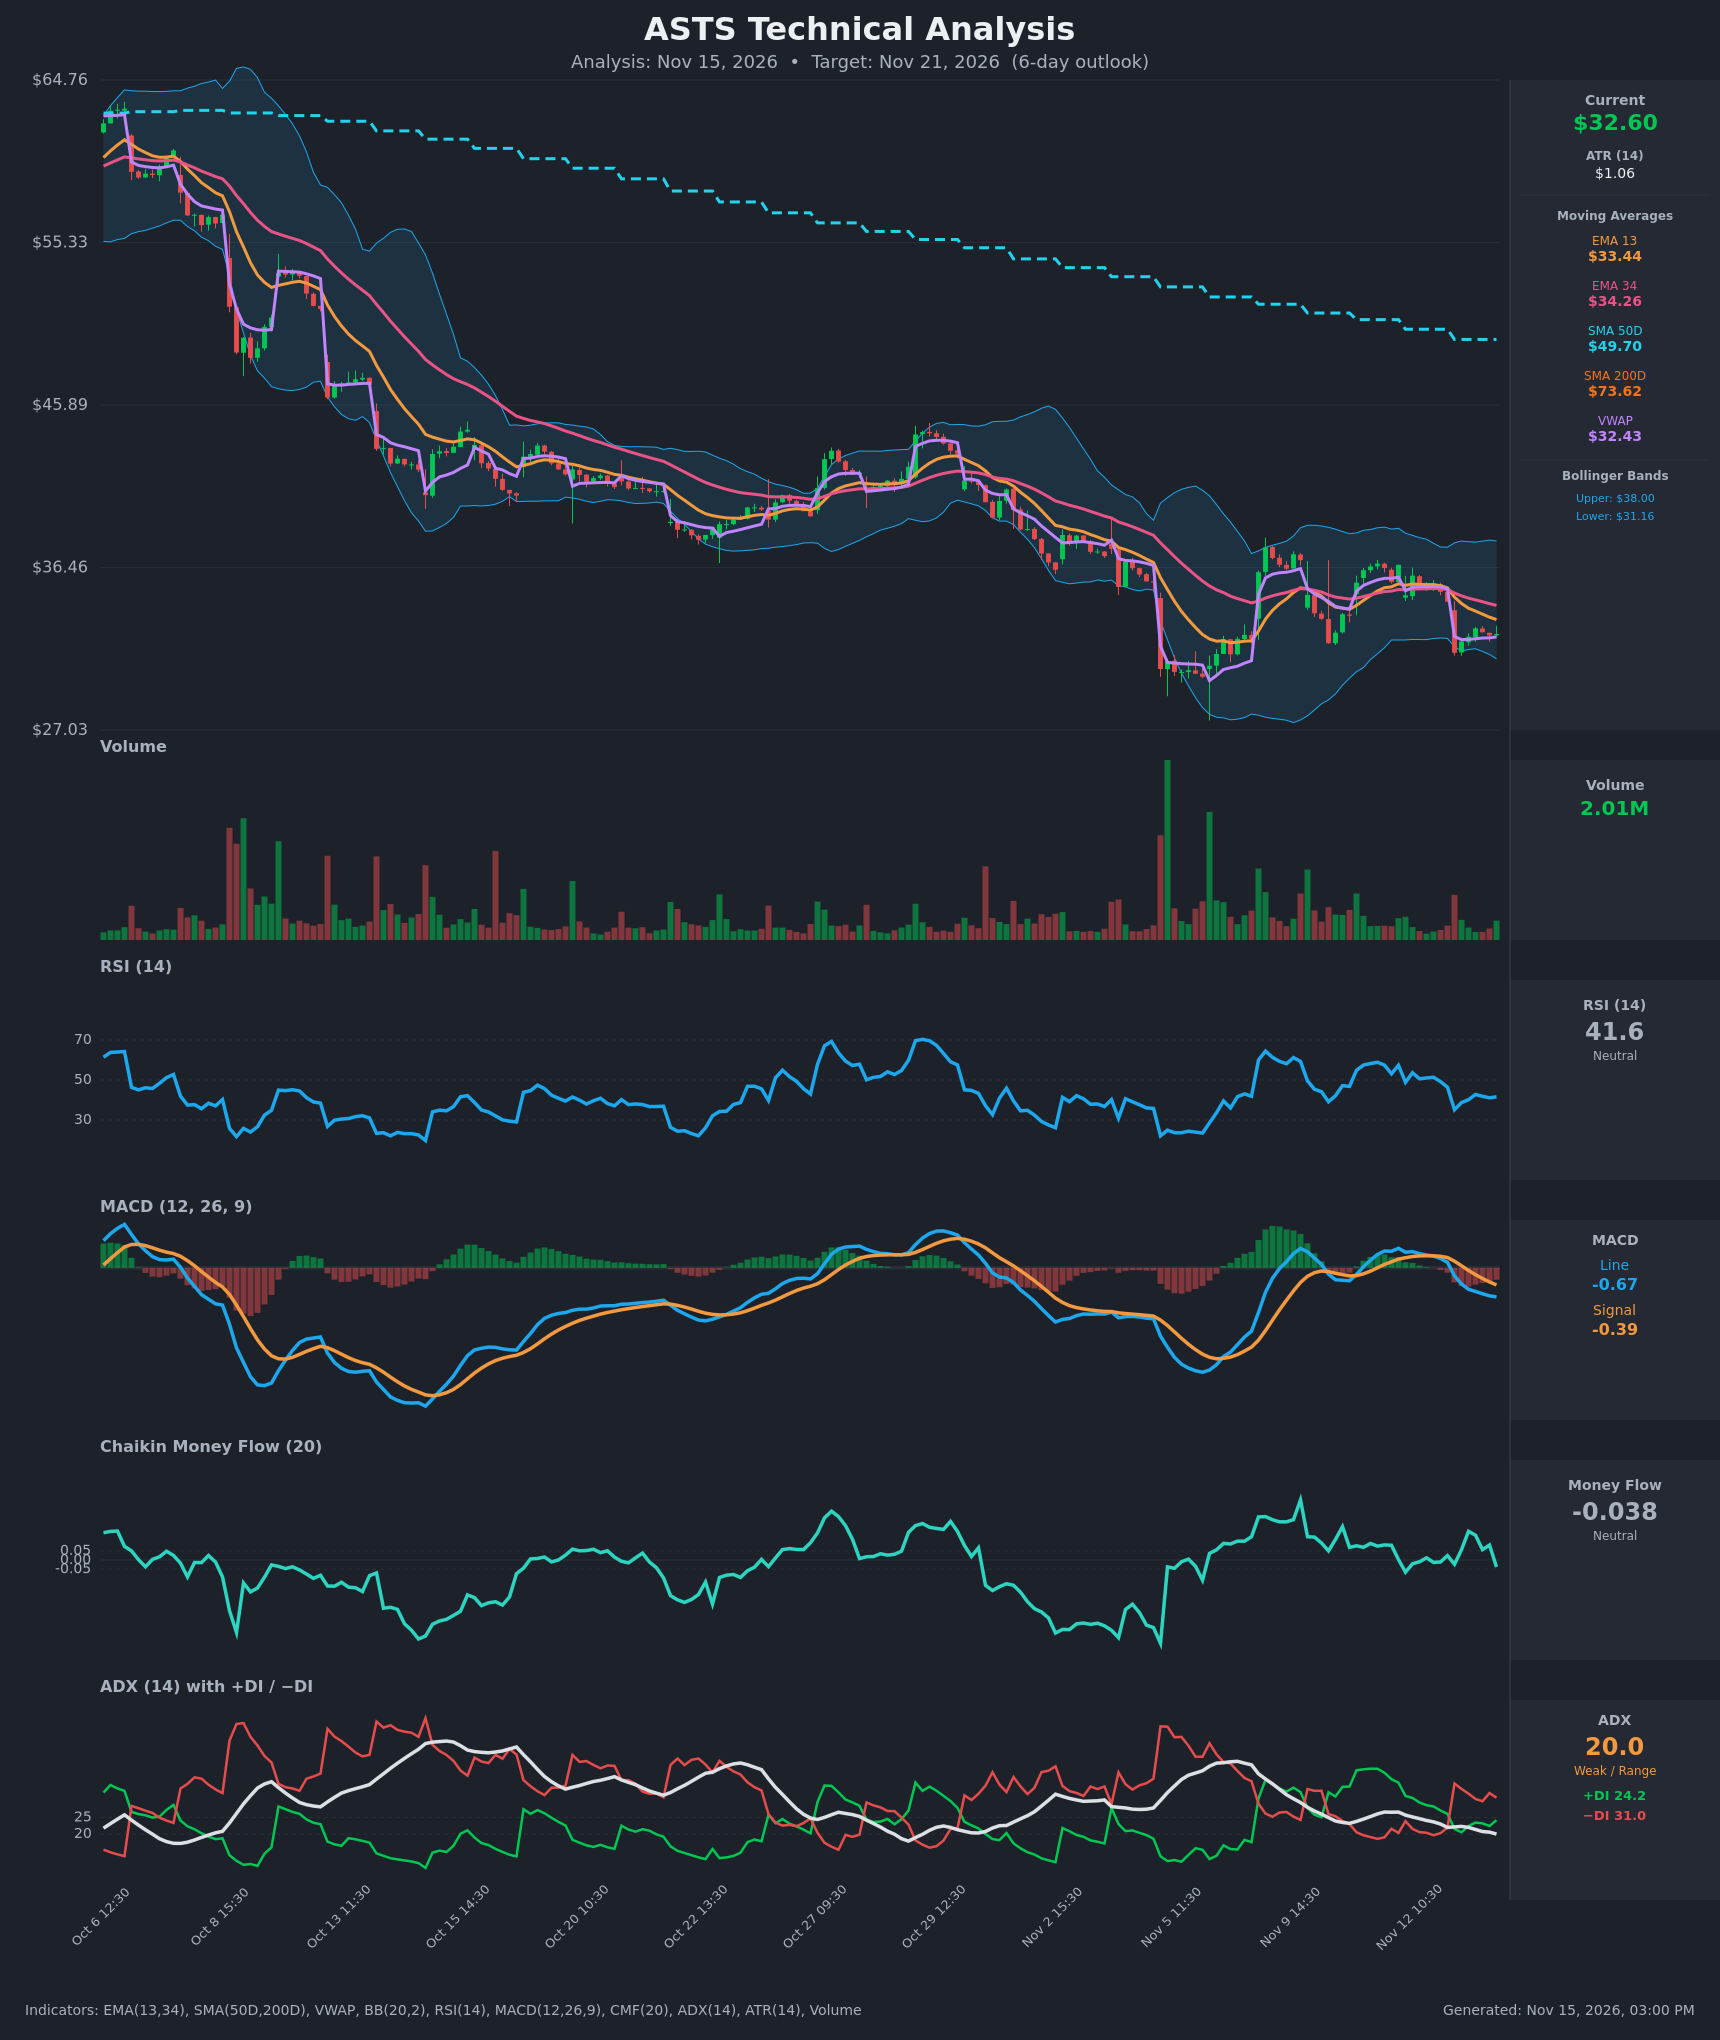
The TA shaded strike selection in two places. The bearish spread's short strike sits at $30, matching the model's target zone. The butterfly is centered at $33, between the $32.43 VWAP and the model's $33.44 resistance.
Full technical write-ups: 3-day report → · 5-day report →
4 · Three ways the next five days can go
If ASTS pushes above the call wall ($38): That would take price through the $36.72 swing high, the $37.40 edge of the implied range and the $37.81 20-day average first. Positioning-wise, the heaviest call stack in this expiration sits at $38, and big call piles tend to slow rallies as hedgers sell into strength. A clean break leaves the whole-chain wall at $40 as the next pile overhead. In a negative-gamma regime, a squeeze through these levels can move faster than usual.
If ASTS drifts between the walls ($30–$38): This is the base case, and the one our neutral read leans on. Heavy puts at $30 have attracted buyers on dips in recent sessions. Fresh call interest at $35–$36 marks where upside bets are concentrated. Max pain at $38 sits overhead, but with five sessions left it is more a reminder of where the open interest was struck than a level price is likely to reach. A grind in the low-to-mid $30s fits both the flat flow read and the chart model's "chop" scenario.
If ASTS breaks below the put wall ($30): The largest put concentration in the chain gives way. Positioning thins out until the $27.80 bottom of the implied range and the $27.58 52-week low. With the dealer-gamma estimate negative, hedging tends to add to selling rather than absorb it. A break here would also confirm the chart model's flag breakdown. The gamma flip estimate itself (~$15) is far away, so this branch is about thin support, not a single trigger level.
5 · Three defined-risk structures
Prices are end-of-day midpoints as of November 13, 2026. All structures are hypothetical. Verify live prices before trading, because these will be stale by the open.
Option premium is priced below what ASTS has actually delivered, so all three ideas below are debit structures: you pay a defined amount up front and can lose no more than that. We are not featuring an iron condor this week. You'd be selling premium that hasn't been rich lately, into a negative-gamma regime.
If you expect the range to hold: long put butterfly
- Trade: Buy 1 November 20 $31 put, sell 2 November 20 $33 puts, buy 1 November 20 $35 put.
- Debit: $0.275 ($27.50 per butterfly).
- Max profit: $172.50 if ASTS closes at exactly $33 on November 20.
- Max loss: $27.50.
- Break-evens: $31.28 and $34.73.
- Why it fits:
- The flow read is flat and the short-dated sentiment is split.
- The $30 put wall gives a floor beneath the profit zone.
- Premium is thin, which favors defined-cost debit structures.
- A butterfly is a cheap way to express "stuck between $31 and $35."
- Makes sense only if: You accept a low-cost, low-probability payoff that needs price to settle near $33. ASTS is pricing a $4.80 move, so the profitable zone is narrower than the expected move.
- Invalidated if: ASTS closes below $30.00. Also treat a close above $35 as a broken thesis.
- Managing it: Take profits at 2–3× the debit if price sits near $33 into November 18 or 19. Butterflies gain most in the final two sessions. Don't add to it if price leaves the $31–$35 zone.
- Liquidity note: The $31 puts trade 26¢ wide, the $33 puts 18¢ and the $35 puts 25¢. All are well above 5% of their mid, and the combined slippage can exceed the 27.5¢ debit. Work the order as a single spread at or near mid, or skip it.
- Analyze this position →
If you lean bearish: put debit spread
- Trade: Buy the November 20 $32.50 put, sell the November 20 $30 put.
- Debit: $0.98 ($98).
- Max profit: $152 if ASTS closes at or below $30.
- Max loss: $98.
- Break-even: $31.52.
- Why it fits:
- Both chart models lean bearish, with targets of $31.80 and $31.60.
- The bigger trend is down 19.8% over about a month.
- Put trading is unusually heavy for ASTS.
- Capping the payout at the $30 put wall means you aren't paying for a breakdown that heavy put interest has kept from developing so far.
- Makes sense only if: Rebounds keep stalling below the $33.44–$34.30 moving-average zone.
- Invalidated if: ASTS closes above $34.30.
- Managing it: The short-term trend reads flat even though the longer trend is down, so keep it short-dated and take profits early. Close at ~50–60% of max profit. Reassess at the November 18 checkpoint and exit if the stock is above $33.
- Liquidity note: The $32.50 puts trade 13¢ wide and the $30 puts 11¢ wide, about 7% and 13% of mid. Fills are workable, but expect some slippage.
- Analyze this position →
If you lean bullish: call debit spread
- Trade: Buy the November 20 $33 call, sell the November 20 $36 call.
- Debit: $0.98 ($98).
- Max profit: $202 if ASTS closes at or above $36.
- Max loss: $98.
- Break-even: $33.98.
- Why it fits:
- Calls are now priced richer than puts.
- Put protection bled off sharply this week.
- Fresh call buying landed at $35 and $36 for this exact expiration.
- The short strike sits below the $36.72 swing high and the $38 call wall, so the target stays inside the levels positioning can plausibly reach.
- Makes sense only if: ASTS reclaims $33.44 early in the window. The chart model's relief-bounce trigger is $33.45.
- Invalidated if: ASTS closes below $31.16.
- Managing it: This trade fights the longer-term downtrend. Take 50% of max profit if offered, and close by November 18 if price hasn't cleared $34.
- Liquidity note: The $33 calls trade 19¢ wide and the $36 calls 11¢ wide, about 11% and 15% of mid. Enter as a spread with a limit at mid.
- Analyze this position →
If none of these: no trade
Standing aside is a reasonable call this week, for four reasons:
- Our positioning read is genuinely neutral, so neither debit spread has a clear directional edge.
- Realized volatility is running well above its norm, and the dealer-gamma estimate says moves can overshoot. A five-session trade in this stock can go from winner to max loss in a single gap.
- Recent daily open gaps have run as large as 7%.
- Every November 20 strike above trades wider than 5% of mid, so execution costs eat a large share of any edge.
Options aren't rich enough to sell here. If you can't watch the position daily through November 18, waiting for a decisive break of $30 or reclaim of $34.30 is a legitimate plan.
6 · Quick FAQ
What is ASTS's expected move this week? About ±$4.80 (±14.73%) into the November 20 expiration, a range of $27.80 to $37.40. That is per the options market's straddle pricing as of November 13.
Is ASTS expected to go up or down over the next week? Options positioning as of November 13 leans neutral. Bearish flow faded to flat while calls became pricier than puts, but put trading remains heavy. That's a read of what traders have done, not a forecast. The actionable map is the $27.80–$37.40 range and the $30 support and $38 resistance levels.
Are ASTS options expensive right now? Not really. IV rank is 34/100, so implied volatility sits about a third of the way up its 52-week range. On top of that, options are running about 12 vol points below the movement ASTS has actually delivered, thinner than roughly 87% of this stock's own recent readings. That combination favors buying premium over selling it.
Where is ASTS's biggest options support and resistance? For November 20, the put wall is $30 and the call wall is $38, with max pain also at $38. Across the whole chain, the call wall is $40 and the put wall is $30.
What invalidates this week's read? A close below $30.00, the put wall that anchors the range.
Methodology & disclosures. Data: end-of-day options-chain snapshot for ASTS, 2026-11-13, generated 2026-11-15T15:00:29.192Z. Prices shown are midpoints and will differ from live markets. Momentum/positioning scores and volatility-premium comparisons are descriptive measurements of past option flow and past price movement — not investment advice, signals, forecasts, or guarantees. All trade structures are hypothetical. Every structure shown has a defined maximum loss; you can lose the entire max-loss amount. Options involve substantial risk and are not suitable for all investors.