BAC Options Are Pricing a $1.67 Move Into September 25 — And the Chart Model Disagrees
Bank of America's options market implies a $56.06–$59.40 range into the September 25 expiration, with positioning leaning modestly higher even as the chart model targets $56.90. Here's the level that settles the argument, plus three defined-risk ways to trade it.
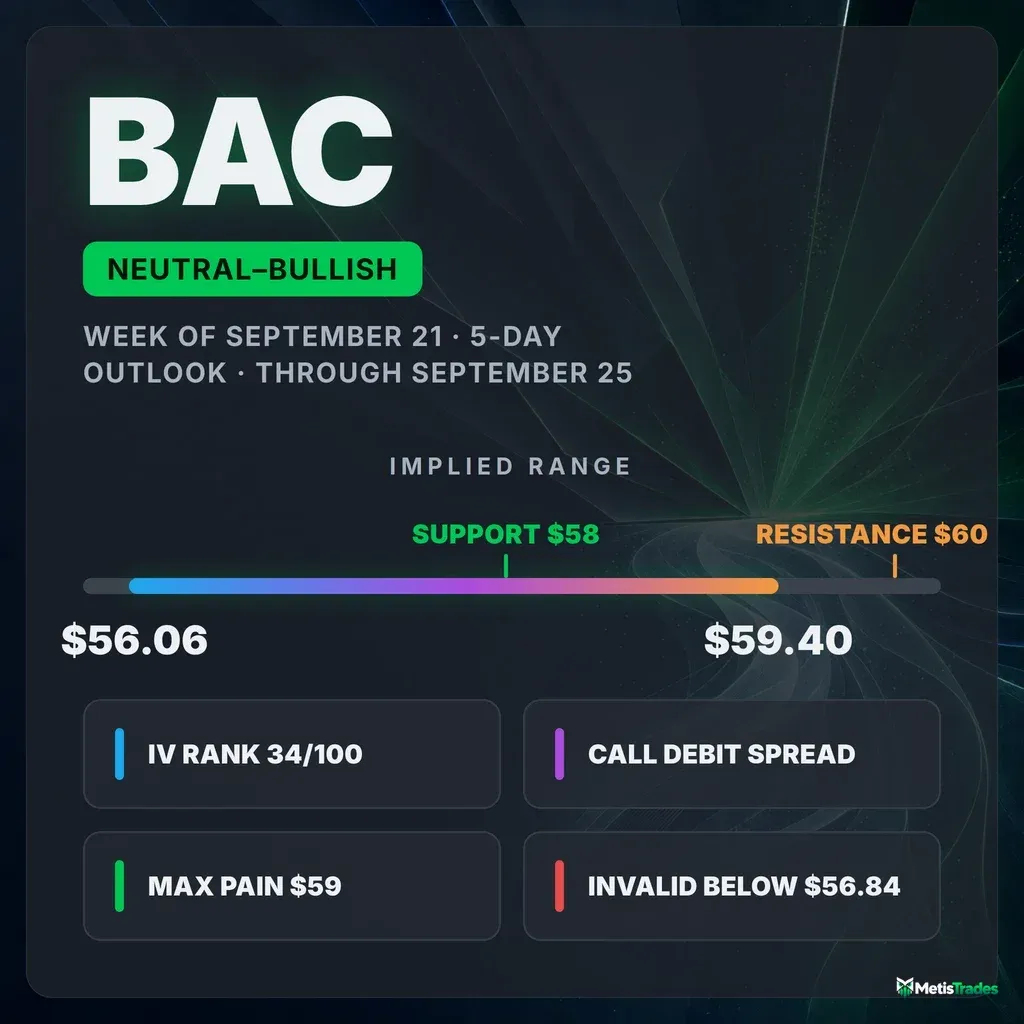
The options market implies a $56.06–$59.40 range into the September 25 expiration; here's what's driving it, where the chart model fights it, and three defined-risk ways to trade the gap.
Published Sunday, September 20, 2026 · Data as of the Friday, September 18 close
Explore the live BAC options data in the Detailed Options Analyzer →
Quick answer
| Item | Answer |
|---|---|
| Market bias | Neutral-bullish (slightly bullish lean) |
| Options-implied range (into September 25) | $56.06 – $59.40 (±2.89%, or ±$1.67) |
| Major support | $58.00 (September 25 put wall) |
| Major resistance | $60.00 (September 25 call wall) |
| Max pain (September 25) | $59.00 |
| Dealer gamma regime (estimate) | Positive for the September 25 expiration — hedging tends to dampen moves; the chain-wide flip estimate sits up at ≈ $65.00 |
| Volatility condition | Elevated but easing — IV rank 34/100 · premium thin: options priced about 1.3 vol points above delivered movement |
| Technical check | Diverges (bearish, 3-day and 5-day chart models) |
| Best-fitting strategy | September 25 $58/$60 call debit spread, conditional on price reclaiming $58 |
| Analysis invalidated if | BAC closes below $56.84 |
1 · What matters today
Bank of America closed Friday, September 18 at $57.73 after an ugly stretch — down 7.9% over five sessions. Yet the options chain is not confirming the panic. Call open interest grew while puts thinned, the extra cost of downside protection shrank versus its own two-month norm, and sentiment across the 7-to-60-day expirations reads firmly call-tilted. Our blended read of that flow lands slightly bullish, which is a lean and not a promise.
The options market is pricing a move of roughly $1.67 either way into the September 25 expiration — a $56.06 to $59.40 range. The single level that decides the week is $58.00: the strike holding the most put open interest for that expiration, sitting just above Friday's close. Reclaim it and the $59.00 max-pain magnet comes into play. Fail it and the chart models, which are outright bearish here, own the tape. That disagreement is this week's story.
2 · What the options market is pricing
What changed this week
Price did most of the changing: BAC is down 7.91% over the trailing five sessions and 6.68% over twenty, with Friday's 52.4 million shares running 1.45× the 20-day average volume. Implied volatility — the market's estimate of how much BAC will move, baked into option prices — rose 11.5% over five days and 22.3% over thirty, though it slipped 1.2% on Friday itself, the first sign of the volatility bid cooling.
Positioning moved the other way. Friday's session added 19,094 contracts of call open interest against a 7,679-contract drop in put open interest ("open interest" is simply contracts currently held open). The put/call open-interest ratio sits at 1.04 — for every call held open there are 1.04 puts — essentially unchanged against its 14-day average of 1.04 and slightly below its 7-day average of 1.07. In other words, five days of heavy selling in the stock produced no net build in downside hedges. The single biggest live open-interest change was the October 16 $60 calls, up 7,888 contracts to 25,481 on 1,914 lots traded. For the settled-history record: into Friday's expiration, the September 18 $60 puts shed 10,950 contracts of open interest as they expired.
Our leading positioning read — the composite built only from flow, skew and term-structure inputs — climbed from −31 on September 14 to +18 on Friday while the stock kept slipping. That divergence between price and positioning is what drags the headline bias off neutral. Against it: the short-term (about a week) and medium-term (about a month) trend reads both point bearish, with the longer 50-day read flat, so the trend engine and the flow engine are not saying the same thing — a reason to favor short-dated structures and to bank profits early rather than ride them.
Expected move
Into the September 25 expiration, the chain prices a ±2.89% move — about $1.67 either side of $57.73, or $56.06 to $59.40. That figure is the move the options market is pricing in, derived from what at-the-money straddles cost.
| Expiration | Implied move | Range around $57.73 |
|---|---|---|
| September 25 (7 days) | ±2.89% | $56.06 – $59.40 |
| October 2 (14 days) | ±4.27% | $55.27 – $60.20 |
| October 9 (21 days) | ±5.16% | $54.75 – $60.71 |
| October 16 (28 days) | ±7.18% | $53.59 – $61.88 |
The rungs scale roughly with time until the last one: the October 16 monthly prices a 25.9% at-the-money implied volatility versus 21.5% for October 9, which is why its implied range widens more than the extra week alone would justify. That monthly is also where the chain's heaviest near-dated open interest sits.
Volatility
At-the-money implied volatility is 25.51%, with an IV rank of 34/100 — where today's IV sits versus the past year, so option prices are cheaper than about 66% of the past year's readings. It is, however, well above BAC's own recent baselines: the 30-day average is 21.4% and the 90-day average 23.8%, and the 52-week percentile reads 48.8. The front-month read is unavailable today because Friday was an expiry day, so the usual comparison of option prices across expiration dates cannot be computed from this snapshot.
Two "vs its own norm" readings stand out — compared against this stock's own recent history, not the broader market. Realized volatility over the past 20 days, at 24.2%, is running well above BAC's recent norm, and the 5-day-versus-20-day realized ratio at 1.56 says movement has been accelerating sharply into the selloff. The stock has genuinely gotten faster; the options have merely kept pace.
Premium rich or cheap: the gap between how much movement options are priced for and how much BAC has actually delivered — the volatility risk premium — sits at about 1.3 vol points. When that gap is positive, option sellers have been collecting more than realized movement cost them. But this reading lands in the 11th percentile of the stock's own recent history: today's gap is thinner than about 89% of recent readings. A week ago it was above 7 vol points; realized movement has since caught up and all but erased the cushion. That combination — a middling IV rank of 34 and a premium over delivered movement near the bottom of its own range — argues for owning premium rather than selling it this week, which is why the debit structures lead the trade section below.
Skew and sentiment
Puts and calls the same distance from the stock price don't cost the same — when puts are pricier, traders are paying up for crash protection. Here 25-delta puts carry 26.34% implied volatility versus 24.56% for the matching calls, a 1.8 vol-point premium against a 60-day median of 2.3 points and a 14-day average of 2.6. Downside protection is cheaper relative to calls than it has been all quarter, and that flattening has been steady — the skew has bled off about 1.2 vol points over five sessions. Complacency, or genuine disinterest in chasing puts after a 7.9% drop; either way it is not what a market bracing for more downside usually looks like.
Put/call volume finished Friday at 0.67 — how much put activity there is relative to calls, with above 1 meaning puts dominate — versus a 7-day average of 0.70 and a 14-day average of 0.60. Total option volume ran at just 0.54× its 20-day average, so this was a quiet tape, not a capitulation tape. Sentiment in short-dated options reads +18 in the 0–7 day bucket and +36 in the 7–30 day bucket, with the 30–60 day bucket isolated at +67 — call-tilted across the curve, with the heaviest lean parked one to two months out.
The key levels map
| Level | Price | Why it matters |
|---|---|---|
| 52-week high | $65.23 | 11.5% overhead; not in play this window |
| Whole-chain heaviest call strike · gamma flip (estimate) | $65.00 | 127,844 calls across all expirations; one rough estimate also places the chain-wide hedging pivot here |
| Swing resistance | $62.56 | Prior consolidation floor before the breakdown |
| 50-day moving average | $61.94 | Price sits 6.8% below it |
| 20-day moving average | $61.38 | Price sits 5.9% below it |
| Call wall, September 25 | $60.00 | 13,781 calls — the heaviest call open interest for this expiration; these often act like a ceiling |
| Top of the implied range | $59.40 | One standard deviation up by Friday's close |
| Max pain, September 25 | $59.00 | The price where the most option value would expire worthless; expirations sometimes gravitate toward it |
| 100-day moving average | $58.06 | Price is 0.58% below — the first real trend test |
| Put wall, September 25 | $58.00 | 3,131 puts — heaviest put open interest for this expiration, and it sits above Friday's close |
| Friday's close | $57.73 | Reference price for every figure above |
| Nearest swing support | $56.84 | The kill switch for this week's read |
| Bottom of the implied range | $56.06 | One standard deviation down by Friday's close |
| 200-day moving average | $55.24 | Price is 4.5% above; the long-term trend line both chart models point toward |
| Whole-chain heaviest put strike | $55.00 | 136,287 puts across all expirations — a much deeper floor than this week's |
Note the mismatch worth naming: the September 25 expiration's own walls are $58 and $60, a narrow two-dollar corridor. The whole chain's heaviest strikes are far wider at $55 and $65. Quote the tight pair for this week; the wide pair only matters if the stock travels.
Positioning and unusual flow
Market makers hedge the options they've sold, and the dealer-gamma figure here is an estimate, not observed inventory. By that estimate the September 25 expiration carries a positive net gamma — in that regime hedging tends to dampen moves and pull price toward the big strikes rather than amplify away from them. The same rough model puts the chain-wide flip level up at $65, above spot, which by its own logic places BAC on the more fragile side of the chain-wide pivot; the per-expiration read is the one that governs the next five sessions.
Three live flow items stood out on Friday. The September 25 $58 calls traded 3,105 contracts against 1,853 open — $172,327 of premium changing hands right at the reclaim level. The September 25 $59 calls traded 3,861 contracts on 10,853 open, adding 1,381 contracts of open interest, with buyers clustering at max pain. And the September 25 $62 calls printed 1,789 contracts at the 100th percentile versus comparable peer contracts — far out of the money, but a genuine outlier for this name. On the other side, the October 16 $55 puts traded 3,572 contracts for $219,678 of premium, the largest single dollar-premium put line on the board: someone is buying protection, just a month out rather than this week.
3 · Technical check
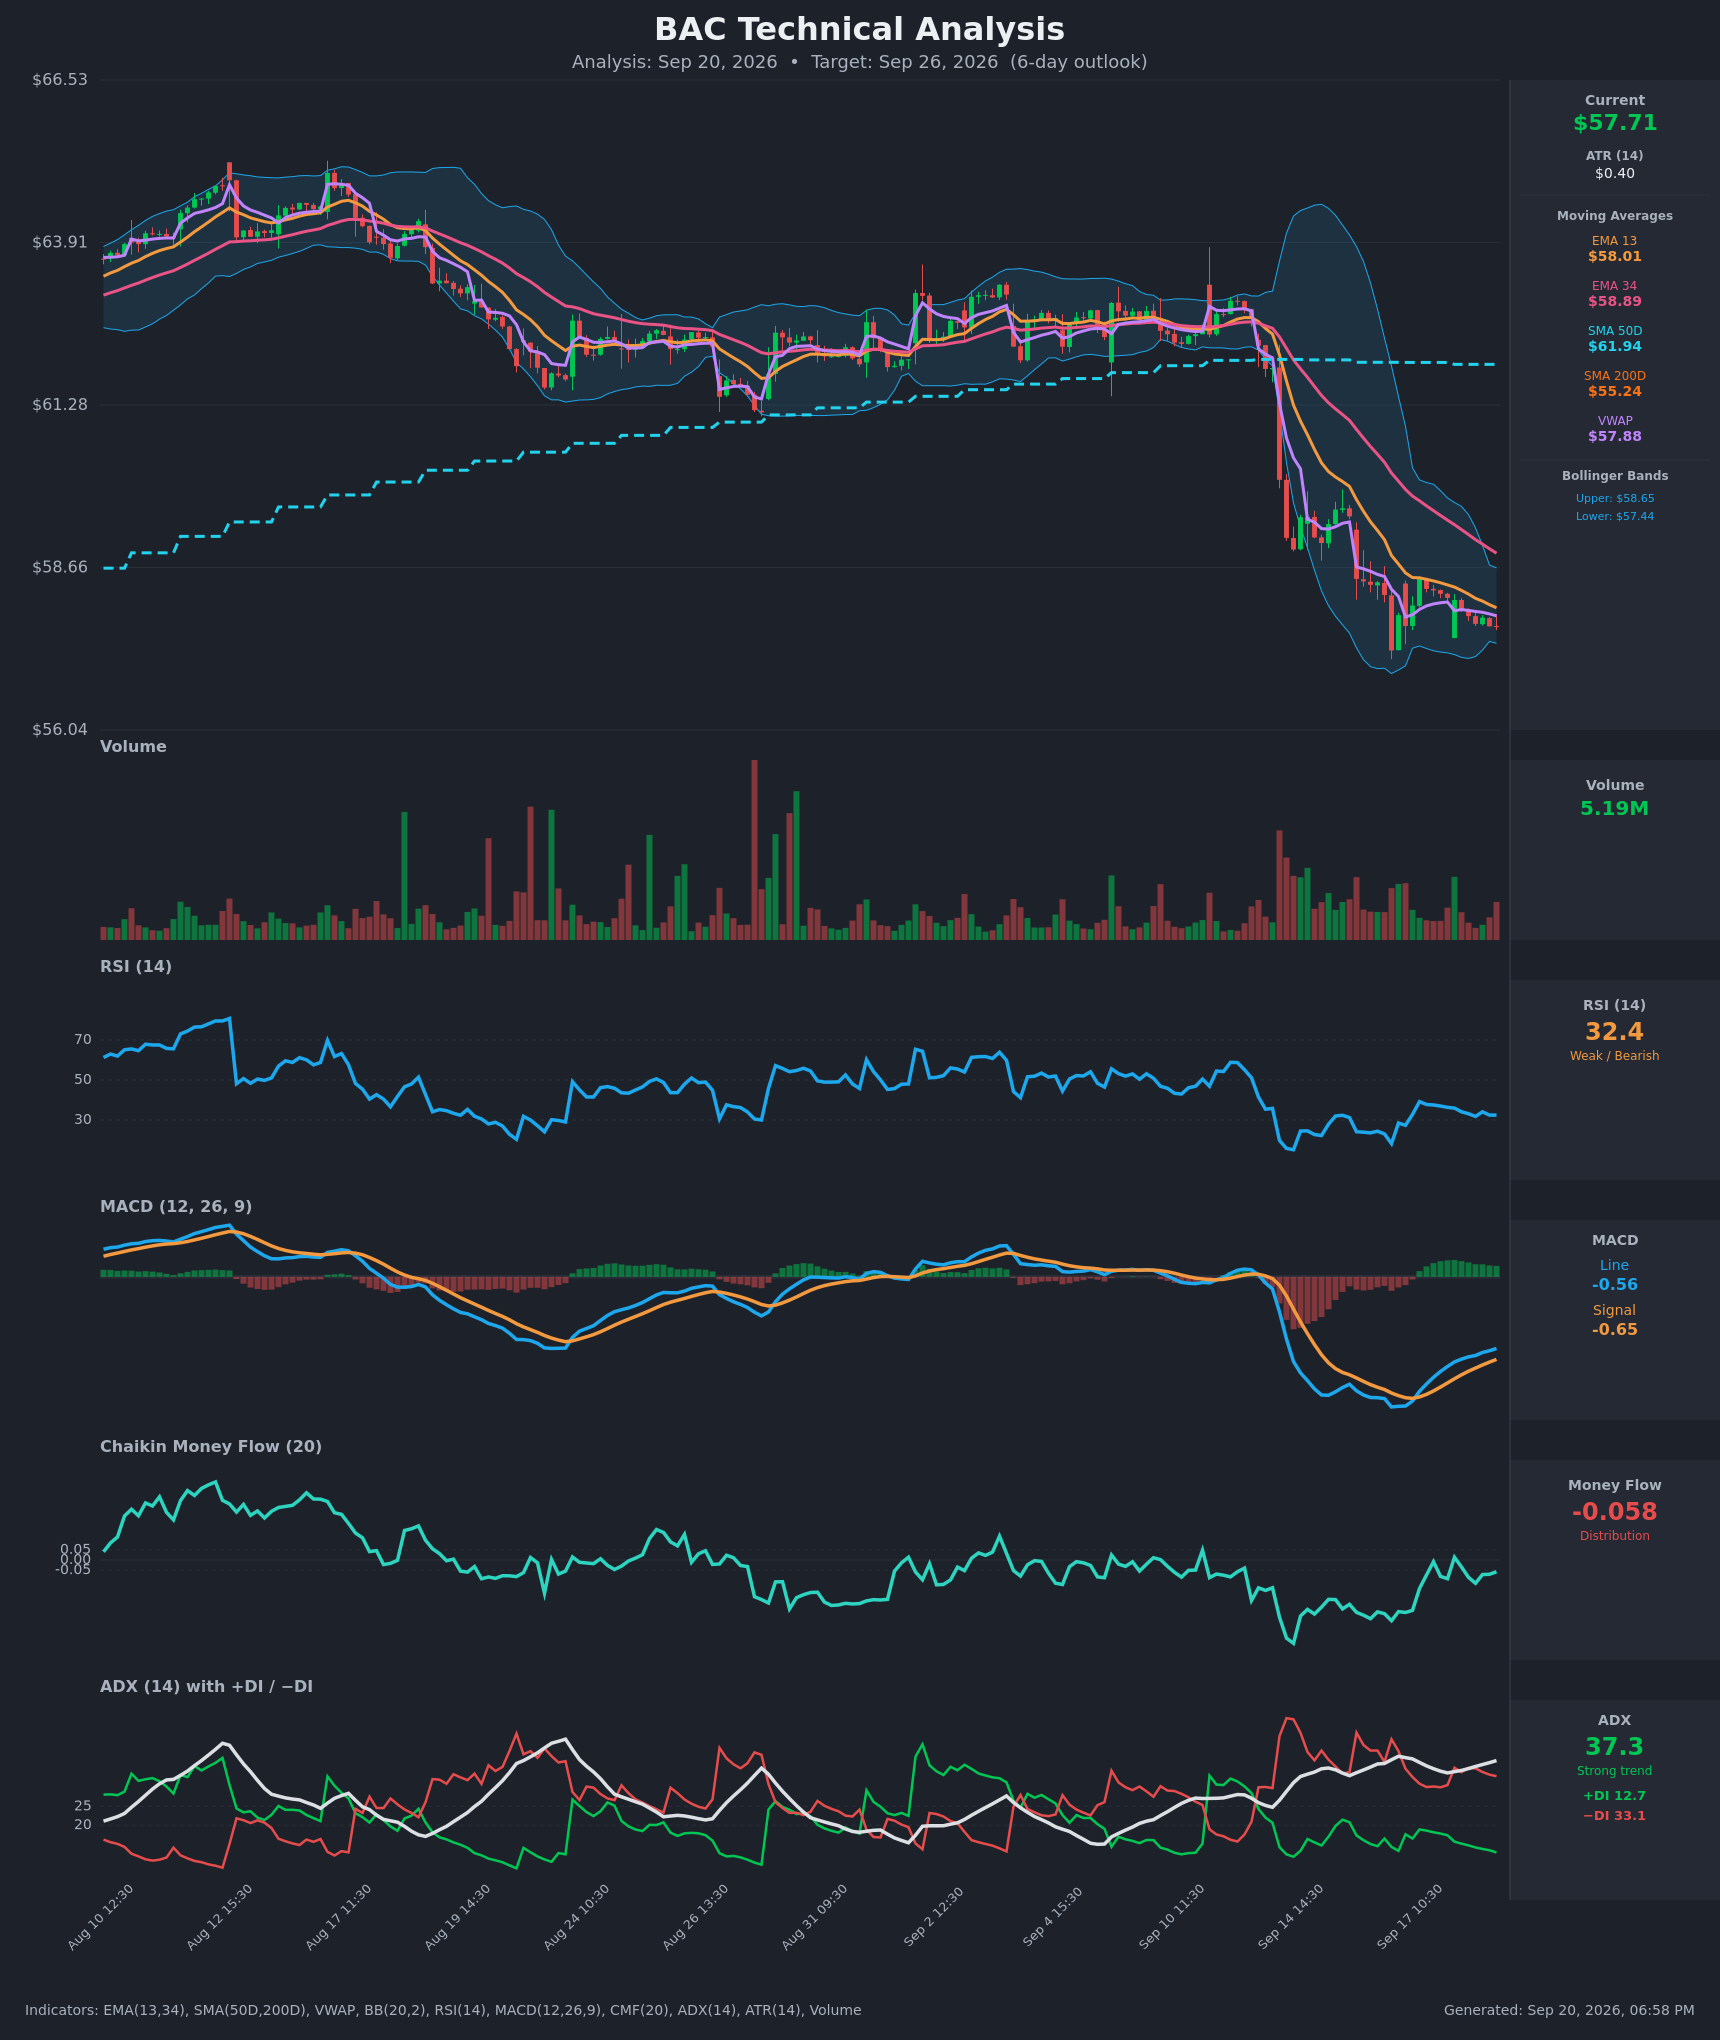
Both chart reports are fresh (generated September 20) and both are bearish. The 3-day model targets $56.90 by September 23 with a projected range of $55.70 to $58.90, naming support at $56.50 and resistance at $58.65. The 5-day model — whose target date matches this outlook window exactly — also targets $56.90, with a projected range of $55.80 to $59.10, support at $56.00 and resistance at $58.65.
The decisive indicator reads on both sides of that call: ADX at 37.3 with the negative directional line (33.1) far above the positive (12.7), which describes a strong, established downtrend rather than a stumble; and a MACD histogram that has been contracting for several bars, which says the selling thrust is losing steam even though no bullish crossover has fired. The dominant bearish scenario in the 5-day report is invalidated by reclaiming and holding above $58.65; the 3-day report's equivalent line is $58.10.
This is a clean divergence against the options read: the chart says continuation lower, the flow says positioning has quietly turned. Notably, both models' targets sit inside the options-implied range, so the disagreement is about direction, not magnitude. Practically, the divergence did adjust strike selection below — the bullish structure is built to require confirmation above $58 rather than to anticipate it, and the bearish structure is sized as a real alternative rather than a courtesy.
Model vs. Market: The options market implies $56.06–$59.40 into September 25; the 5-day technical model targets $56.90. Both can be true — a drift to $56.90 sits comfortably inside the implied range — which means the week resolves not on magnitude but on whether $58.00 is reclaimed or rejected.
Full technical write-ups: 3-day report → · 5-day report →
4 · Three ways the next five days can go
If BAC reclaims $58.00 and pushes toward the call wall ($60.00): the $58 strike holds this expiration's heaviest put open interest, and puts expiring worthless above it releases hedging pressure. Between $58 and $60 there is little in the way except the $59.00 max-pain strike, which is also where Friday's call buying clustered. The heaviest call open interest at $60 tends to slow rallies into it; above there, positioning thins out fast until $62.56.
If BAC chops between $56.84 and $58.00: this is the base case the positioning data supports. With the September 25 expiration's dealer-gamma estimate reading positive, hedging flows in that regime tend to pull price toward the big strikes as expiration approaches — and the pull would be upward, toward $59.00 max pain, since spot sits below both of this week's walls. A grind back to $58 without ever clearing it would leave most of the week's short-dated options expiring worthless in both directions.
If BAC breaks the implied-range low ($56.06): there is no meaningful options structure between $56 and the chain's heavy $55 put strike, and $55.24 — the 200-day moving average — sits in the same pocket. That is the zone both chart models point at. A high-volume close below $56.50 is the 3-day report's own trigger for that acceleration case, and it would end this article's read outright.
5 · Three defined-risk structures
Prices are end-of-day midpoints as of September 18, 2026. All structures are hypothetical. Verify live prices before trading — these will be stale by the open.
If you lean bullish: September 25 $58/$60 call debit spread
- Trade: Buy the September 25 $58 call, sell the September 25 $60 call
- Debit: $0.48 ($48 per spread) · Max profit: $152 · Max loss: $48 · Break-even: $58.48
- Why it fits: it buys premium in a week where the gap between priced-in and delivered movement sits in the 11th percentile of its own recent range — you are not overpaying for volatility. The long strike sits exactly at the put wall you need reclaimed; the short strike sits exactly at the call wall that has historically capped rallies, so you are selling the ceiling the chain already drew. Risk-to-reward is better than 3:1 for a move that only needs to reach the middle of the implied range.
- Makes sense only if: you believe the positioning turn matters more than the ADX reading — i.e. that $58 gets reclaimed inside five sessions.
- Invalidated if: BAC closes below $56.84.
- Managing it: the short-term trend read fights this trade, so take profit early — close at roughly 60% of max value rather than holding for expiration, and cut it at the September 23 checkpoint if $58 has not been reclaimed by then. There is no earnings-gap risk: BAC's next report is October 30, well past this expiration.
- Liquidity note: the $58 calls quoted 5¢ wide ($0.53/$0.58) and the $60 calls a penny wide ($0.07/$0.08). In absolute terms those are fine, but as a percentage of a 48-cent debit the slippage is real — work the order, don't pay the ask.
- Analyze this position →
If you expect the range to hold: September 25 $55/$57/$60/$62 iron condor
- Trade: Sell the $57 put / buy the $55 put, and sell the $60 call / buy the $62 call, all September 25
- Credit: $0.34 ($34 per condor) · Max profit: $34 · Max loss: $166 · Break-evens: $56.66 and $60.34
- Why it fits: in a credit structure you collect premium up front and win if price stays between the short strikes. Those short strikes are the two walls plus a dollar of buffer, and the profit zone covers almost the entire implied range. With the September 25 dealer-gamma estimate positive, a pinned, rangebound finish is the outcome this expiration's positioning is most consistent with.
- Makes sense only if: you accept a roughly 1-to-5 risk-to-reward ratio in exchange for a wide profit zone. Health warning: you are selling premium that hasn't been rich lately — the gap over delivered movement is in the 11th percentile of its own recent readings, so this structure is being compensated less than usual for the same risk.
- Invalidated if: BAC closes below $56.66 or above $60.34 — at either point the position is already at a loss and the thesis is gone.
- Managing it: close at roughly 50% of max credit, and exit regardless by Wednesday, September 23 — with seven days to expiration, gamma risk near the short strikes swamps the theta you are collecting in the final sessions. Expires more than a month before the October 30 earnings report, so no earnings-gap exposure.
- Liquidity note: every leg quotes in pennies — the $57 puts $0.33/$0.37, the $55 puts $0.06/$0.07, the $60 calls $0.07/$0.08, the $62 calls $0.01/$0.03. A bad fill on the four legs can eat a third of a 34-cent credit; use a limit on the whole package or skip it.
- Analyze this position →
If you lean bearish: September 25 $58/$56 put debit spread
- Trade: Buy the September 25 $58 put, sell the September 25 $56 put
- Debit: $0.645 ($64.50 per spread) · Max profit: $135.50 · Max loss: $64.50 · Break-even: $57.36
- Why it fits: this is the trade that sides with both chart models against the flow read. The long strike is the put wall the stock just slipped under; the short strike sits at the bottom edge of the implied range, near both models' target zone, so you are selling the tail you don't need. Buying puts is also cheaper than usual relative to calls right now — the downside skew has flattened by about 1.2 vol points over five sessions.
- Makes sense only if: you weight the trend evidence — ADX 37.3 with the negative directional line dominant, price below the 20-, 50- and 100-day averages — above the positioning turn.
- Invalidated if: BAC closes above $58.65, the resistance level both chart reports name as their own invalidation.
- Managing it: target the $56.06–$56.50 zone and take profit there rather than pressing for the full $56 pin; the 200-day average at $55.24 is the next magnet below and a bounce off it would give the spread back quickly. Expires well before the October 30 report.
- Liquidity note: the $58 puts traded 8¢ wide ($0.75/$0.83) on 987 contracts and the $56 puts 3¢ wide ($0.13/$0.16) on 1,279 — the most tradeable of the three structures here.
- Analyze this position →
If none of these: no trade
Standing aside is a genuinely strong option this week. The premium you'd collect selling the condor has rarely been thinner relative to how much BAC is actually moving, and the stock's 5-day realized volatility is running 1.56× its own 20-day pace — a combination where the seller gets paid below the odds for a stock that is currently moving above them. On the debit side, both directional spreads need the stock to travel within five sessions while the flow read and the chart read point opposite ways. If you have no strong view on which of those two engines is right, the honest answer is that there is no edge here worth 48 cents of premium, and the October 16 expiration offers both more time and a wider implied range if you'd rather wait for the argument to resolve.
6 · Quick FAQ
What is BAC's expected move this week? ±$1.67, or ±2.89%, into the September 25 expiration — a $56.06 to $59.40 range, per the options market's straddle pricing as of the September 18 close.
Is BAC expected to go up or down over the next five days? Options positioning as of September 18 leans slightly bullish — call open interest built while puts thinned, and downside protection got cheaper relative to calls — but that's a read of what traders have done, not a forecast. The chart models read the opposite way, targeting $56.90. The actionable map is the $56.06–$59.40 range and the $58.00/$60.00 levels.
Are BAC options expensive right now? Two lenses. An IV rank of 34/100 says option prices are lower than about 66% of the past year's readings. On top of that, they're running only about 1.3 vol points above the movement BAC has actually delivered — thinner than roughly 89% of this stock's own recent readings. Net: premium is not rich here, which favors owning options over selling them.
Where is BAC's biggest options support and resistance? For the September 25 expiration, the put wall is $58.00 (3,131 contracts) and the call wall is $60.00 (13,781 contracts). Across the whole chain the heavy strikes are much wider — $55.00 on the put side and $65.00 on the call side.
What invalidates this week's read? A close below $56.84.
Methodology & disclosures. Data: end-of-day options-chain snapshot for BAC, 2026-09-18, generated 2026-09-20T18:58:49.754Z. Prices shown are midpoints and will differ from live markets. Momentum/positioning scores and volatility-premium comparisons are descriptive measurements of past option flow and past price movement — not investment advice, signals, forecasts, or guarantees. Earnings dates and reported results are from the data provider's earnings feed as of 2026-09-20T18:58:49.754Z; report dates can change. All trade structures are hypothetical. Every structure shown has a defined maximum loss; you can lose the entire max-loss amount. Options involve substantial risk and are not suitable for all investors.