BB Options Are Pricing a $1.29 Move — And the Two Chart Models Can't Agree Which Way
BlackBerry's options chain implies a $6.38–$8.96 range into September 25 while the stock sits pinned at $7.67 between a $10.00 call wall and $6.00 max pain. Here's what the positioning actually says, and three defined-risk ways to trade a stock that has stopped moving.

The options market implies a $6.38–$8.96 range into the September 25 expiration; here's what's driving it and three defined-risk ways to trade the next five days.
Published Sunday, September 13, 2026 · Data as of the September 11, 2026 close
Explore the live BB options data in the Detailed Options Analyzer →
Quick answer
| Item | Answer |
|---|---|
| Market bias | Neutral with a bullish tilt |
| Options-implied range (into September 25) | $6.38 – $8.96 (±16.88%, or ±$1.29 around the $7.67 spot) |
| Major support | $4.00 — the September 18 expiration's put wall |
| Major resistance | $10.00 — the September 18 expiration's call wall |
| Max pain (September 18) | $6.00 |
| Dealer gamma regime (estimate) | Positive — hedging tends to dampen moves; flip level ≈ $2.00 |
| Volatility condition | Flat — IV rank 36.7/100 · premium rich: options priced about 17 vol points above delivered movement |
| Technical check | Mixed (3-day model bullish to $7.72; 5-day model bearish to $7.60) |
| Best-fitting strategy | Short put spread — September 18 $7.50/$7.00 |
| Analysis invalidated if | BB closes below $7.51 |
1 · What matters today
BlackBerry closed Friday at $7.67, essentially flat over five sessions after a brutal month — the stock is down 14.7% over the past 20 trading days. Our read of options positioning lands on neutral with a slight bullish tilt: the signals genuinely disagree, but the one doing most of the pushing is skew. Twenty-five-delta calls — calls roughly the same distance out of the money as the comparison puts — are running about 19 vol points richer than those puts, versus a two-month norm near 10. Traders here are paying up for upside, not for crash protection. Against that, the September 18 expiration's max pain sits down at $6.00, and the heaviest put open interest for that date is a long way below the tape.
The map for the next five days is simple: the options-implied range runs $6.38–$8.96 into September 25, and the level that changes the picture is $7.51. A close beneath it kills this read. The two chart models split — one bullish, one bearish — which is its own kind of information.
2 · What the options market is pricing
What changed this week
The headline change is in put activity, not put positioning. Put/call volume — how much put trading there is relative to calls — came in at 0.77 on Friday: for every 100 call contracts traded, 77 puts changed hands. The seven-session average is 33 and the 14-session average is 32. That is a genuine spike in put turnover. But open interest, which measures contracts actually held rather than traded, barely moved: 33 puts held for every 100 calls, identical to its 14-day average. Heavy put volume with unchanged put open interest is the signature of positions being closed and rolled, not of a fresh hedging wave.
Where new money did land was call-side and further out. The largest genuine open-interest builds were the October 16 $8 calls (+444 contracts to 2,153, on 979 lots and $51,398 of premium — the single biggest dollar-premium contract on the board Friday) and the October 16 $7 puts (+518 to 1,693). Implied volatility drifted: at-the-money IV of 71.9% is up 4.1% over five sessions but down 9.7% over 30, sitting 2.9% above its 30-day average of 69.8% and far below its 90-day average of 84.3%. Into Friday's settled expiration, the September 11 $8.50 puts shed 129 contracts of open interest — housekeeping, nothing more.
One piece of context the flow doesn't show: the short-, medium- and long-horizon trend reads all point the same way. The past week is flat (−0.4%), but the past month is −14.7% and the past 50 sessions are −40.2%. A momentum crossover flipped bearish on September 8, though at a strength of essentially zero — a technicality more than a turn. The near-term flow lean discussed below is sitting inside a stock that has been going one direction for two months.
Expected move
The expected move is the move the options market is pricing in, derived from what straddles cost. There's a wrinkle this week: on the September 18 expiration, the at-the-money call and put implied volatilities disagreed far too much to blend (30.6% on the call side against 50.5% on the put side), so that rung carries no usable expected move. Quote quality, not missing data — and it means the nearest reliable read is the September 25 rung.
| Expiration | Implied move | Range around $7.67 |
|---|---|---|
| September 25 (14 days) | ±16.88% | $6.38 – $8.96 |
| October 2 (21 days) | ±16.96% | $6.37 – $8.97 |
| October 16 (35 days) | ±21.66% | $6.01 – $9.33 |
Notice how little the range widens between the first two rungs: fourteen days and twenty-one days are priced for almost the identical dollar move. The chain is loading the near-term risk into the next two weeks and then flattening out — a market that thinks whatever is going to happen, happens soon.
Volatility
At-the-money implied volatility — the market's estimate of how much BB will move, baked into option prices — is 71.9%. IV rank is 36.7/100, meaning today's IV is cheaper than roughly 63% of the past year's readings; IV percentile is higher at 66.8, so BB has spent most of the year below this level but has had some violent spikes far above it. IV has gone essentially nowhere day-over-day (−0.4%) and is up modestly over the week. The front-month read and term-structure slope are unavailable today — Friday's snapshot was taken on an expiry day, and front-month IV can't be interpolated from a same-day-expiring contract. That's an artifact, not an absent term structure.
Meanwhile, actual movement has quietly collapsed. Twenty-day realized volatility is 54.7% — well below this stock's own recent norm — and the five-day-versus-twenty-day realized ratio of 0.61 says the last week has been calmer still. BB has stopped moving.
Premium rich or cheap. The volatility risk premium is the gap between how much movement options are priced for and how much BB has actually delivered — when it's positive, option sellers have been collecting more than realized movement cost them. That gap is currently about 17 vol points, and it sits at the 69th percentile of this stock's own recent readings: richer than roughly two-thirds of them. The path over the past week has been gently lower (from about 21 vol points on September 8 to 17 now) with no sign flip. Combine a middling IV rank of 36.7 with a premium that is rich versus its own history and the verdict tilts toward collecting premium rather than owning it — with the honest caveat that the richness is coming from realized volatility falling, not from options getting expensive, and a stock that has stopped moving can start again without warning.
Skew and sentiment
Skew means puts and calls the same distance from the stock price don't cost the same. On most names, puts are pricier — traders pay up for crash protection. On BB right now the opposite is true and by a wide margin: 25-delta call IV is 102.7% against 25-delta put IV of 83.9%, a 18.8-vol-point gap in favor of calls, versus a 60-day median gap of 10.4 points. That reading is stretched versus this stock's own history, and it is the single most bullish-leaning input in the whole file. People are paying a premium for the chance of a bounce, not for protection against another leg down.
Sentiment in short-dated options is mildly positive and builds as you go further out: the 0–7 day bucket scores +6, the 7–30 day bucket +17, the 30–60 day bucket +38 and the 60–120 day bucket +48. The summary phrase for that shape is a bullish recovery posture — positioning is being built further out the curve rather than in the front week. Against all of that sits the one clean negative: put volume ran unusually put-tilted versus this name's own baseline on Friday, and price momentum over five sessions is slightly negative. That mix is exactly why the composite reads neutral with a tilt rather than anything firmer.
The key levels map
| Level | Price | Why it matters |
|---|---|---|
| 52-week high | $13.59 | 43.6% above the close; context only |
| Call wall (Sept 18) — and chain-wide | $10.00 | 21,464 calls open for Sept 18 and 37,676 across the whole chain; the two agree, which makes this the clearest ceiling on the board |
| Swing resistance | $9.34 / $8.83 | Prior pivot clusters from the August breakdown |
| Heavy gamma strike | $9.00 | Second-largest total gamma concentration chain-wide; 8,899 Sept 18 calls open here |
| 50-day moving average | $8.87 | Price sits 13.5% below it — the medium-term trend is still down |
| Swing resistance / 20-day MA | $8.20 / $8.03 | Price is 4.5% under the 20-day average |
| Largest gamma strike | $8.00 | Biggest total open-interest gamma pile in the chain, and max pain for Sept 25 |
| Chart-model resistance | $7.82 | Upper Bollinger band, the top of the two-week range |
| Spot / swing support | $7.67 / $7.66 | Friday's close sits directly on a swing-pivot cluster |
| Chart-model support | $7.51 | Lower Bollinger band and recent swing low — the invalidation level |
| Put wall (chain-wide) | $7.00 | 17,995 puts open across all expirations — the real options-side floor, and where 8,102 contracts traded Friday |
| Swing support | $6.61 | Next structural shelf beneath $7 |
| 200-day moving average | $6.06 | Price is still 26.6% above it — the long-term uptrend is intact |
| Max pain (Sept 18) | $6.00 | The price where the most Sept 18 option value expires worthless; expirations sometimes gravitate toward it |
| Put wall (Sept 18) | $4.00 | 11,350 puts open — the heaviest put strike for this expiration, but a deep-out-of-the-money cluster rather than a live battleground |
| Gamma flip estimate | ≈$2.00 | One rough estimate of the level below which hedging would amplify selling; spot sits about 74% above it, unusually far even for this name |
The disagreement worth naming: the September 18 expiration's own put wall is $4.00, while the whole chain's heaviest put strike is $7.00. For the next five days, $7.00 is the level with live positioning behind it; $4.00 is where the tail insurance lives.
Positioning and unusual flow
Dealer gamma — the idea that market makers hedge the options they've sold — is an estimate here, not observed inventory. Under the file's stated assumption, both the whole chain and the September 18 expiration specifically read positive: in this regime hedging flows tend to dampen moves rather than amplify them, which fits a stock that has gone nowhere for two weeks. The estimated flip level is roughly $2.00, far enough below spot that the fragile side of that regime isn't a live concern this week.
Three flow items stood out, all in unexpired contracts. First, the September 18 $7.00 puts traded 8,102 contracts against 6,020 open — turnover of 1.35x, about $20,300 of premium at a 2.5-cent mid. At that price this is lottery-ticket or position-closing flow, not conviction hedging. Second, the September 18 $9.00 calls traded 5,581 lots against 8,899 open, roughly $14,000 of premium at 2.5 cents — cheap upside tickets clustered just under the call wall. Third, and biggest in money terms, the October 16 $8.00 calls saw 979 lots and $51,398 of premium with open interest climbing 444 contracts. That last one is the only item of the three that looks like somebody building something.
3 · Technical check
The two chart models covering this window disagree with each other, which is unusual and worth reporting plainly. The near-term model (4-day horizon, target date September 16) reads bullish: target $7.72 with a projected range of $7.48 to $7.90, leaning on a fresh MACD crossover, money-flow readings still in accumulation territory, and RSI recovering off an oversold dip near 33 back to 49. The longer model (6-day horizon, target date September 18) reads bearish: target $7.60 with a projected range of $7.42 to $7.86, pointing at the short-term moving average still below the medium one, a directional index favoring the bears, and price well beneath the 50-day average. Both models use $7.51 as support and $7.82 as resistance. Both note trend strength below 20 — meaning neither is describing a trending market.
Against the options read, the 4-day model confirms the mild upward tilt, and its $7.72 target sits comfortably inside the implied range. The 6-day model diverges in direction while still landing inside the same range. The honest summary is mixed: both models describe a coiled $7.51–$7.82 rectangle and disagree only about which side it resolves toward.
Model vs. Market: The options market implies a $6.38–$8.96 range into September 25; the 5-day technical model targets $7.60 inside a $7.42–$7.86 band. The chart model is pricing roughly a fifth of the movement the options chain is. Either the options are overpaying for a move that never comes — which is what a 69th-percentile volatility premium is already telling you — or the chart is under-modeling a stock that fell 14.7% in a month.
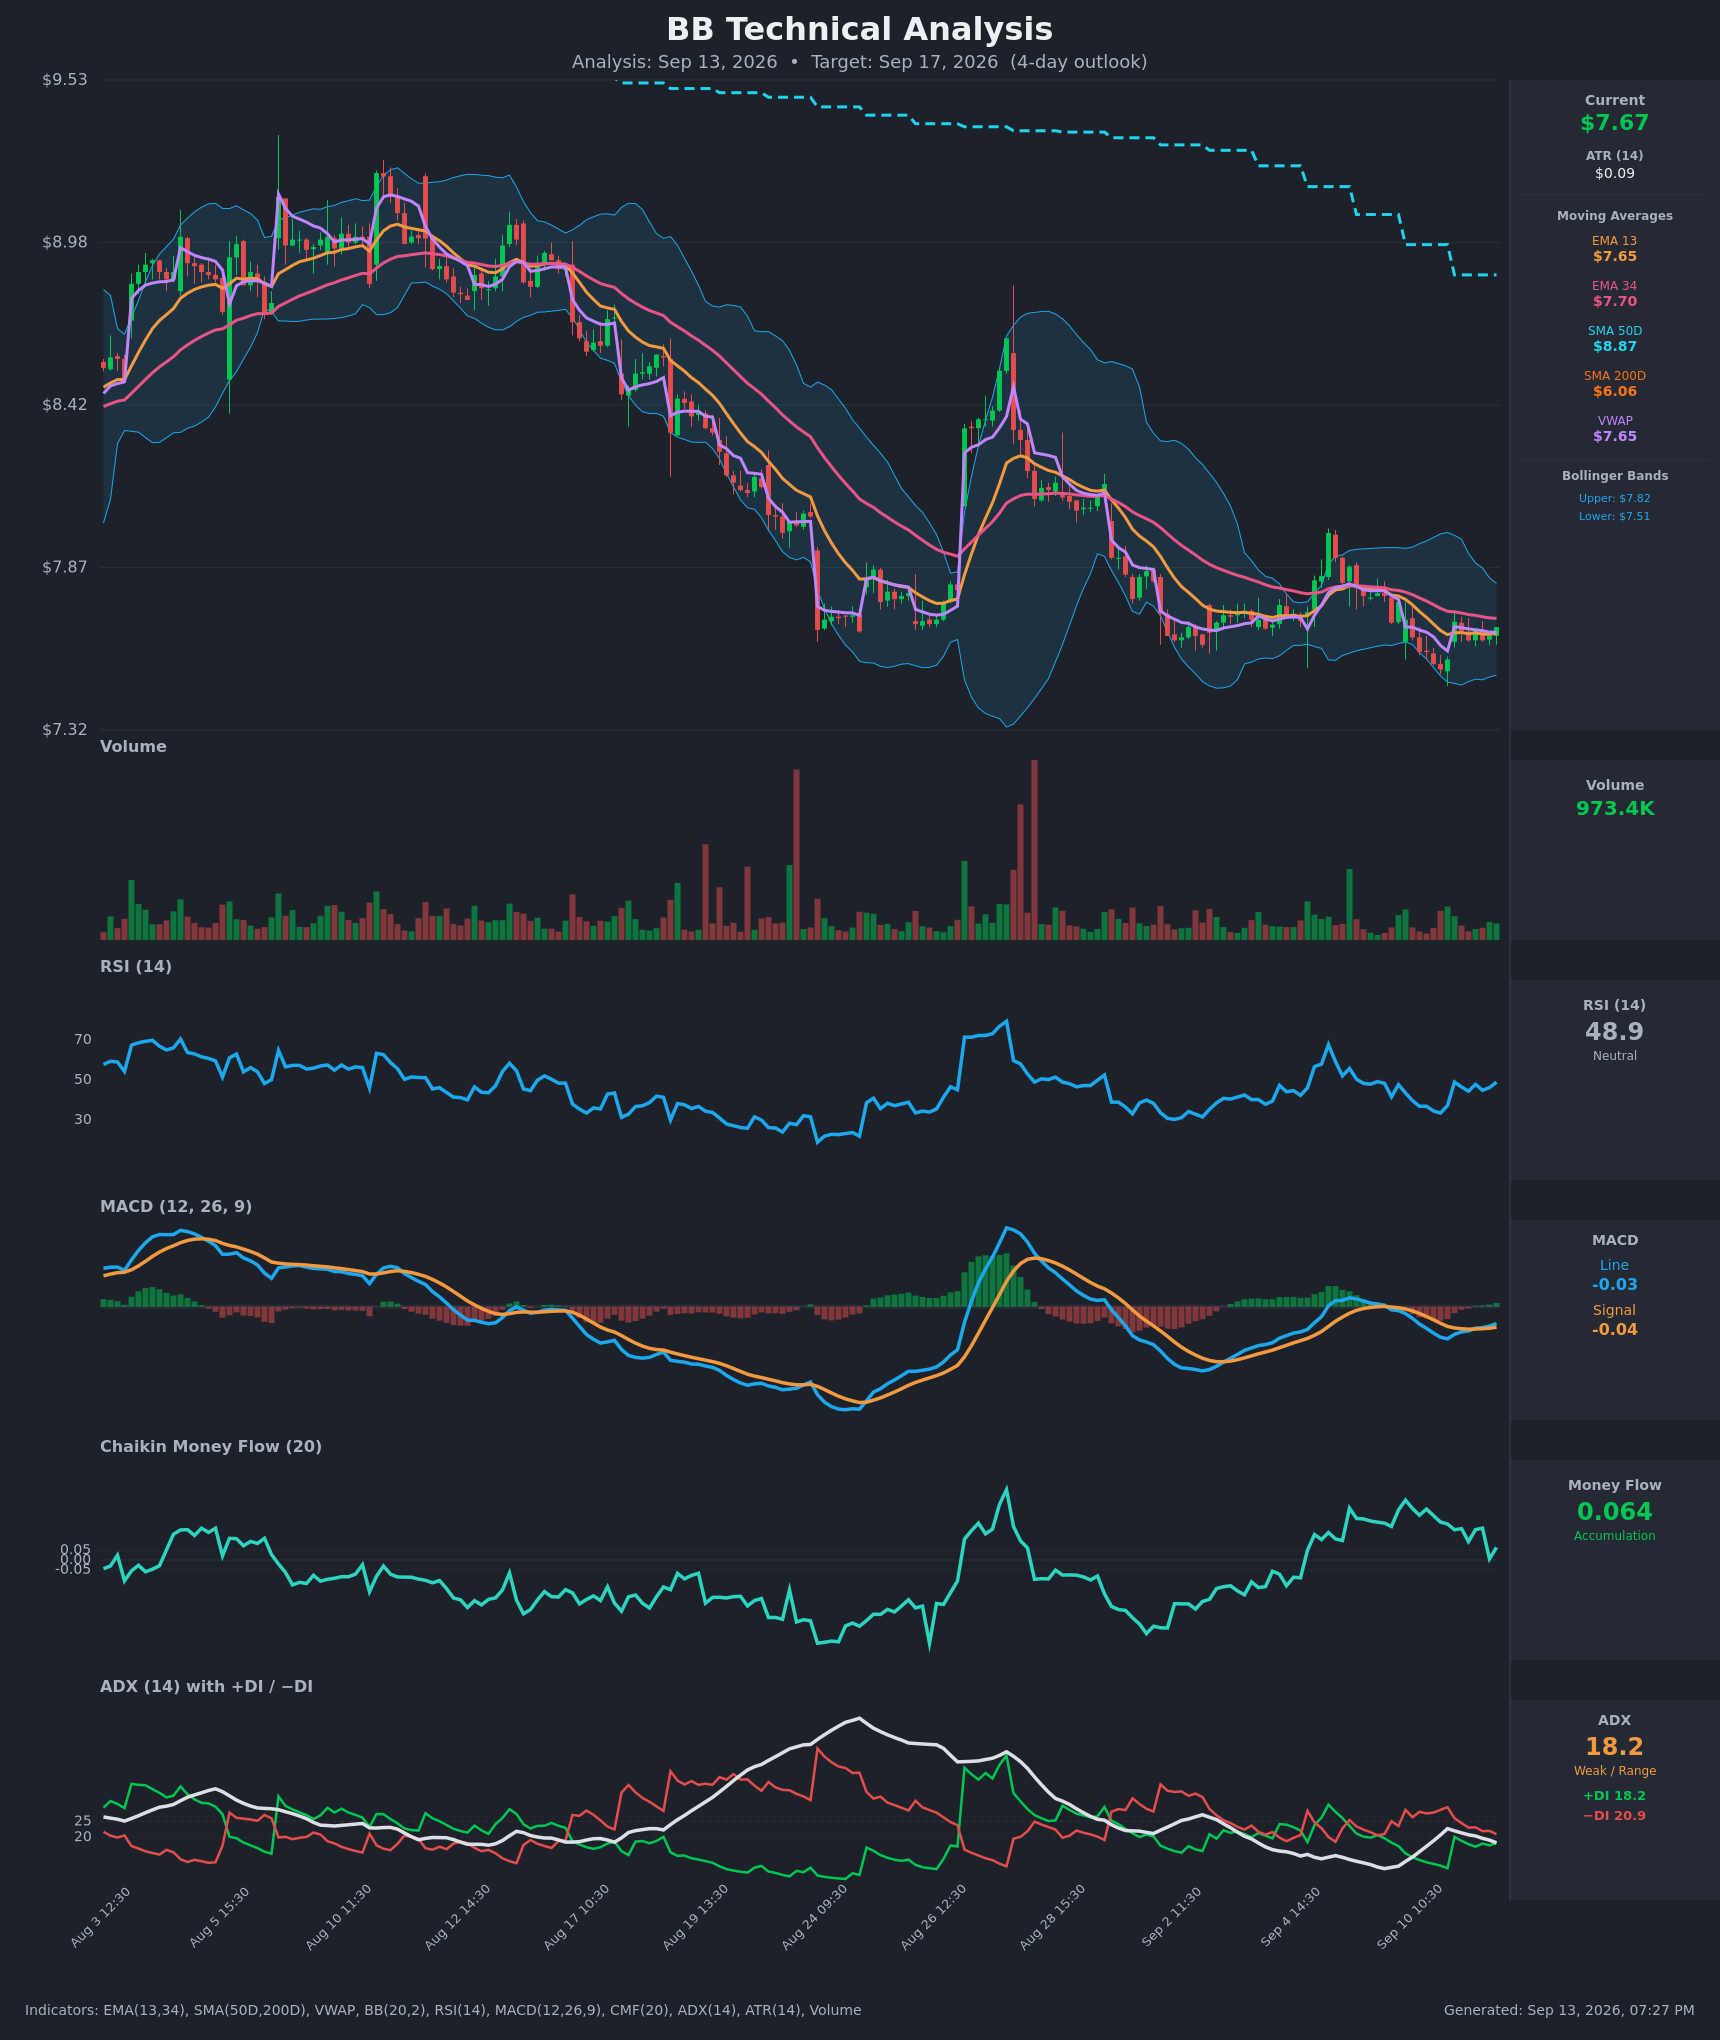
How this shaped strike selection below: the technical picture did not move the direction, but the $7.51 floor both models share is why the short put strike sits at $7.50 rather than lower, and why the invalidation level is a close beneath $7.51 rather than a break of the far-away put wall.
Full technical write-ups: 3-day report → · 5-day report →
4 · Three ways the next five days can go
If BB pushes above $8.00: the largest gamma concentration in the entire chain sits at $8.00, and that strike is also where September 25's max pain rests. Heavy open interest overhead tends to slow rallies rather than stop them, and above $8.00 the positioning thins out considerably until $9.00. The $10.00 call wall — the heaviest call strike both for this expiration and chain-wide — is the level where a rally would run into a genuine wall of hedged inventory.
If BB drifts between $7.51 and $8.00: this is the base case the chain is built for. The estimated dealer gamma regime is positive for the September 18 expiration, meaning hedging flows tend to pull price back toward the center rather than push it away, and both chart models describe a rectangle. Max pain for September 18 sits at $6.00, well below spot — that is a pull, not a magnet with real force at this distance, because the bulk of the September 18 open interest that matters is clustered at $7, $8 and $10, not at $6.
If BB breaks below $7.51: the next options-side floor is the chain-wide put wall at $7.00, where nearly 18,000 puts are held open and where Friday's heaviest single-contract volume printed. Below that, the structure map thins to the $6.61 swing shelf. The estimated gamma flip sits near $2.00 — spot is about 74% above it, an unusually wide cushion for this name — so the accelerant that turns a decline into a cascade is not in play at these prices. A break below $7.51 doesn't mean collapse; it means this article's read was wrong and $7.00 becomes the conversation.
5 · Three defined-risk structures
Prices are end-of-day midpoints as of the September 11 close. All structures are hypothetical. Verify live prices before trading — these will be stale by the open.
If you lean bullish: short put spread
- Trade: Sell the September 18 $7.50/$7.00 put credit spread (sell the $7.50 put, buy the $7.00 put). A credit spread means you collect premium up front and keep it if the stock stays above your short strike.
- Credit: $0.11 · Max profit: $11 per spread · Max loss: $39 per spread · Break-even: $7.39
- Why it fits: the short strike sits right on the $7.51 support both chart models name, and the long wing sits at the chain-wide put wall where nearly 18,000 puts are held open. You're also selling into a premium that is rich versus this stock's own recent delivered movement — about 17 vol points, at the 69th percentile.
- Makes sense only if: you believe the $7.51–$7.82 rectangle holds for five more sessions, which is what the flat realized-volatility reading and the positive gamma estimate both suggest.
- Invalidated if: BB closes below $7.51.
- Managing it: with five days to expiration there's no room for patience — close at roughly 50% of max credit if it comes quickly, and if BB closes through $7.50 at any point, close rather than hope. The longer-term trend is still pointing down, which argues for taking profits early rather than holding to expiration.
- Liquidity note: the $7.50 puts are quoted 11¢ bid / 16¢ ask — five cents wide on a 13.5-cent mid, so use limit orders and expect to give up a cent. The $7.00 puts trade a penny wide and were the most active contract on the board.
- Analyze this position →
If you expect the range to hold: iron condor
- Trade: September 25 iron condor — sell the $7.00 put, buy the $6.50 put, sell the $8.50 call, buy the $9.00 call.
- Credit: $0.20 · Max profit: $20 · Max loss: $30 · Break-evens: $6.80 and $8.70
- Why it fits: the short strikes bracket the chain-wide put wall ($7.00) and sit beneath the $9.00 gamma strike, entirely inside the $6.38–$8.96 implied range. This one deliberately goes out to September 25 rather than September 18: the outer September 18 strikes are quoted in one- and two-cent increments, and a condor there collects almost nothing for the same risk. One week further out, the same structure pays a credit worth collecting.
- Makes sense only if: you're comfortable holding a week past this article's window, and you accept that a rich volatility premium is the entire edge here — there is no directional view embedded.
- Invalidated if: BB closes outside $6.80–$8.70, or closes below $7.51 with expanding volume, which would put the put side in play well before expiration.
- Managing it: take it off at roughly half the max credit, or by September 22 regardless, so you aren't holding four short-dated legs into the last two sessions.
- Liquidity note: the September 25 $7.00 puts trade 18¢/22¢ and the $8.50 calls 19¢/22¢ — both acceptable. The $6.50 put wing is the problem child at 2¢ bid / 15¢ ask; leg into it patiently or widen to a strike with a tighter market, and treat the quoted credit as optimistic.
- Analyze this position →
If you lean bearish: put debit spread
- Trade: Buy the September 18 $7.50/$7.00 put debit spread (buy the $7.50 put, sell the $7.00 put) — the mirror image of the bullish structure above. A debit spread means you pay up front and profit if the stock falls toward your lower strike.
- Debit: $0.11 · Max profit: $39 per spread · Max loss: $11 per spread · Break-even: $7.39
- Why it fits: it's the cheapest defined-risk way to express the 6-day chart model's $7.60 target and the still-intact medium-term downtrend (BB is 13.5% below its 50-day average and down 40.2% over 50 sessions). The $7.00 short strike caps you exactly at the chain-wide put wall, which is where a decline would most likely find its first real friction.
- Makes sense only if: you think the $7.51 floor breaks this week — and note you're paying for premium that has been rich lately, so time decay works against you from day one.
- Invalidated if: BB closes above $7.82, the top of the two-week rectangle both chart models identify.
- Managing it: a 3.5-to-1 payoff means you can be wrong repeatedly; size it as a lottery ticket, not a position. Take profits into any touch of $7.10 rather than waiting for a perfect pin, and let the remaining $11 go to zero rather than adding.
- Liquidity note: same contracts as the bullish spread — the $7.50 puts are five cents wide, the $7.00 puts a penny. On an 11-cent net debit, a one-cent fill slip is a tenth of your capital, so limit orders only.
- Analyze this position →
If none of these: no trade
There's a real case for standing aside, and it survives the fact that premium looks rich. The volatility premium sits at the 69th percentile of this stock's own recent readings — but it got there because realized movement collapsed, not because option prices climbed; IV rank is a mid-range 36.7/100 and at-the-money IV is well below its 90-day average. Selling premium into falling realized volatility on a $7 stock means collecting eleven cents to risk thirty-nine, on contracts quoted five cents wide. A single bad fill on each leg erases a fifth of the theoretical credit. Add a directional composite that is genuinely neutral and two chart models that point opposite directions, and the honest verdict is that BB's next five days offer a clear map and a thin edge. Waiting for a decisive break of $7.51 or $7.82 — and trading the resolution instead of the coil — costs nothing.
6 · Quick FAQ
What is BB's expected move this week? The September 18 expiration's quotes were too inconsistent to price a reliable straddle, so the cleanest read is the next rung: ±16.88%, or about ±$1.29 around $7.67, giving a $6.38–$8.96 range into September 25, per options pricing as of the September 11 close.
Is BB expected to go up or down over the next five days? Options positioning as of September 11 leans neutral with a slight bullish tilt — driven mainly by 25-delta calls trading about 19 vol points richer than comparable puts, versus a 10-point norm — but that's a read of what traders have done, not a forecast. The actionable map is the $6.38–$8.96 implied range and the $7.51 / $7.82 rails.
Are BB options expensive right now? Two lenses. IV rank of 36.7/100 says option prices are lower than about 63% of the past year's readings. But they're running roughly 17 vol points above the movement BB has actually delivered over the past 20 sessions — richer than about 69% of this stock's own recent readings. Net: not expensive in absolute terms, but generous relative to a stock that has stopped moving.
Where is BB's biggest options support and resistance? For the September 18 expiration, the call wall is $10.00 (21,464 contracts) and the put wall is $4.00 (11,350 contracts). Because that put wall is so far out of the money, the level with live positioning beneath the tape is the chain-wide put wall at $7.00, where nearly 18,000 puts are held open.
What invalidates this week's read? A close below $7.51.
Methodology & disclosures. Data: end-of-day options-chain snapshot for BB, 2026-09-11, generated 2026-09-13T19:27:01.831Z. Prices shown are midpoints and will differ from live markets. Momentum/positioning scores and volatility-premium comparisons are descriptive measurements of past option flow and past price movement — not investment advice, signals, forecasts, or guarantees. All trade structures are hypothetical. Every structure shown has a defined maximum loss; you can lose the entire max-loss amount. Options involve substantial risk and are not suitable for all investors.