BB Options Outlook: Will the $8 Put Wall Hold Into October 23?
BB options imply a $7.35–$8.77 range into the October 23 expiration, with the stock sitting just above its $8 put wall. Options positioning leans slightly bullish while both chart models lean bearish. Here is the level map and three defined-risk trades.
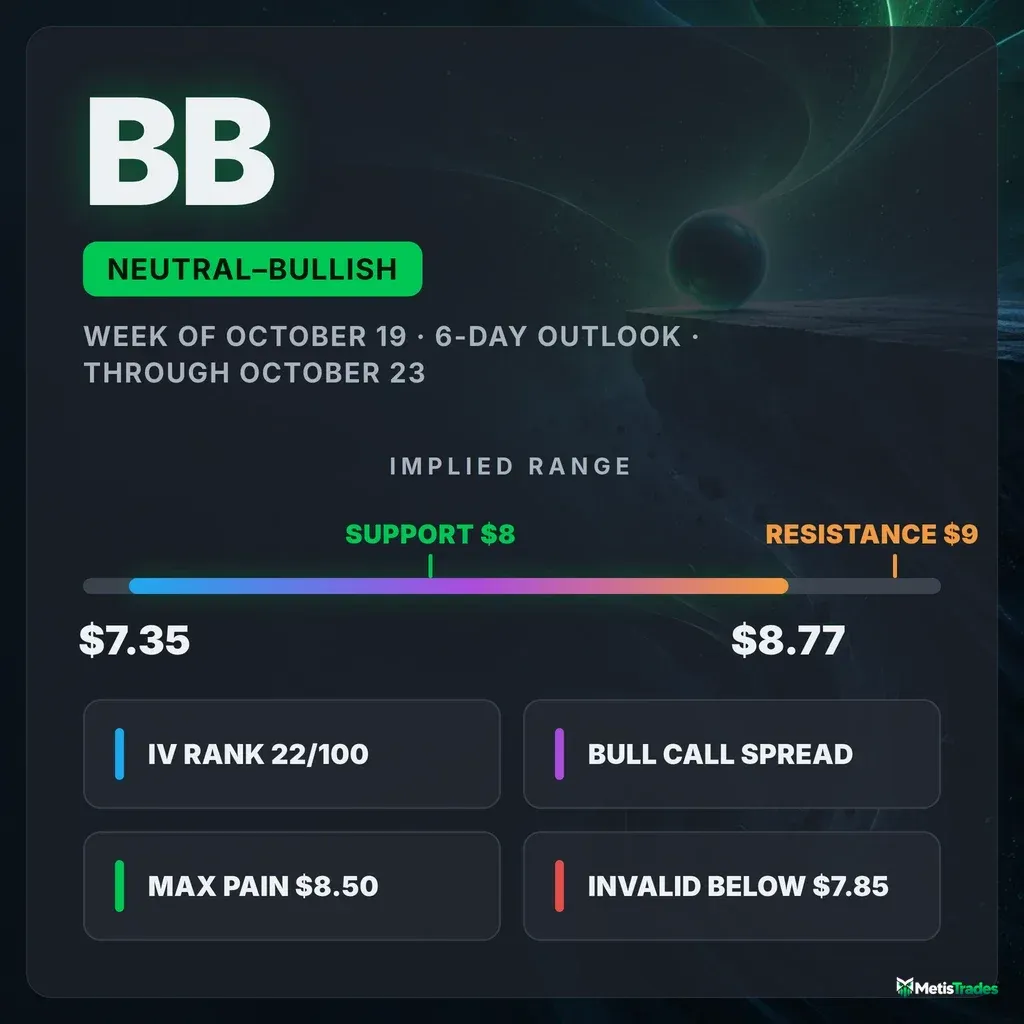
The options market implies a $7.35–$8.77 range into the October 23 expiration. This article covers what is driving that range, why positioning leans slightly bullish while the charts lean bearish, and three defined-risk ways to trade it.
Published Saturday, October 17, 2026 · Data as of Friday, October 16, 2026 close
Explore the live BB options data in the Detailed Options Analyzer →
Quick answer
| Item | Answer |
|---|---|
| Market bias | Slightly bullish (a neutral-bullish lean) |
| Options-implied range (into October 23) | $7.35 – $8.77 (±$0.71, ±8.79%) |
| Major support | $8.00 put wall (October 23 expiration) |
| Major resistance | $9.00 call wall (October 23 expiration) |
| Max pain (October 23) | $8.50 |
| Dealer gamma regime (estimate) | Negative for the October 23 expiration, where hedging tends to amplify moves. The whole-chain estimate is positive, with a flip level ≈ $1. |
| Volatility condition | Neutral. IV is ticking up this week but sits well below its 30-day average. IV rank 21.91/100 · premium thin: options are priced ~17 vol pts below delivered movement. |
| Technical check | Diverges (bearish, 3-day target $7.92 and 6-day target $7.90) |
| Best-fitting strategy | Bull call spread ($8/$8.50, October 23), conditional on $8 holding |
| Analysis invalidated if | BB closes below $7.85 |
1 · What matters today
BB options positioning leans slightly bullish into the October 23 expiration. The single biggest reason is where the stock sits. Friday's close of $8.06 is just above the largest pile of put open interest (contracts currently held open) for that expiration, at $8. The heaviest call strike is a full dollar overhead at $9, so there is more room above than below inside that corridor.
The options market is pricing a move of about $0.71 either way. That figure is derived from what straddles cost, and it puts the range at roughly $7.35 to $8.77.
The level that changes the picture is $7.85. A close below it puts BB through both the put wall and nearby swing support, and the lean is off.
Options themselves are cheap right now. They are priced for less movement than the stock has actually delivered lately. Both chart models disagree with the lean: they point bearish, toward about $7.90.
2 · What the options market is pricing
What changed this week
BB fell 9.54% over the past five sessions. The 20-day change is still slightly positive at +0.88%, which tells you how much of this month's gain the last week gave back. Over the past week the trend read is clearly bearish, while the roughly one-month and two-month reads are flat. In other words, the short-term slide is a sharp pullback inside a broader trend that has gone sideways, not a long-running downtrend.
Implied volatility (IV) is the market's estimate of how much BB will move, baked into option prices. It rose 3.9% over five days but is still down 15.6% over 30 sessions.
Puts gained a little ground:
- Put/call open interest is 0.25. That means about one put is held open for every four calls, versus a 7-day average of 0.25 and a 14-day average of 0.24.
- Put/call volume is 0.32, against a 7-day average of 0.29 and a 14-day average of 0.25. More hedging than usual, but still call-dominated in absolute terms.
The most notable live open-interest moves came on the call side:
- The October 23 $10 calls shed 1,110 contracts (OI fell from 3,192 to 2,082). Traders are closing far-upside bets after the drop.
- The November 13 $9.50 calls added 963 contracts, to 1,323. Some upside interest is being pushed out in time rather than abandoned.
Into Friday's expiration, the settled October 16 $9 calls had grown to 20,300 contracts, and they finished out of the money with BB at $8.06. That is history now, but it explains why so much call OI vanished from the near-term picture.
Expected move
The expected move is the move the options market is pricing in, derived from what straddles cost. For the October 23 expiration it comes to ±8.79%, or about $0.71 either way from $8.06.
| Expiration | Implied move | Range around $8.06 |
|---|---|---|
| October 23 | ±8.79% | $7.35 – $8.77 |
| October 30 | ±11.22% | $7.16 – $8.96 |
| November 6 | ±12.93% | $7.02 – $9.10 |
| November 13 | ±15.91% | $6.78 – $9.34 |
The rungs widen roughly with the square root of time, with no unusual step between them. The chain shows no scheduled event bulge in this window, just a stock that has been moving a lot.
Volatility
At-the-money IV is 58.28%. IV rank measures where today's IV sits versus the past year. At 21.91/100, today's IV is about a fifth of the way up its 52-week range, and higher than only about 28% of the past year's sessions. It is below both its 30-day average (66.2%) and its 90-day average (77.6%), even after ticking up 3.6% on Friday.
Front-month read unavailable today (expiry day). The roughly 60-day IV sits at 62.0%.
Realized volatility tells the other half of the story. It measures how much BB has actually been moving versus how much movement options are priced for. The 20-day realized figure of 74.9% is running well above this stock's own recent norm. That reading is compared against BB's own recent history, so "unusually high" here means unusual for BB, not versus the broader market.
Premium rich or cheap? The volatility risk premium is the gap between how much movement options are priced for and how much BB has actually delivered. When it is positive, option sellers have been collecting more than realized movement cost them. Right now it is negative: options are priced about 17 vol points below what BB has delivered over the past 20 days.
That gap sits at the 8th percentile of this stock's own recent readings, so premium is thinner than about 92% of them. The implied-minus-realized gap is also stretched unusually far below its norm for this name.
The path matters too. The premium was positive at about 16 points on October 1, crossed zero around October 7 as the selloff began, and has deepened since. No earnings report sits anywhere near this window, so this is a genuine "options are cheap relative to movement" reading, not a mechanical artifact.
The combination is IV rank in the low 20s and an 8th-percentile premium over delivered movement. That favors owning premium through debit structures this week over collecting it.
Skew and sentiment
Skew captures the fact that puts and calls the same distance from the stock price don't cost the same. When puts are pricier, traders are paying up for crash protection. BB runs the other way:
- 25-delta calls carry about 125.2% IV versus 98.0% for comparable puts. Calls cost about 27 vol points more than puts.
- BB's 60-day norm is about 15 points of call premium, so the call side is noticeably more stretched than usual.
- Traders are still paying up for upside exposure even after a 9.5% drop. That is not what capitulation usually looks like in the options pit.
Sentiment in short-dated options leans bullish:
- The 0–7 day read is +16 and the 7–30 day read is +39.
- Both are softer than their 7-day averages of +29 and +41.
- The overall regime reads "Mixed," because the 30–60 day and 60–120 day expirations are roughly flat.
Our leading positioning read also flags a divergence: price has fallen over the past two weeks while the flow-based read has firmed. Conditions like that have historically preceded a turn, but this is an early, unconfirmed read.
Two caveats keep this from becoming a strong call:
- The broader flow composite is essentially flat. It reads +3 today against a 7-day average of −6.
- Friday's total options volume was only 0.37 times its 20-day average, so the session was quiet.
The key levels map
| Level | Price | Why it matters |
|---|---|---|
| 52-week high | $13.59 | Far outside this window; marks the top of the yearly range |
| Whole-chain heaviest call strike | $10.00 | 79,155 calls open across all expirations, also the largest gamma strike; the bigger-picture ceiling |
| Call wall (October 23) / 100-day average | $9.00 | Heaviest call OI for this expiration (2,523 contracts), stacked on the 100-day moving average |
| Swing resistance | $8.83 | Recent pivot cluster just above the implied range |
| Implied range top | $8.77 | Upper edge of the October 23 expected move |
| 20-day moving average | $8.72 | Price is 7.6% below it; reclaiming it would undo the week |
| Max pain (October 23) | $8.50 | Price where the most option value would expire worthless; expirations sometimes gravitate toward it |
| 50-day moving average | $8.37 | First moving average overhead |
| Technical resistance | $8.25 | Chart models' key resistance (13-period EMA) |
| Swing resistance | $8.21 | Nearest pivot overhead; the bearish trade's kill switch |
| Spot | $8.06 | Friday's close |
| Swing support | $8.01 | Pivot cluster; also the October 15 gap-down open |
| Put wall (October 23 and whole chain) | $8.00 | Heaviest put OI for this expiration (3,710 contracts) and across all expirations (22,273) |
| Technical support | $7.93 | Chart models' support (lower Bollinger Band) |
| Swing support | $7.85 | The article's invalidation level |
| Swing support | $7.66 | Next pivot; near the 6-day chart range low |
| Swing support | $7.46 | Deeper pivot |
| Implied range bottom | $7.35 | Lower edge of the October 23 expected move |
| Large gamma strike | $7.00 | Fourth-largest gamma concentration in the chain |
| 200-day moving average | $6.61 | Long-term trend line, still well below price |
| Gamma flip (estimate, whole chain) | ≈ $1 | One rough estimate puts the flip far below spot, so not a factor this week |
Positioning and unusual flow
Dealer gamma describes how market makers hedge the options they've sold. One rough estimate across the whole chain puts BB in positive territory, where hedging tends to dampen moves. The gamma flip level is the price below which market-maker hedging tends to accelerate selling rather than cushion it, and that estimate sits around $1. Spot is unusually far above it compared with BB's own history.
The regime that matters for the next six days is the October 23 expiration's own, and its estimate is negative. Within that expiration, hedging tends to amplify moves rather than absorb them. So the two estimates disagree, and the near-term one argues that a break of a wall could run rather than stall.
Three live contracts stand out:
- November 6 $7 calls: 450 contracts traded against just 13 open, about 35 times open interest, worth roughly $50,400 in premium. Someone bought deep in-the-money upside exposure on a down day.
- October 30 $7.50 puts: 718 contracts traded against 112 open, about 6 times open interest, roughly $9,000 in premium. That is downside protection below the put wall, small in dollars but heavy relative to the line's history.
- November 20 $10 calls: the largest single open line in that expiration at 23,782 contracts. They added 674 on 1,473 traded, so the longer-dated upside crowd is still adding.
3 · Technical check
3-day report (target October 20). The near-term chart model is bearish, with a $7.92 target and a projected range of $7.70–$8.16. The target sits inside the options-implied range, but the direction contradicts the options lean, so this diverges. Its dominant scenario (bearish continuation) is invalidated by a close above $8.30. The most decisive reading is trend strength: ADX near 30 with sellers' directional strength (−DI 35.8) far above buyers' (+DI 16.8). That is a firm short-term downtrend.
6-day report (target October 23). Also bearish, targeting $7.90 with a projected range of $7.65–$8.30. Its dominant scenario is invalidated by a close above $8.40. The one counter-signal both reports flag is money flow turning mildly positive (CMF +0.074) while price made new lows, which hints at accumulation. Both also note the high-volume red bar near the lows as a possible exhaustion sign. The charts name $7.93 as support and $8.25 as resistance.
Model vs. Market: The options market implies $7.35–$8.77 into October 23; the 6-day technical model targets $7.90. The chart model's target sits only $0.10 under the put wall. A close below $7.93 and then $7.85 would hand the argument to the charts, while a reclaim of $8.25–$8.30 would side with options positioning.
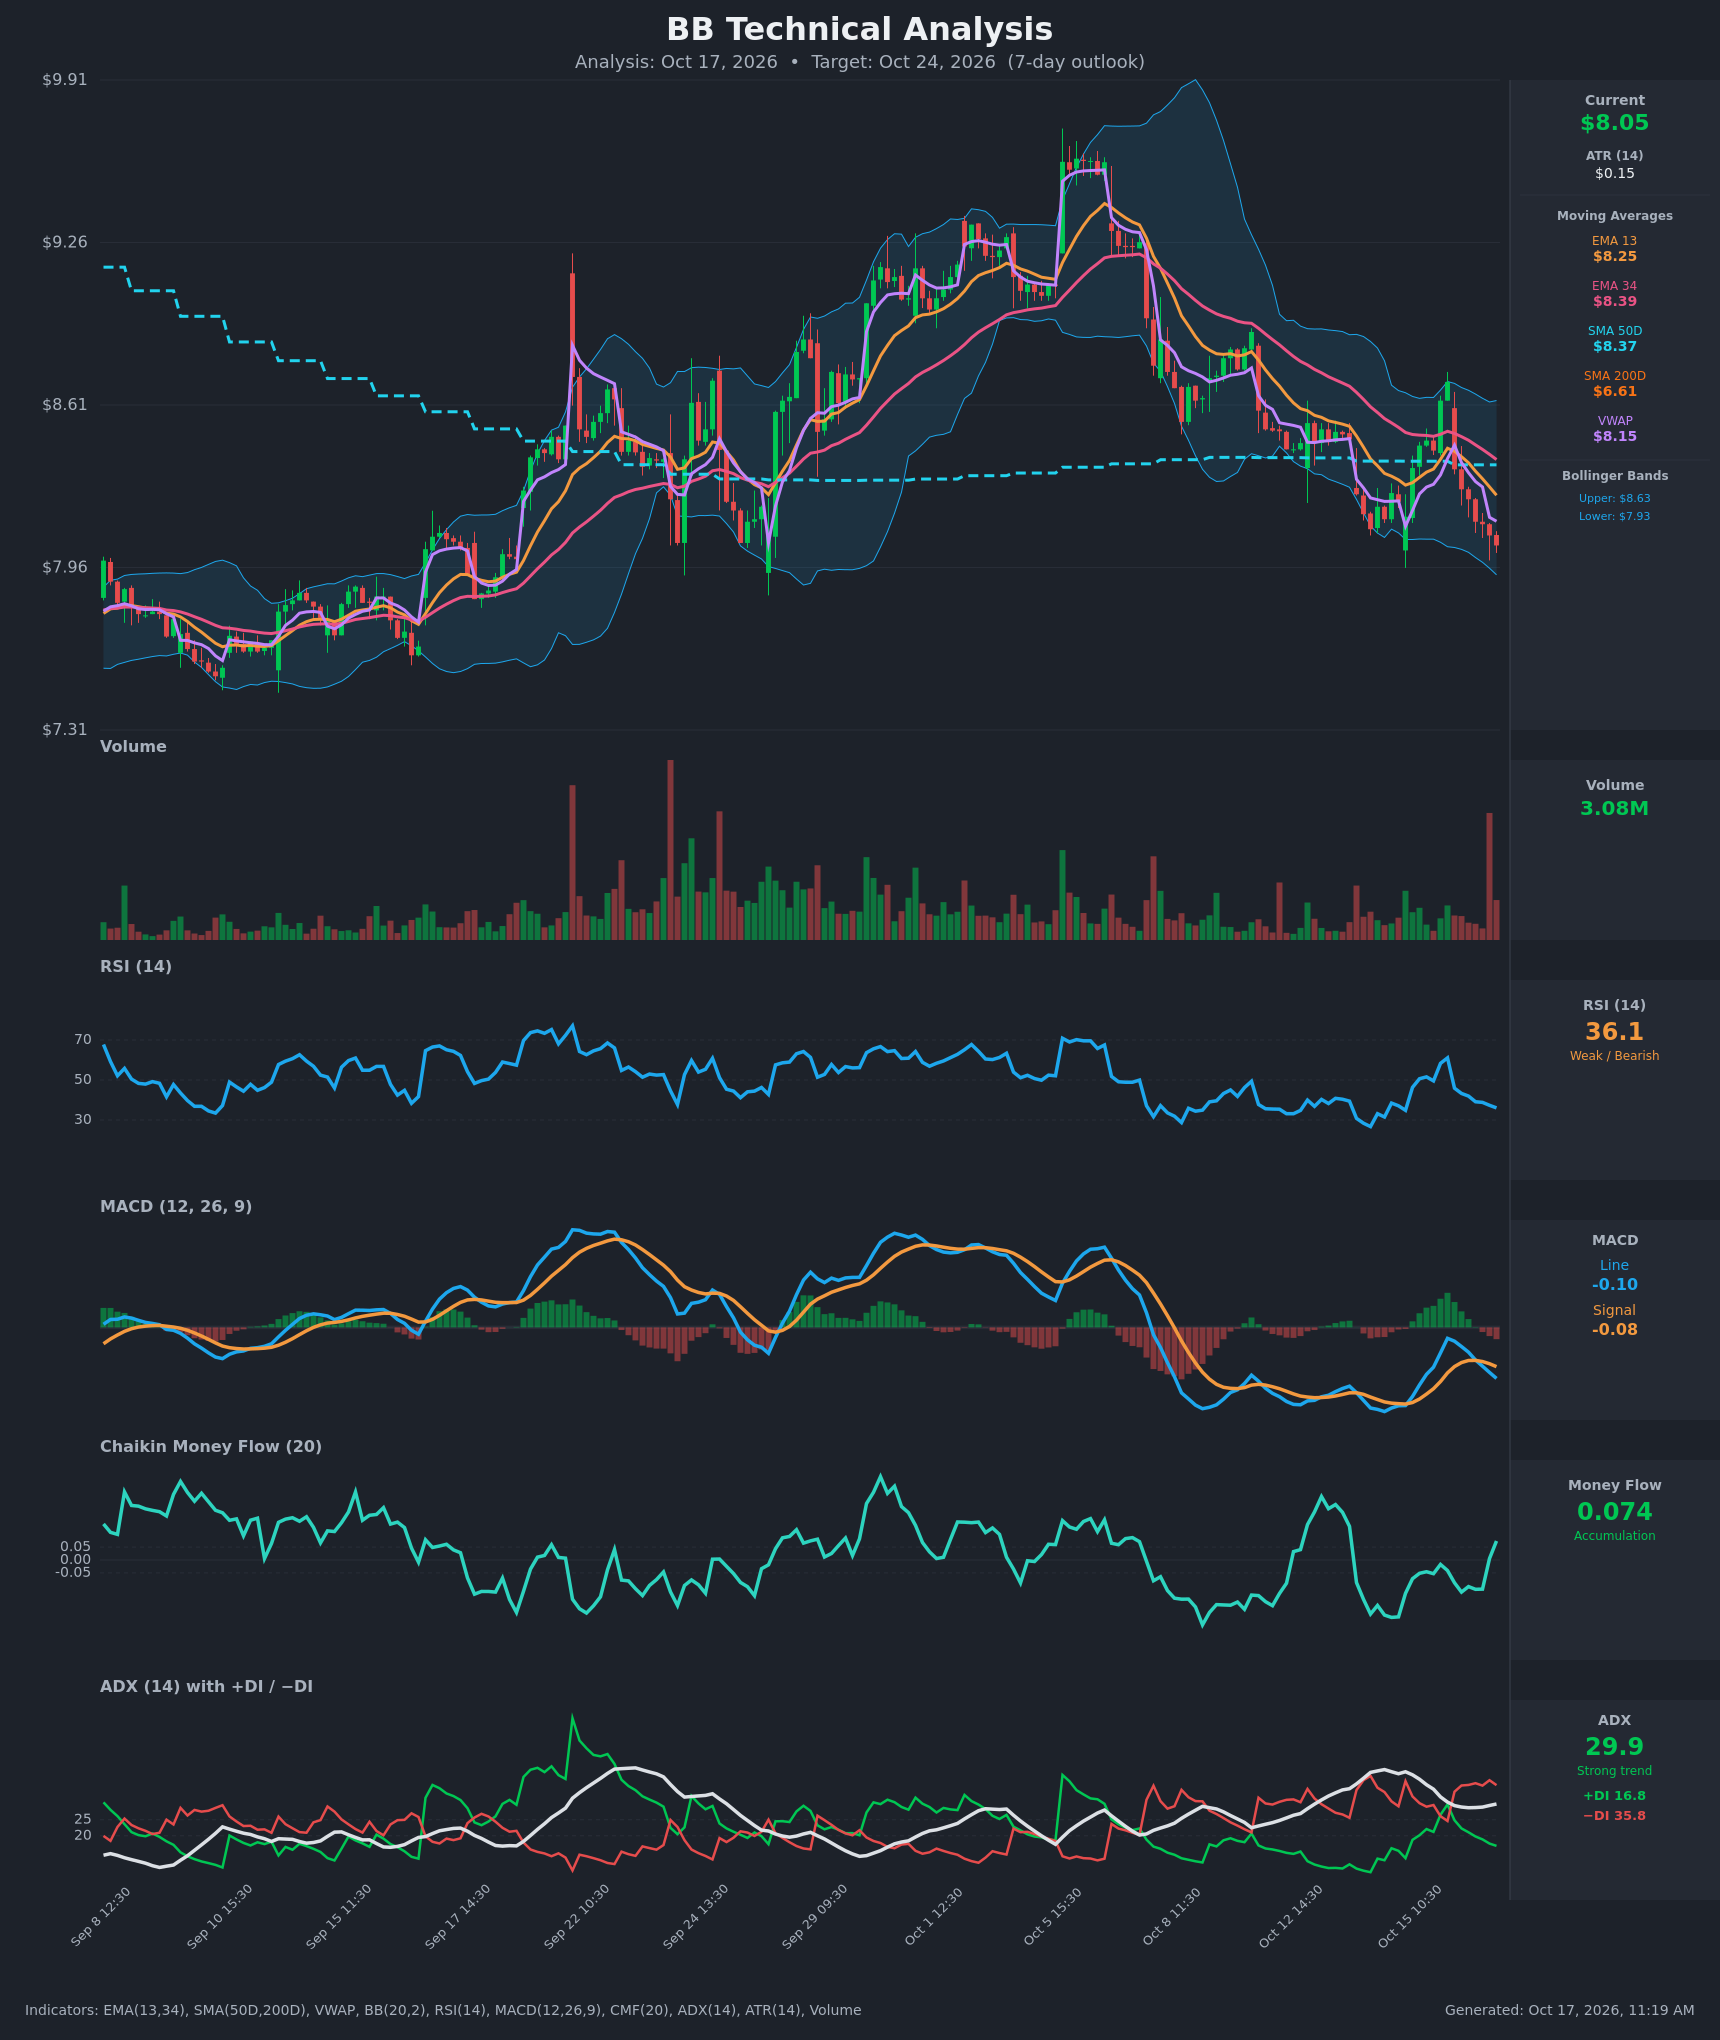
Full technical write-ups: 3-day report → · 6-day report →
The bearish chart read did not change the bullish strikes. It did shape the bearish spread's short leg at $7.50, just under the 6-day model's $7.65 range floor. It also keeps the invalidation level tight at $7.85.
4 · Three ways the next six days can go
If BB pushes above the call wall ($9.00): That would take price through the top of the implied range and the 100-day average in one move. The heaviest October 23 call OI sits there and tends to slow rallies. A clean break leaves thinner positioning until the whole-chain $10 strike.
If BB drifts between the walls: This is the pin case. With spot at $8.06, max pain at $8.50 and walls at $8 and $9, expiring open interest tends to pull price into the middle of the corridor into October 23. That is why the bullish and range structures below both aim at $8.50.
If BB breaks below the put wall ($8.00): This is the acceleration case. The October 23 expiration's own gamma estimate is negative, so hedging tied to that expiration tends to amplify a break rather than cushion it. The whole-chain flip estimate (~$1) offers no safety net nearby. A close below $7.85 lines up with the chart models and opens $7.66, then the $7.35 lower rail.
5 · Three defined-risk structures
Prices are end-of-day midpoints as of October 16, 2026. All structures are hypothetical unless flagged as an entered position. Verify live prices before trading, since these will be stale by the open.
With options priced below delivered movement, debit structures lead this week. BB is a single-digit stock, so bid-ask spreads are wide relative to option prices. Use limit orders near the midpoint and expect some slippage.
A debit spread is a trade where you pay up front, cap your risk at that payment, and profit if the stock moves your way. A credit spread works the opposite way: you collect up front and profit if the stock stays away from your short strike.
If you lean bullish: $8/$8.50 bull call spread
- Trade: Buy the October 23 $8 call, sell the October 23 $8.50 call.
- Debit: $0.22 ($22 per spread) · Max profit: $0.28 ($28) · Max loss: $0.22 ($22) · Break-even: $8.22
- Why it fits: Spot sits just above the $8 put wall, max pain is at $8.50, and options are cheap relative to how much BB has been moving, so owning premium is the better side. The short strike sits right at max pain, where pin dynamics would work in your favor.
- Makes sense only if: BB holds $8 through the October 20 checkpoint.
- Invalidated if: BB closes below $7.85.
- Managing it: Take profits at about 50–60% of max profit. With the past week's direction still pointing down, don't overstay. Exit by October 22 regardless, to avoid expiration-day pin risk on the short $8.50 call.
- Liquidity note: The $8 calls traded 13¢ wide today, about 40% of their midpoint, so slippage is real. The $8.50 calls were 3¢ wide. Work the order at mid.
- Analyze this position →
If you expect the range to hold: $8/$8.50/$9 call butterfly
- Trade: Buy one October 23 $8 call, sell two October 23 $8.50 calls, buy one October 23 $9 call.
- Debit: $0.15 ($15) · Max profit: $0.35 ($35) at $8.50 · Max loss: $0.15 ($15) · Break-evens: $8.15 and $8.85
- Why it fits: This is the pin trade. Its wings sit on the $8 put wall and the $9 call wall, and its center is $8.50 max pain. A classic iron condor here would collect only about 4¢ against roughly 46¢ of risk, and you would be selling premium that hasn't been rich lately. The butterfly expresses the range view as a small debit instead.
- Makes sense only if: BB drifts back up into the walls' corridor. At today's $8.06 the position is below its lower break-even.
- Invalidated if: BB closes below $7.85 or above $9.00.
- Managing it: Butterflies pay most in the final days, so be patient. Take 50% of max profit if offered, and close by October 22.
- Liquidity note: The $8 calls are 13¢ wide, the $8.50 calls 3¢ wide and the $9 calls 1¢ wide. The $8 leg dominates the slippage cost.
- Analyze this position →
If you lean bearish: $8/$7.50 bear put spread
- Trade: Buy the October 23 $8 put, sell the October 23 $7.50 put.
- Debit: $0.19 ($19) · Max profit: $0.31 ($31) · Max loss: $0.19 ($19) · Break-even: $7.81
- Why it fits: Both chart models point to about $7.90. The October 23 negative-gamma estimate means a put-wall break could accelerate. The short $7.50 strike sits just under the 6-day model's $7.65 floor.
- Makes sense only if: BB loses $8.00 on a closing basis early in the window.
- Invalidated if: BB closes above $8.21.
- Managing it: Take profits near 50% of max. If BB reclaims $8.21, close rather than hope. Exit by October 22 regardless.
- Liquidity note: The $8 puts traded 4¢ wide, the tightest leg in this expiration. The $7.50 puts were 8¢ wide.
- Analyze this position →
If none of these: no trade
Standing aside is a legitimate call this week. The positioning lean is mild, and the chart models are pointed the other way. Premium is too thin to make credit structures worth the risk.
Wide spreads are the bigger problem. On a single-digit stock they consume a meaningful slice of every trade's edge: the 13¢ spread on the $8 calls alone is more than half the bull spread's debit. If you can't get filled near the midpoint, or you don't want to stake a view on whether $8 holds, waiting for October 20 to show which side of the wall BB chooses costs you nothing.
6 · Quick FAQ
What is BB's expected move into October 23? About ±$0.71 (±8.79%), or roughly $7.35 to $8.77. That is based on the options market's straddle pricing as of October 16.
Is BB expected to go up or down over the next six days? Options positioning as of October 16 leans slightly bullish, because spot sits just above the $8 put wall with call skew still elevated. That is a read of what traders have done, not a forecast. The actionable map is the $7.35–$8.77 range and the $8/$9 walls.
Are BB options expensive right now? No. IV rank is 21.91/100, so IV sits in the lower part of its yearly range. On top of that, options are priced about 17 vol points below the movement BB has actually delivered, thinner than about 92% of this stock's own recent readings. That favors buying premium over selling it.
Where are BB's biggest options support and resistance? The October 23 put wall is at $8 and the call wall at $9, with max pain at $8.50. Across all expirations the heaviest call strike is $10.
What invalidates this read? A BB close below $7.85.
Methodology & disclosures. Data: end-of-day options-chain snapshot for BB, October 16, 2026, generated 2026-10-17T11:18:58.261Z. Prices shown are midpoints and will differ from live markets. Momentum/positioning scores and volatility-premium comparisons are descriptive measurements of past option flow and past price movement — not investment advice, signals, forecasts, or guarantees. All trade structures are hypothetical. Every structure shown has a defined maximum loss; you can lose the entire max-loss amount. Options involve substantial risk and are not suitable for all investors.