BB Options Are Pricing a ±$1.28 Move by September 25 — The Chart Model Sees One-Eighth of That
BB's options market is pricing a $6.71–$9.27 range into the September 25 expiration, while the technical model projects a move of barely 16 cents. Here's what the positioning actually says, where the walls sit, and three defined-risk ways to trade a rich-premium, no-edge tape.
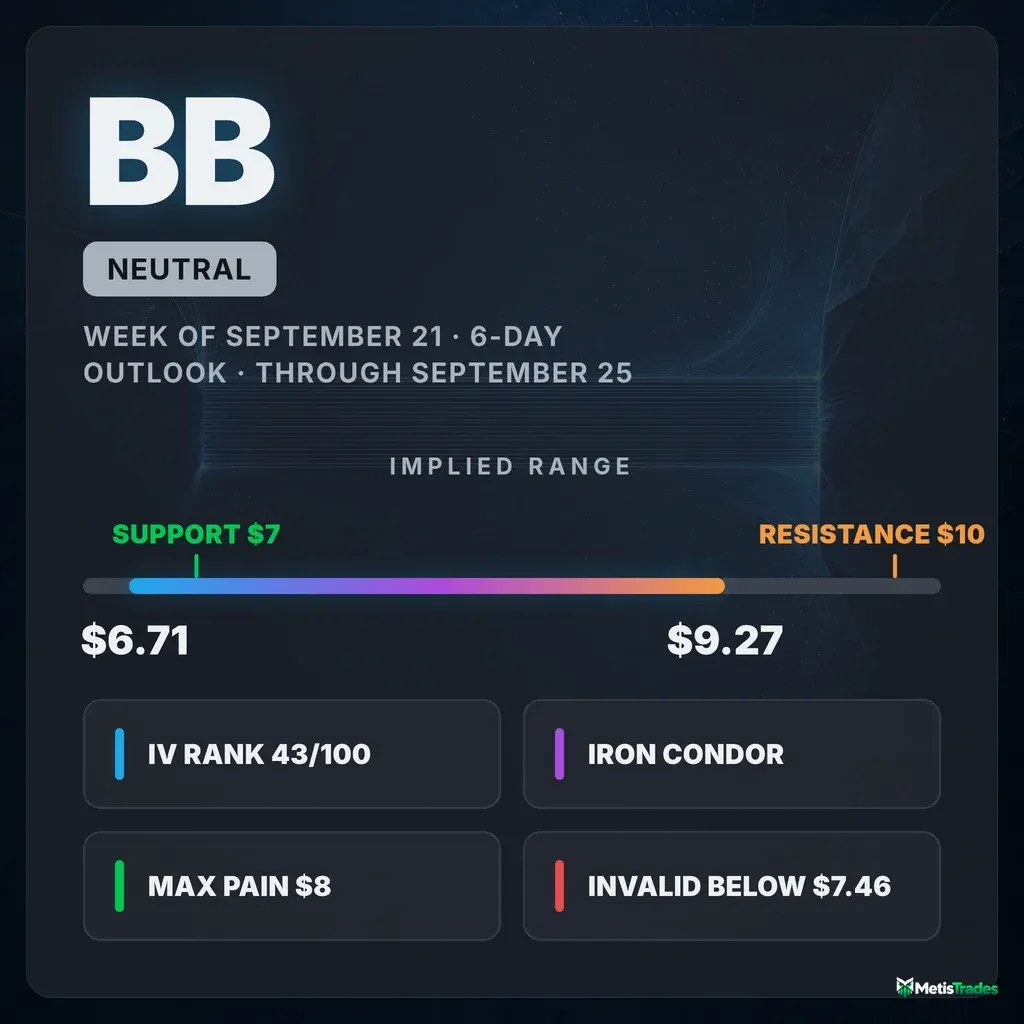
The options market implies a $6.71–$9.27 range into the September 25 expiration; here's what's driving it and three defined-risk ways to trade it.
Published Saturday, September 19, 2026 · Data as of Friday, September 18 close
Explore the live BB options data in the Detailed Options Analyzer →
Quick answer
| Item | Answer |
|---|---|
| Market bias | Neutral |
| Last close | $7.99 |
| Options-implied range (into September 25) | $6.71 – $9.27 (±$1.28, or ±15.98%) |
| Major support | $7.00 (put wall, September 25 expiration) |
| Major resistance | $10.00 (call wall, September 25 expiration) |
| Max pain (September 25) | $8.00 |
| Dealer gamma regime (estimate) | Positive — hedging tends to dampen moves; flip level ≈ $1.50 on one rough estimate, far below the current price |
| Volatility condition | Rising — IV rank 42.6/100 · premium rich: options priced about 21 vol points above delivered movement |
| Technical check | Mixed (bullish, 3-day and 6-day models — targets sit deep inside the implied range) |
| Best-fitting strategy | Iron condor — $7/$6 puts and $9/$10 calls, September 25 |
| Analysis invalidated if | BB closes below $7.46 |
1 · What matters today
BB closed Friday, September 18 at $7.99 after a 4.2% five-session bounce, and the options market is pricing a move of roughly $1.28 in either direction through the September 25 expiration — that's the move implied by what straddles cost, and it works out to a $6.71–$9.27 range. Our read of the flow lands neutral: call-side open interest is building fast, but the short-dated sentiment read is flat and the skew has quietly tilted back toward puts, so the signals cancel. The two levels that matter are the heaviest open-interest strikes for that expiration: $7.00 on the put side and $10.00 on the call side, with max pain — the price where the most option value expires worthless — sitting at $8.00, a penny under the close. The chart models lean modestly higher but target a move an order of magnitude smaller than the options are pricing. A close below $7.46 is what would break this read.
2 · What the options market is pricing
What changed this week
Money moved to the call side and volatility got more expensive. At-the-money implied volatility — the market's estimate of how much BB will move, baked into option prices — finished at 77.3%, up 3.7% on the day, 7.5% over five sessions and 16.3% over the past month. That lifted the IV rank to 42.6/100 against a 7-day average of 37.9 and a 14-day average of 38.3. On the positioning side, call open interest grew by roughly 11,000 contracts on Friday against about 1,800 on the put side, pushing the put/call open-interest ratio to 0.24 — for every call contract held open there are now only 0.24 puts, versus a 14-day average near 0.31. Total option volume ran 1.55× its 20-day average, and share volume was 1.43× its own 20-day norm.
The single biggest non-expired open-interest build was in the October 30 $10.50 calls, which went from 7 contracts held open to 2,096 — a position built essentially from scratch. Closer in, the October 16 $9 calls added 1,169 contracts on 4,186 of volume and $156,975 of traded premium, the heaviest live line on the board. Into Friday's now-settled expiration, the $9 puts traded 3,181 contracts for $316,509 of premium and the $8 calls turned over 5,659 contracts while shedding 342 of open interest — settled history, not a live level.
The bigger picture disagrees with the week. Our short- and long-term trend reads are pointing in different directions: BB is up 4.2% over the past week but down 30.1% over roughly the past two and a half months, with the ~20-day read sitting flat in between. A bounce inside a downtrend is still a bounce, and it argues for keeping directional exposure short-dated and taking profits early rather than pressing a trend that only exists on the shortest horizon.
Expected move
Into the September 25 expiration the options market is pricing ±$1.28 (±15.98%) around $7.99 — the move derived from what at-the-money straddles cost, which spans $6.71 to $9.27. That is an enormous one-week band for a $8 stock, and it is the single most important number in this article.
| Expiration | Implied move | Range around $7.99 |
|---|---|---|
| September 25 (7 DTE) | ±15.98% | $6.71 – $9.27 |
| October 2 (14 DTE) | ±18.11% | $6.54 – $9.44 |
| October 16 (28 DTE) | ±21.66% | $6.26 – $9.72 |
Notice how little the band widens as you go out: four times the calendar time buys only about 36% more range. That is because the front rung is doing far more work per day than the back rungs — the September 25 contracts carry an at-the-money implied volatility near 115.4%, against 78.2% at the October 16 expiration. The richness in this chain is concentrated in the next six days.
Volatility
Chain-wide at-the-money IV is 77.3%, above its 30-day average of 69.1% but still below its 90-day average of 84.5% — volatility is rebuilding from a lull, not spiking to an extreme. IV rank of 42.6/100 says option prices are cheaper than about 57% of the past year's readings; the percentile tells a slightly different story, with today's IV above 76% of individual days over the past year, which is what happens when a few violent sessions stretch the top of the 52-week range. The front-month versus 60-day comparison is unavailable today because Friday was an expiration day and the nearest contract had zero days left — a normal expiry-day artifact, not missing data.
Meanwhile the stock itself has been slowing down. Twenty-day realized volatility is 56.1% but the 10-day figure is just 32.3%, and the 5-day-versus-20-day realized ratio sits well below 1 — compared against BB's own recent history, actual movement has been decelerating even as options got more expensive.
Premium rich or cheap: the volatility risk premium — the gap between how much movement options are priced for and how much BB has actually delivered — is running about 21 vol points positive. When that gap is positive, option sellers have been collecting more than realized movement cost them. At the 78th percentile, today's gap is richer than about 78% of this stock's own recent readings, and the snapshot confirms the same thing from a second angle: the implied-versus-delivered spread sits comfortably above its own norm. The gap dipped to about 14 points midweek and has widened each of the last two sessions as IV climbed and realized vol cooled. No earnings report is anywhere near this window, so nothing mechanical is inflating the number. That combination — a mid-range IV rank but a 78th-percentile premium over delivered movement — favors collecting premium over owning it this week, which is why the credit structures lead the trade section below.
Skew and sentiment
BB carries reverse skew: options the same distance either side of the stock price don't cost the same, and here it's the calls that are expensive. The 25-delta put trades at 74.2% implied volatility against 83.8% for the 25-delta call — a 9.5-vol-point gap in favor of calls, meaning traders are paying up for upside, not crash protection. But against a 60-day median gap of 10.7 points, today's reading has flattened by about 1.2 points, and over the past five sessions the skew has steepened toward puts — a small, persistent drift of hedging demand back into the picture underneath a call-dominated surface.
Put/call volume ran 0.31 on Friday, essentially at its 7-day average of 0.30 and its 60-day median — for every put traded there were roughly three calls. Sentiment across expirations is lopsided in a specific way: the 0–7 day bucket reads flat at −1, the 7–30 day bucket is moderately bullish at +26, and the 30–60 day bucket is pinned at +91, an isolated hump of call-side positioning well out the curve while the front end sits neutral. Against BB's own norm, the drift of open interest toward calls is running unusually strong — one of the most stretched readings in the whole snapshot — but none of that call enthusiasm is showing up in the contracts that expire inside our window.
The key levels map
| Level | Price | Why it matters |
|---|---|---|
| 52-week high | $13.59 | 41.2% above spot — context only |
| Call wall (September 25) | $10.00 | 4,161 contracts held open; also the whole chain's heaviest call strike at 76,264 — the two agree, which is unusual and makes this the hard ceiling of the map |
| Swing resistance | $9.34 / $9.69 | Prior pivot clusters from the price structure |
| Top of implied range | $9.27 | Upper rail of the one-week expected move |
| Second-heaviest Sept 25 call strike | $9.00 | 2,385 contracts open, 1,221 traded Friday; a gamma cluster before the wall |
| Swing resistance | $8.83 | Nearest meaningful price-structure ceiling |
| 50-day / 100-day moving averages | $8.52 / $8.49 | 6.2% and 5.9% above the close — the overhead the bounce hasn't reached |
| Swing resistance | $8.20 / $8.01 | Immediate overhead; the technical model flags $8.21 as its own resistance |
| Max pain (September 25) | $8.00 | Where the most option value expires worthless; also the third-largest gamma strike chain-wide |
| Spot | $7.99 | Friday's close |
| 20-day moving average | $7.85 | 1.8% below — the bounce is holding above it |
| Swing support | $7.66 / $7.46 | The $7.46 level is this article's invalidation line |
| Put wall (September 25) | $7.00 | 3,637 contracts open for this expiration and 20,955 chain-wide — the strike with the biggest pile of open puts, and the second-largest gamma strike |
| Bottom of implied range | $6.71 | Lower rail of the one-week expected move |
| 200-day moving average | $6.15 | 29.8% below — the long-term trend line is still far underneath |
| Gamma flip estimate | ≈ $1.50 | One rough estimate only, and it sits so far below spot that the dampening regime isn't realistically in play this week |
Positioning and unusual flow
On one rough estimate — built on an assumed convention about which side of these options dealers hold — the September 25 expiration sits in a positive gamma regime, where market-maker hedging tends to dampen moves rather than amplify them, and the same estimate holds for the chain as a whole. Compared against BB's own history, the current price sits unusually far above that estimated flip level, which is another way of saying the fragile side of this map is a long way down.
Three live flows stood out on Friday. The October 16 $9 calls traded 4,186 contracts against 4,741 open — $156,975 of premium, the largest non-expired line of the day, and a 1,169-contract net build in open interest. The October 16 $10 calls turned over 2,750 contracts on 2,157 open for $60,500 of premium. And on the other side, the September 25 $6 puts traded 613 contracts against just 53 open — an 11.6× turnover on a contract worth 1.5 cents at the mid, which is a cheap tail hedge rather than a conviction bet, but it's the only genuinely unusual put print on the board.
3 · Technical check
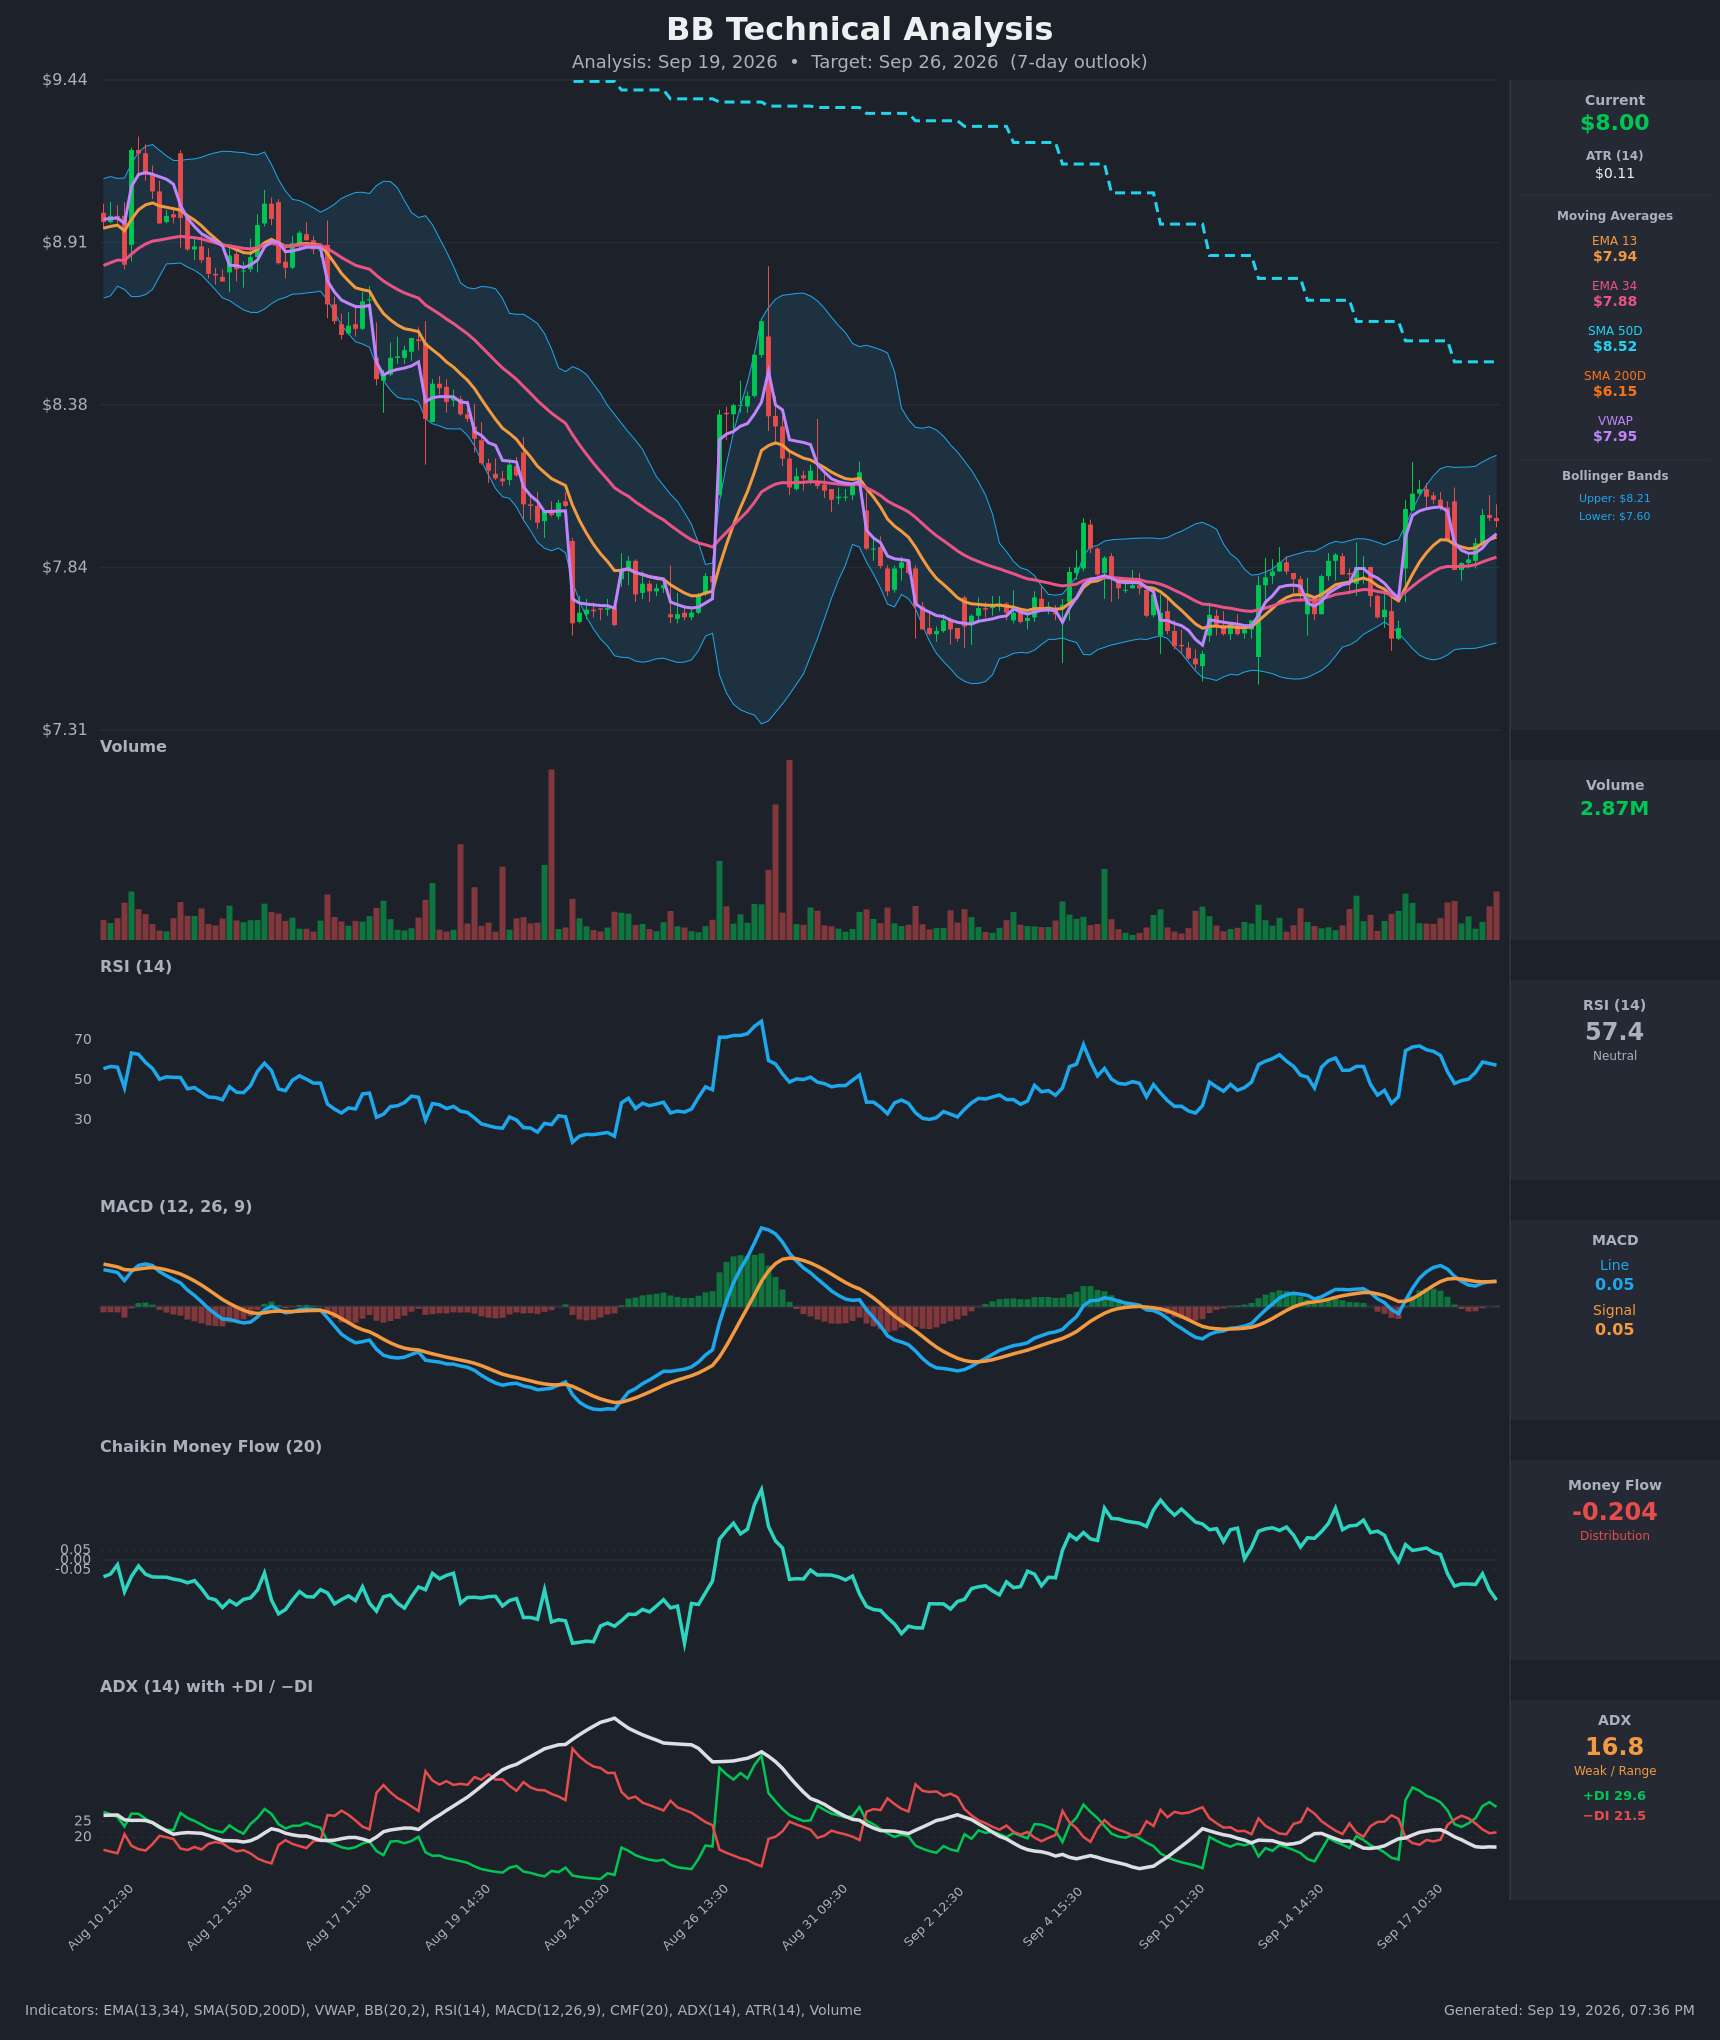
Both chart models lean bullish and both lean gently. The 3-day model (target date September 22) projects $8.12 with a range of $7.80–$8.22; the 6-day model, which lands exactly on our September 25 expiration, projects $8.15 with a range of $7.70–$8.30. Both cite the same structure: a fresh short-term moving-average crossover with the directional index favoring bulls, but an ADX of 16.8 confirming a weak, choppy trend rather than a real impulse — and a persistently negative money-flow reading of −0.20 that has not improved while price has bounced, which the reports flag as distribution running underneath the rally.
Against our neutral options read, that is a mixed classification: the direction disagrees with our flat bias, but the target sits deep inside the options-implied range, so there is no real conflict about magnitude — only about which side of $8 the drift lands on. The interesting number is how much smaller the model's world is than the options market's. It didn't move the strikes below, but it did influence the shape: the technical resistance shelf at $8.21 and the model's $8.30 ceiling are both comfortably under the short call strikes used in the trades.
Model vs. Market: The options market implies $6.71–$9.27 into September 25; the 6-day technical model targets $8.15 inside a $7.70–$8.30 range. The options are pricing a band roughly four times as wide as the chart model's — someone is going to be very wrong about volatility, and the premium-seller is the one being paid to take that side.
Full technical write-ups: 3-day report → · 6-day report →
4 · Three ways the next six days can go
If BB pushes above the call wall ($10.00): that would require a 25% move in six days, which the options are technically pricing as possible but not as the base case. The path there runs through the $9.00 strike, where the second-heaviest block of September 25 calls sits — heavy call open interest overhead tends to slow rallies as it's hedged, and a clean break through $10 would leave thinner positioning above it until the $11 strike.
If BB drifts between the walls: this is the shape the positioning most naturally describes. Max pain for September 25 sits at $8.00, one cent under Friday's close, and the estimated gamma regime for that expiration is the dampening kind. With the stock's own realized movement decelerating and the biggest open-interest blocks sitting at $7 and $10, the middle of the map is where expiring contracts and hedging flows have the least reason to push price anywhere.
If BB breaks below the put wall ($7.00): the put wall is where the heaviest downside open interest is concentrated, both for this expiration and chain-wide, and it sits just above the lower rail of the implied range at $6.71. Below it, open interest thins quickly. The estimated gamma flip level is far below at roughly $1.50, so on that estimate the hedging regime itself wouldn't turn amplifying — but the absence of positioning below $7 means there's little structural cushion, and a close under the $7.46 swing support would be the first warning that the range is failing.
5 · Three defined-risk structures
Prices are end-of-day midpoints as of Friday, September 18. All structures are hypothetical. Verify live prices before trading — these will be stale by the open.
If you expect the range to hold: September 25 iron condor
- Trade: Sell the $7.00 put / buy the $6.00 put, and sell the $9.00 call / buy the $10.00 call, all expiring September 25
- Credit: $0.215 ($21.50 per condor) · Max profit: $21.50 · Max loss: $78.50 · Break-evens: $6.785 and $9.215
- Why it fits: the short strikes are the two walls themselves — $7.00 carries 3,637 open puts for this expiration, $10.00 is bounded by the long call. You collect premium that is running about 21 vol points above what BB has actually delivered, at the 78th percentile of its own recent readings, with max pain sitting a cent from spot.
- Makes sense only if: you accept that the options-implied range ($6.71–$9.27) is wider than your short strikes — the market is pricing a move that would breach this condor, and you are explicitly betting it doesn't happen.
- Invalidated if: BB closes below $7.46 or above $8.83 — either break makes the untested side irrelevant and the tested side urgent.
- Managing it: close at roughly 50% of the credit; exit the whole position by September 23 regardless, rather than carrying four legs into expiry-day gamma. If BB trades through $9.00 or $7.00, close the tested spread instead of hoping.
- Liquidity note: the $7 puts trade 2¢ wide and the $9 calls 3¢ wide; the $6 puts are a penny wide and the $10 calls 3¢. In absolute terms those are tiny, but on options priced under a quarter they are large percentage spreads — work the mid and don't pay the offer on four legs.
- Analyze this position →
If you lean bullish: September 25 $7.50/$7.00 put credit spread
- Trade: Sell the September 25 $7.50 put, buy the September 25 $7.00 put. You collect a credit up front and keep it if BB stays above $7.50.
- Credit: $0.145 ($14.50) · Max profit: $14.50 · Max loss: $35.50 · Break-even: $7.355
- Why it fits: the long leg sits exactly on the put wall, the strike with the biggest pile of open puts for this expiration, and the short strike sits between the 20-day average ($7.85) and the $7.46 swing support. Premium is rich versus delivered movement, so you're being paid a fair rate to sell that cushion.
- Makes sense only if: you think the bounce off the September 16 low holds and the short-term trend read wins over the two-and-a-half-month downtrend — a fight the shorter expiration deliberately limits.
- Invalidated if: BB closes below $7.46.
- Managing it: take profit at roughly 50–60% of the credit and don't be greedy — with the short-term direction running against the longer trend, earlier exits beat holding for the last few cents. Close on any daily close below $7.46.
- Liquidity note: the $7.50 puts traded 938 contracts for $24,857 of premium with a 5¢ spread on a 26.5¢ mid (about 19%); the $7 puts are 2¢ wide. Fills are workable but not free — quote the spread as a package.
- Analyze this position →
If you lean bearish: September 25 $8.50/$9.00 call credit spread
- Trade: Sell the September 25 $8.50 call, buy the September 25 $9.00 call. You collect a credit and keep it if BB stays below $8.50.
- Credit: $0.11 ($11.00) · Max profit: $11.00 · Max loss: $39.00 · Break-even: $8.61
- Why it fits: the short strike sits above the $8.20 swing resistance and above both chart models' projected ceilings ($8.22 and $8.30), and the break-even at $8.61 is still under the 50-day average at $8.52 plus a cushion. Call-side implied volatility is running 9.5 vol points above put-side IV, so the calls are the expensive side of this chain to sell.
- Makes sense only if: you read the persistent negative money-flow divergence the technical reports flag as the honest signal and the bounce as short-covering — and you're willing to be short calls into a chain where call open interest is being built aggressively.
- Invalidated if: BB closes above $8.83.
- Managing it: close at roughly 50% of the credit; exit by September 23 rather than holding to the bell. If BB closes above $8.61 you are already past break-even at expiry — close rather than hope.
- Liquidity note: the $8.50 calls are the best-quoted contract in this expiration — 1¢ wide on a 31.5¢ mid (about 3%), with 1,657 contracts traded and $52,195 of premium. The $9 calls are 3¢ wide. This is the cleanest fill of the three structures.
- Analyze this position →
If none of these: no trade
Premium here is genuinely rich — 21 vol points above delivered movement, richer than about 78% of BB's own recent readings, with no earnings report anywhere near the window to explain it away. And standing aside can still be the better call. Every credit above is 11 to 22 cents on a 50-cent-to-$1.00-wide spread, while each leg quotes 1 to 3 cents wide; on a four-leg condor, slippage can eat a fifth of your edge before the stock moves at all. More importantly, the premium is rich for a reason: the September 25 contracts carry an implied volatility near 115%, BB gapped 2.6% and 1.5% higher on consecutive sessions this week, and a single 8% gap runs straight through either short strike. If you can't watch the position or can't size it so the full max loss is survivable, the right trade on a neutral read with a wide implied move is no trade.
6 · Quick FAQ
What is BB's expected move this week? ±$1.28, or ±15.98%, into the September 25 expiration — a $6.71 to $9.27 range around Friday's $7.99 close, per the options market's straddle pricing as of September 18.
Is BB expected to go up or down over the next six days? Options positioning as of September 18 reads neutral — call-side open interest is building fast, but the short-dated sentiment bucket is flat and the skew has drifted back toward puts, so the signals cancel. That's a read of what traders have done, not a forecast. The actionable map is the $6.71–$9.27 range and the $7.00 / $10.00 levels.
Are BB options expensive right now? IV rank 42.6/100 says option prices are cheaper than about 57% of the past year's readings; on top of that, they're running about 21 vol points above the movement BB has actually delivered — richer than about 78% of this stock's own recent readings. The verdict: mid-range by the calendar, rich versus reality, which favors selling premium over buying it this week.
Where is BB's biggest options support and resistance? Put wall $7.00, call wall $10.00 for the September 25 expiration — and unusually, those are also the heaviest put and call strikes across the entire chain, so the two readings agree.
What invalidates this week's read? A close below $7.46. That's the lower swing support; beneath it, the next structural level is the put wall at $7.00 and then thin positioning.
Methodology & disclosures. Data: end-of-day options-chain snapshot for BB, 2026-09-18, generated 2026-09-19T19:36:40.925Z. Prices shown are midpoints and will differ from live markets. Momentum/positioning scores and volatility-premium comparisons are descriptive measurements of past option flow and past price movement — not investment advice, signals, forecasts, or guarantees. All trade structures are hypothetical. Every structure shown has a defined maximum loss; you can lose the entire max-loss amount. Options involve substantial risk and are not suitable for all investors.