CRWV Options Are Pricing an $8.30 Move Into Friday — The Chart Model Sees $87
CoreWeave options imply an $80.69–$97.29 range into the September 18 expiration, with the heaviest put open interest sitting right at Friday's close. Here's what the flow is pricing, where the levels are, and three defined-risk ways to trade the next four sessions.

The options market implies an $80.69–$97.29 range into the September 18 expiration; here's what's driving it and three defined-risk ways to trade it.
Published Monday, September 14, 2026 · Data as of Friday, September 11 close
Explore the live CRWV options data in the Detailed Options Analyzer →
Quick answer
| Item | Answer |
|---|---|
| Market bias | Slightly bullish |
| Last close | $88.99 |
| Options-implied range (into Sept 18) | $80.69 – $97.29 (±$8.30, or ±9.33%) |
| Major support | $90.00 (put wall, Sept 18 expiration) |
| Major resistance | $110.00 (call wall, Sept 18 expiration) |
| Max pain (Sept 18) | $91.00 |
| Dealer gamma regime (estimate) | Positive for the Sept 18 expiration — hedging tends to dampen moves; the all-expiration aggregate estimate reads negative. No flip level is computable from today's data. |
| Volatility condition | Falling — IV rank 5.58/100 · premium thin: options are priced about 4.6 vol points below the movement CRWV has actually delivered |
| Technical check | Diverges — 4-day chart model bearish ($87.00 target); 2-day model neutral ($88.75) |
| Best-fitting strategy | Call debit spread (long premium, defined risk) |
| Analysis invalidated if | CRWV closes below $85.00 |
1 · What matters today
CoreWeave closed Friday at $88.99, sitting almost exactly on the strike with the most put contracts held open for this Friday's expiration — $90.00. The options market is pricing a move of about $8.30 in either direction over the next four sessions, which is a range of roughly $80.69 to $97.29. That is a wide band for four days, and yet option prices themselves are historically cheap for this name: implied volatility ranks 5.58 out of 100 versus the past year, and options are currently priced for less movement than the stock has actually been delivering.
Our read of the options flow leans slightly bullish — short-dated sentiment, call open-interest building, and unusually flat put skew all tilt that way, with max pain at $91.00 just above spot. The chart models disagree, which is the interesting tension this week. The level that changes the picture is $85.00: a close below it and this read is wrong.
2 · What the options market is pricing
What changed this week
CRWV rallied 5.35% over the last five sessions — and is still down 15.90% over twenty. That split is the whole story. The short-term trend read is firmly positive on the back of last week's bounce, the two-month read is firmly negative, and the ~50-day read is flat: near-term flow and the bigger trend are pointing different ways, and the last confirmed momentum turn (a bearish-to-bullish crossover) is only about a week old.
Underneath that, positioning moved to the call side. Between Thursday and Friday, call open interest grew by 37,841 contracts against 18,419 for puts, and the put/call open-interest ratio — how many puts are held open for every call — fell from 1.08 to 0.92 over five sessions, against a 14-day average of 0.98. Puts have been thinning out, not building. Friday's trading was more two-sided: put/call volume came in at 0.86, well above the 7-day average of 0.65, so intraday hedging picked up even as the open-interest base kept tilting toward calls.
Implied volatility kept bleeding: at-the-money IV — the market's estimate of how much CRWV will move, baked into option prices — is 71.48%, down 8.67% on Friday alone and down 34.17% over thirty sessions, sitting well under both its 30-day average of 84.2% and its 90-day average of 90.4%. IV rank at 5.58/100 is lower than its own 7-day average of 10.5.
Expected move
Into the September 18 expiration, the options market is pricing a move of ±9.33%, or about ±$8.30 — that figure is the size of the move, derived from what at-the-money straddles cost, not a share price. Around Friday's $88.99 close, that maps to a range of $80.69 to $97.29.
| Expiration | Implied move | Range around $88.99 |
|---|---|---|
| Sept 18 (this week's target) | ±9.33% | $80.69 – $97.29 |
| Sept 25 | ±13.32% | $77.14 – $100.84 |
| Oct 16 (~1 month) | ±22.19% | $69.24 – $108.74 |
The ladder scales smoothly — each rung's at-the-money IV creeps up only slightly (67.4% at Sept 18, 68.0% at Sept 25, 71.7% at Oct 16), so there is no event hump distorting any single expiration. What you are paying for further out is time, not a specific scheduled catalyst.
Volatility
At-the-money IV of 71.48% sounds enormous in absolute terms, and for most stocks it would be — for CRWV it is cheap. An IV rank of 5.58 out of 100 means today's reading is lower than roughly 94% of the past year's readings, and the percentile measure is more extreme still. The direction is down: −8.67% on the day, −34.17% over thirty sessions, with only a modest +3.58% bump across the last five. The front-month versus longer-dated comparison is unavailable today — Friday was an expiration day, so that particular read can't be computed.
Two "vs its own norm" observations are worth pulling out, both measured against CRWV's own recent history rather than the broader market. Twenty-day realized volatility of 76.0% is actually unusually low for this stock. But the ratio of five-day to twenty-day realized movement is running well above its norm — CRWV's day-to-day swings have been accelerating over the past week even as the monthly baseline cooled off.
Premium rich or cheap: the volatility risk premium — the gap between how much movement options are priced for and how much CRWV has actually delivered — currently sits at about −4.6 vol points. Options are priced below recent delivered movement, which means option sellers have not been collecting enough to cover what the stock has actually cost them. That reading sits at the 39th percentile of this stock's own recent history — richer than only 39% of its recent readings, so thin by its own standards. Combined with an IV rank of 5.58, that mix favors owning premium over collecting it this week. The path matters too: three weeks ago the gap was roughly −62 vol points, it closed steadily to briefly positive on September 10, and slipped back to −4.6 on Friday. Most of that closing is mechanical — August's outsized daily swings have been rolling out of the 20-day realized-volatility window — not a change in trader behavior.
Skew and sentiment
Normally, puts and calls the same distance from the stock price don't cost the same, and puts are pricier because traders pay up for crash protection. Not here. The 25-delta put is marked at 70.65% implied volatility against 73.45% for the equivalent call — calls cost about 2.8 vol points more than puts, against a 60-day norm of roughly 0.5 points. Traders are paying a premium for upside exposure, not downside insurance, and that gap is wider than this name's own recent baseline.
Sentiment in short-dated options backs that up. The 0–7 day bucket reads +68 on a −100-to-+100 scale, driven entirely by calls building faster than puts; the 7–30 day bucket is a much milder +11; the 30–60 day and 60–120 day buckets read +34 and +40. Every bucket leans the same way — a broadly bullish term-structure read, and the 0–7 day bucket's 7-day average of +44 says it isn't a one-day artifact.
The counterweight: of the contracts that cleared the unusual-volume bar versus their peers on Friday, 8 were calls and 11 were puts — put-side sweeps dominating by a wider margin than is typical for this stock. That, plus the elevated put/call volume ratio, is why this article's bias is a lean rather than a conviction call.
The key levels map
| Level | Price | Why it matters |
|---|---|---|
| Call wall (Sept 18) | $110.00 | 62,249 calls open — the heaviest call strike for this expiration, and the whole chain's heaviest too (92,552). Both agree, but it sits far above the implied range. |
| Call cluster | $100.00 | 14,390 calls open at Sept 18 and one of the largest whole-chain gamma strikes; just outside the implied top. |
| Implied range top | $97.29 | Upper edge of what the options market is pricing for Friday. |
| Swing resistance | $94.75 | Heuristic swing-pivot cluster from recent price structure. |
| 200-day moving average | $91.88 | Price closed 3.15% below it — reclaimed or not is the bigger-picture tell. |
| Swing resistance | $91.41 | The nearest structural lid overhead. |
| Max pain (Sept 18) | $91.00 | The price where the most option value would expire worthless — expirations sometimes gravitate toward it. |
| 20-day moving average | $90.04 | Price is 1.16% below it. |
| Put wall (Sept 18) | $90.00 | 13,021 puts open — the biggest downside pile for this expiration, and the largest gamma strike in the whole chain. Price is sitting on it. |
| Last close | $88.99 | Friday's settle. |
| 50-day moving average | $85.53 | Price is 4.05% above it; the 4-day chart model treats a close below as its bearish trigger. |
| Secondary put shelf | $85.37 / $85.00 | Swing-support cluster at $85.37, with 11,164 puts open at the $85 strike for Friday. |
| Swing support | $83.23 | Next structural shelf down. |
| Implied range floor | $80.69 | Lower edge of what the options market is pricing for Friday. |
One caveat on the walls: the whole chain's heaviest put strike is far lower, at $60 with 51,816 contracts — but that is almost entirely long-dated October and December protection. For this week, the $90 line from the Sept 18 expiration's own book is the one that matters.
Positioning and unusual flow
Market makers hedge the options they've sold, and the direction of that hedging depends on the book. One rough estimate of the Sept 18 expiration's own positioning comes out positive — in that regime, hedging tends to dampen moves and pull price toward the heavy strikes. The all-expiration aggregate estimate reads the opposite, negative, which is the more fragile configuration; the two disagree, and for a four-day trade the Sept 18 read is the relevant one. Both are estimates built on an assumed dealer positioning convention, not observed inventory, and no gamma flip level is computable from today's data.
Three live flow items stood out (Friday's expiring contracts are excluded — those are settled history now):
- Sept 18 $90 puts: 4,331 contracts traded against 13,021 held open, roughly $1.65 million of premium — by far the largest single-contract dollar flow at this expiration. That is where the week's defense is concentrated.
- Sept 18 $92 calls: open interest grew by 1,303 contracts to 2,361 on 1,309 lots of volume — almost all of that volume was new positioning, just above max pain.
- Oct 23 $90 puts: 607 contracts traded against just 64 held open — a turnover of more than nine times, i.e. someone establishing fresh at-the-money downside further out, not adjusting an existing book.
Counterpoint on the downside: the Oct 16 $70 puts shed 8,091 contracts of open interest. Deep protection is being retired at the same time near-dated protection is being bought.
3 · Technical check
The near-term chart model (2-day horizon, checkpoint September 16) reads neutral, targeting $88.75 with a projected range of $87.30 to $90.20. Its case is a weak-trend environment: ADX at 18.3 confirms no real directional push, price is consolidating in a tight band beneath a declining short-term moving average, and money flow has been mildly negative. That target sits comfortably inside the options-implied range and points almost exactly at Friday's close — it neither confirms nor contradicts the options read. Call it a wash.
The 4-day model (target September 18, the same date this article is built around) is where the tension lives. It reads bearish, targeting $87.00 with a projected range of $85.00 to $90.50. Its most decisive inputs: a fresh bearish short-term EMA crossover, and ADX rising to 23.6 with the negative directional line clearly above the positive one — a strengthening downtrend, not a range. Its own invalidation is a sustained close back above $90.50. That target sits inside the options-implied range, but the direction contradicts the options positioning read, so this is a genuine divergence rather than a magnitude disagreement.
Model vs. Market: The options market implies $80.69–$97.29 into Friday with max pain at $91.00 and the heaviest puts parked at $90.00; the 4-day technical model targets $87.00. The gap resolves at $90.50 — a sustained reclaim kills the chart model's thesis, while a close below $85.00 kills ours.
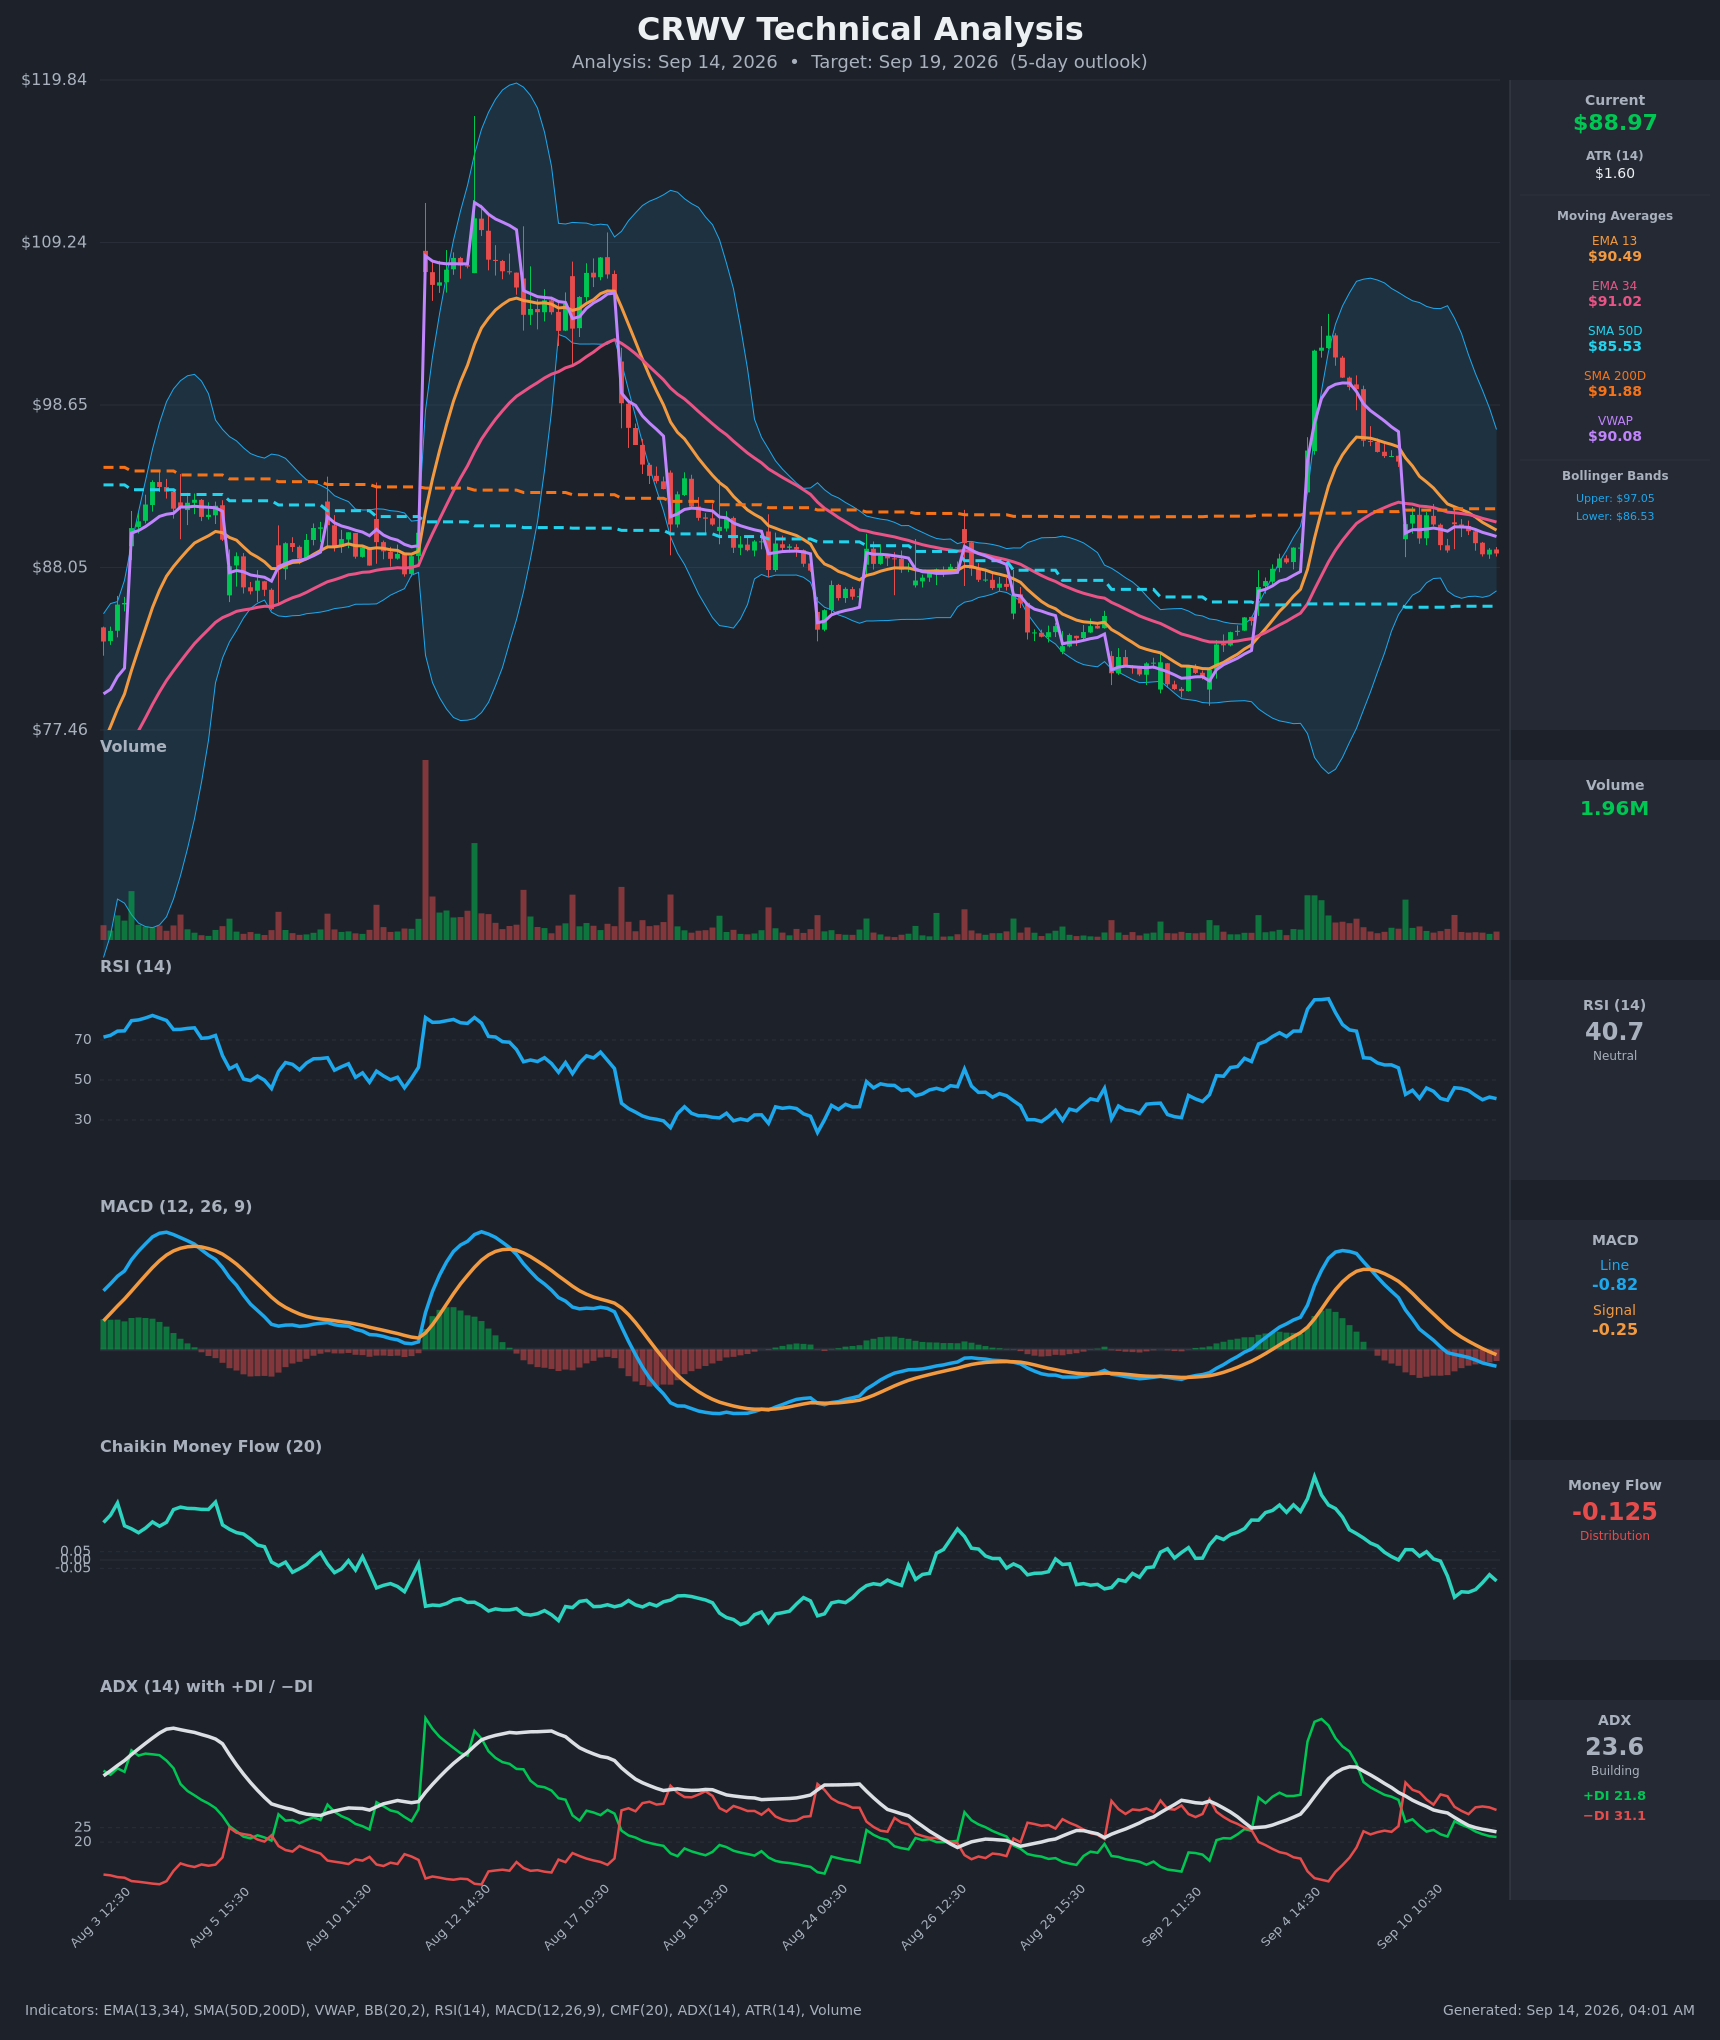
How the technicals adjusted the trades below: they didn't move the bias, but they did shorten the leash. The bullish structure is a defined-risk debit spread rather than anything naked, and the bearish structure below is shaded toward the chart model's $87.00 target rather than reaching for a bigger break.
Full technical write-ups: 2-day report → · 4-day report →
4 · Three ways the next four days can go
If CRWV pushes through $95 toward the call wall ($110): the $95 and $100 strikes carry 5,259 and 14,390 calls open for Friday, and the heaviest call open interest overhead tends to slow rallies as hedging flows meet supply. The call wall itself is roughly 24% above spot, well outside anything the options market is pricing for four sessions — so the practical ceiling this week is the $97.29 implied top and the $100 strike just beyond it, not $110.
If CRWV drifts between $88 and $92: this is the base case the positioning data describes. Max pain for Friday is $91.00, the heaviest put pile is at $90.00, and the Sept 18 book's own gamma estimate is the dampening kind. Expiring open interest and hedging flows in that configuration tend to pull price toward the cluster rather than away from it, which would mean a quiet grind back toward $90–$91 into Friday's close.
If CRWV breaks below the put wall ($90) and then $85: the $90 strike is already being defended with $1.65 million of premium; losing it removes the near-term floor and leaves the $85 shelf — 11,164 puts open, a swing-support cluster at $85.37, and the 50-day moving average at $85.53 — as the next dense zone. Below that, the aggregate dealer-positioning estimate turns negative, a regime in which hedging tends to amplify moves rather than cushion them. The implied floor at $80.69 is where the options market stops pricing meaningful probability this week.
5 · Three defined-risk structures
Prices are end-of-day midpoints as of 2026-09-11. All structures are hypothetical. Verify live prices before trading — these will be stale by the open.
If you lean bullish: Sept 18 $90/$95 call debit spread
- Trade: Buy the Sept 18 $90 call, sell the Sept 18 $95 call. You pay a net debit and you're betting the stock finishes above $91.56; the short strike caps what you can make.
- Debit: $1.56 ($156 per spread) · Max profit: $344 · Max loss: $156 · Break-even: $91.56
- Why it fits: IV rank of 5.58 and a premium running about 4.6 vol points below delivered movement make this the week to own optionality rather than sell it. The structure targets the zone the positioning data points at — max pain $91.00, the $90 put wall directly underneath, and short-dated term sentiment at +68.
- Makes sense only if: CRWV reclaims $90 early in the window; a spread that's still under $89 by Wednesday has very little time left to work.
- Invalidated if: CRWV closes below $85.00.
- Managing it: take profits at 60–70% of max value rather than holding for the full $344 — the last dollar of a four-day vertical is the most expensive to wait for. Because the week's up-move is fighting a two-month downtrend, exit rather than roll if $90 hasn't been reclaimed by Thursday, September 17.
- Liquidity note: the $90 calls were quoted $2.83/$2.87 (4¢ wide, about 1.4% of mid) and the $95 calls $1.26/$1.32 (6¢); both traded heavily Friday. Fills should be straightforward.
- Analyze this position →
If you expect the range to hold: Sept 18 $79/$82/$97/$100 iron condor
- Trade: Sell the $82 put / buy the $79 put, and sell the $97 call / buy the $100 call, all Sept 18. You collect a credit up front and keep it if CRWV finishes between $82 and $97.
- Credit: $0.79 ($79) · Max profit: $79 · Max loss: $221 · Break-evens: $81.21 and $97.79
- Why it fits: the short strikes sit just inside the implied rails ($80.69 and $97.29), and the Sept 18 book's own gamma estimate is the dampening kind. Four days of time decay against a positive-gamma expiration is the cleanest version of this trade.
- Health warning: you're selling premium that hasn't been rich lately — the volatility risk premium is negative and sits at only the 39th percentile of this stock's own recent readings, so the odds are not being generously priced. Size accordingly, or skip this one.
- Makes sense only if: you believe last week's ±5% daily swings are done; CRWV gapped 4.02% up on September 8 and 5.30% down on September 10, and either one of those inside four days runs straight through a short strike.
- Invalidated if: CRWV closes outside $82.00–$97.00 at any point in the window.
- Managing it: close at roughly 50% of max credit; exit regardless by Thursday, September 17 rather than carrying expiration-day pin risk. If either short strike is breached on a close, close the tested side rather than hoping.
- Liquidity note: the $82 puts traded 3¢ wide, the $79 puts 6¢, the $97 calls 4¢ and the $100 calls 2¢ — all four legs are quoted tightly, but a four-leg fill will still cost you something versus these mids.
- Analyze this position →
If you lean bearish: Sept 18 $88/$84 put debit spread
- Trade: Buy the Sept 18 $88 put, sell the Sept 18 $84 put. You pay a debit and profit if CRWV finishes below $86.50.
- Debit: $1.50 ($150 per spread) · Max profit: $250 · Max loss: $150 · Break-even: $86.50
- Why it fits: this is the structure that expresses the 4-day chart model's $87.00 target, and cheap implied volatility means you're not overpaying for the optionality. The short $84 strike keeps the cost down while still covering the model's projected floor at $85.00.
- Makes sense only if: $90 gives way early — the week's heaviest put open interest sits right there, and until it breaks, hedging flows work against this position.
- Invalidated if: CRWV closes back above $90.50 (the chart model's own invalidation level).
- Managing it: take profits into any test of $86–$87 rather than waiting for the full $250; the short-term trend is up even though the two-month trend is down, so a fast move down in this name has a history of being bought back just as fast.
- Liquidity note: the $88 puts traded about 14¢ wide (roughly 5% of mid) — wide enough to matter on a $1.50 spread, so work the order and don't pay the ask. The $84 puts were 4¢ wide.
- Analyze this position →
If none of these: no trade
There is a defensible case for sitting this one out. The options market is pricing a ±9.33% move over four sessions — that is an enormous band, and it exists because CRWV has been gapping 2% to 5% at the open repeatedly over the past two weeks. Cheap implied volatility is only an edge if the stock moves in your direction before it moves against you, and a four-day window gives you very little room to be early. Meanwhile the premium-selling side is unattractive on its own terms: the volatility risk premium is negative, so option sellers have recently been collecting less than the stock's actual movement cost them. When neither buying nor selling premium is being generously compensated, and the short-term and two-month trends point opposite ways, waiting for a clean break of $90 or $85 is a perfectly good trade.
6 · Quick FAQ
What is CRWV's expected move this week? ±$8.30, or ±9.33%, into the September 18 expiration — a range of roughly $80.69 to $97.29 around the $88.99 close, per the options market's straddle pricing as of September 11.
Is CRWV expected to go up or down over the next four days? Options positioning as of September 11 leans slightly bullish — short-dated sentiment is strongly call-tilted, call open interest is building faster than puts, and 25-delta skew is unusually flat — but that is a read of what traders have done, not a forecast. The actionable map is the $80.69–$97.29 range and the $90.00 / $110.00 levels, with max pain at $91.00 in between.
Are CRWV options expensive right now? No. An IV rank of 5.58/100 says option prices are lower than about 94% of the past year's readings, and on top of that they're running roughly 4.6 vol points below the movement CRWV has actually delivered — thinner than about 61% of this stock's own recent readings. That combination argues for owning premium rather than collecting it.
Where is CRWV's biggest options support and resistance? For the September 18 expiration, the put wall is $90.00 (13,021 contracts) and the call wall is $110.00 (62,249 contracts). The whole chain's heaviest put strike is much lower at $60, but that is long-dated protection, not this week's battleground.
What invalidates this week's read? A close below $85.00.
Methodology & disclosures. Data: end-of-day options-chain snapshot for CRWV, 2026-09-11, generated 2026-09-14T04:01:30.687Z. Prices shown are midpoints and will differ from live markets. Momentum/positioning scores and volatility-premium comparisons are descriptive measurements of past option flow and past price movement — not investment advice, signals, forecasts, or guarantees. All trade structures are hypothetical. Every structure shown has a defined maximum loss; you can lose the entire max-loss amount. Options involve substantial risk and are not suitable for all investors.