CRWV Options Are Pricing a ±$7.74 Move Into September 25 — And the $85 Call Wall Says That's Optimistic
The options market implies a $73.62–$89.10 range for CoreWeave into the September 25 expiration, but the week's own call wall sits at $85 and max pain at $84. Here's what the positioning actually shows — and three defined-risk ways to trade it.
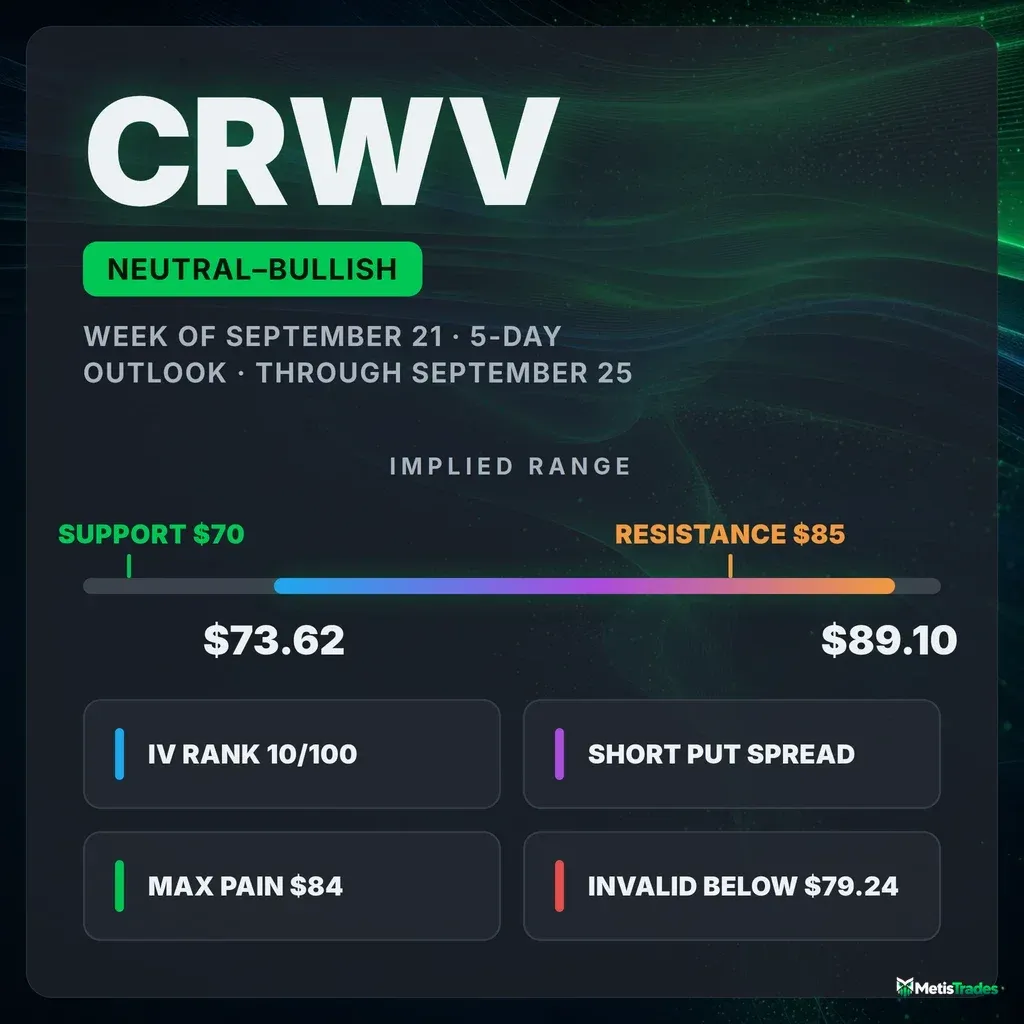
The options market implies a $73.62–$89.10 range into the September 25 expiration; here's what's driving it and three defined-risk ways to trade it.
Published Sunday, September 20, 2026 · Data as of Friday, September 18, 2026 close
Explore the live CRWV options data in the Detailed Options Analyzer →
Quick answer
| Item | Answer |
|---|---|
| Market bias | Neutral with a bullish tilt |
| Spot (Friday, September 18 close) | $81.36 |
| Options-implied range (into September 25) | $73.62 – $89.10 (±9.51%, about ±$7.74) |
| Major support | $70.00 (September 25 put wall); nearest structural support $79.24 |
| Major resistance | $85.00 (September 25 call wall) |
| Max pain (September 25) | $84.00 |
| Dealer gamma regime (estimate) | Negative — hedging tends to amplify moves; no flip-level estimate available today |
| Volatility condition | Falling over the month, flat over the past five sessions — IV rank 9.8/100, ATM IV 73.75% · premium rich: options priced about 5 vol points above delivered movement |
| Technical check | Mixed (bearish 3-day target $80.10; bullish 5-day target $83.00) |
| Best-fitting strategy | Short put spread (September 25 $76/$70) |
| Analysis invalidated if | CRWV closes below $79.24 |
1 · What matters today
CoreWeave closed Friday, September 18 at $81.36 after an 8.6% slide over five sessions, and the options market is bracing for more of the same: roughly $7.74 up or down into the September 25 expiration, a $73.62–$89.10 band. That number is the move the options market is pricing in, derived from what straddles cost.
The interesting part is the split. Price trend is down across every lookback we measure, yet new option flow is leaning the other way: calls are richer than puts, call open interest is building fast, and sentiment in short-dated contracts reads bullish. That combination earns a neutral read with a bullish tilt — not a call for a rally, a description of where positioning sits.
The level that matters is $85.00, the strike with the heaviest call open interest for September 25. The level that kills the idea is $79.24. Our technical models disagree with each other over three days versus five, which is itself a signal about how uncommitted this tape is.
2 · What the options market is pricing
What changed this week
Price did the heavy lifting: CRWV fell 8.57% over the trailing five sessions and 9.36% over twenty. Implied volatility — the market's estimate of how much CRWV will move, baked into option prices — barely flinched, rising 3.17% over five days and finishing the session down 3.13%. Over thirty days it is down 28.8%. In other words, the stock fell hard and options got no more expensive for it.
Underneath, standing hedges and new flow are pulling in opposite directions. The put/call open-interest ratio — how many put contracts are held open for every call — went from 0.92 to 1.06 over five days, so there are now 1.06 puts open for every call, against a 14-day average of 1.02. Puts have been quietly building. But Friday's new positioning was the reverse: call open interest grew by roughly 97,500 contracts versus 38,100 for puts. Traded volume tells the same story — the put/call volume ratio was 0.58 against a 7-day average of 0.68 and a 14-day average of 0.71, meaning call activity dominated by more than its recent norm. Total option volume ran 1.56× its 20-day average; share volume ran 2.56× its 20-day average.
The single biggest open-interest change in a live contract was the October 16 $85 call, up 15,386 contracts to 19,265. The week's own contract mirrored it: the September 25 $85 call added 8,592 contracts of open interest on 19,452 lots traded — $3.39 million of premium, the largest dollar figure anywhere in the chain. Traders spent Friday building the very ceiling we're about to talk about.
One honest caveat on the tape: our short-, medium- and long-term trend reads all point the same direction, and that direction is down — price is off 8.6% over the past week, 9.4% over the past month and 9.3% over the past ten weeks. The flow lean described above is running against an intact downtrend, and a momentum crossover to the bearish side registered on September 17 before Friday's flow turned back up. That argues for short-dated structures and early profit-taking rather than patient directional bets.
Expected move
Into the September 25 expiration, the chain prices a 1-standard-deviation move of ±9.51%, or about ±$7.74 — a $73.62 to $89.10 band around Friday's $81.36 close. Here is the ladder:
| Expiration | Implied move | Range around $81.36 |
|---|---|---|
| September 25 | ±9.51% | $73.62 – $89.10 |
| October 2 | ±14.08% | $69.90 – $92.82 |
| October 16 | ±20.47% | $64.71 – $98.01 |
The rungs step up smoothly with time rather than jumping at any single date — there is no calendar hump in this ladder, just the square-root-of-time scaling you'd expect when implied volatility is roughly flat across expirations.
Volatility
At-the-money implied volatility sits at 73.75% with an IV rank of 9.8/100 — meaning today's IV is cheaper than roughly 90% of the past year's readings — and an IV percentile of 2.4. Current IV is below both its 30-day average (78.1%) and its 90-day average (89.1%). Friday was an expiration day for the front contract, so the front-month read and the term-structure comparison are unavailable today; that is an expiry-day artifact, not missing data.
Two readings stand out against this stock's own recent history. Realized volatility over the past twenty days is 68.8% annualized — which sounds enormous, and for CRWV is unusually low, well below its own recent norm. Meanwhile the pace of new call open interest is running unusually heavy for this name, one of the most stretched positioning readings in the file.
Premium: rich, but only against a quiet stock. The volatility risk premium — the gap between how much movement options are priced for and how much CRWV has actually delivered — sits at about +5 vol points (73.75% implied versus 68.8% delivered over twenty days). When that gap is positive, option sellers have been collecting more than realized movement cost them. Today's reading is richer than about 69% of this stock's own recent readings. It got there fast: the gap was roughly 24 vol points negative at the end of August, crossed to positive around September 10, and has held there since — the mechanical result of the early-September whipsaw rolling out of the 20-day realized window while implied volatility barely moved. So the two lenses disagree, and both are true: options are cheap versus their own past year (IV rank 9.8) but modestly rich versus what the stock has actually been delivering. That combination favors collecting premium in defined-risk form rather than buying it outright — but the edge is a few vol points, not a windfall, so it argues for spreads over naked exposure and for modest size.
Skew and sentiment
Skew measures whether puts and calls the same distance from the stock price cost the same. Here they don't — and not in the usual direction. The 25-delta put trades at 72.8% implied volatility while the 25-delta call trades at 78.2%, so calls cost about 5.3 vol points more than equidistant puts, against a 60-day norm of 0.9 points. Traders are paying up for upside, not crash protection, and they're doing so about 4.4 points more aggressively than this stock's own recent baseline. That reading is stretched versus its own history.
Sentiment in short-dated options reinforces it. Our read of the 0–7 day bucket scores +43 and the 7–30 day bucket +62 (a 7-day average of +26 and +22 respectively), with the overall regime reading broadly bullish — every expiration bucket leans the same way. The 7–30 day bucket is the strongest: call-side flow dominated, call open interest grew about 8% net of matched contracts, and 25-delta risk reversals ran about 6 points more call-favorable than their baseline.
Set against that, the standing book is still put-heavy (1.06 puts open per call) and price momentum is negative. The honest summary: hedges are in place from earlier in the slide; new money is chasing upside.
The key levels map
| Level | Price | Why it matters |
|---|---|---|
| 52-week high | $153.20 | 46.9% overhead — context only |
| Whole-chain heaviest call strike | $110.00 | 97,020 calls open across all expirations, concentrated in later months — not this week's ceiling |
| 200-day moving average | $92.08 | Price sits 11.6% below it; long-term structure is broken |
| Top of implied range (Sep 25) | $89.10 | Upper edge of the 1σ band the chain is pricing |
| 20-day moving average | $86.21 | Price 5.6% below; first trend-repair marker |
| Swing resistance / 50-day MA | $85.37 / $85.07 | Cluster of price-structure resistance right at the call wall |
| Call wall (September 25) | $85.00 | 9,200 calls open — the week's heaviest call strike, and the single largest gamma·OI strike in the whole chain |
| Max pain (September 25) | $84.00 | The price where the most option value would expire worthless; expirations sometimes gravitate toward it |
| Swing resistance | $83.23 | Nearest overhead pivot from recent price structure |
| Spot | $81.36 | Friday, September 18 close |
| Second-largest gamma strike | $80.00 | 35,275 calls and 45,010 puts open across the chain — a heavy magnet just below spot |
| Swing support | $79.24 | The thesis-invalidation level |
| Bottom of implied range (Sep 25) | $73.62 | Lower edge of the 1σ band |
| Put wall (September 25) | $70.00 | 13,662 puts open — also the whole-chain put wall (94,364 contracts) and the third-largest gamma strike |
| Swing support | $68.51 | Next structural shelf below the put wall |
| 52-week low | $60.55 | Price sits 34.4% above it |
Note the disagreement worth flagging: the whole chain's heaviest call strike is $110.00, but that open interest lives mostly in later expirations. For the week that matters, the September 25 expiration's own call wall is $85.00. The put wall agrees at both scopes — $70.00.
Positioning and unusual flow
One rough estimate of dealer positioning puts the September 25 expiration in a negative gamma regime: market makers hedge the options they've sold, and in this regime their hedging tends to amplify moves rather than cushion them. The all-expiration aggregate agrees. This is an estimate built on an assumed dealer sign convention, not observed inventory, and no gamma-flip price estimate could be computed today — so treat it as a note about fragility, not a tripwire.
Three live flows worth naming:
- September 25 $85 calls — 19,452 contracts traded against 9,200 open, $3.39 million of premium, mid $1.745. Volume more than double open interest means this is fresh positioning, and it is what built the week's call wall.
- October 16 $85 calls — open interest up 15,386 to 19,265 on 3,479 lots, $1.82 million of premium. The same strike, a month further out: someone is treating $85 as the level to own, not to fear.
- September 25 $70 puts — open interest up 3,286 to 13,662 on 1,797 lots at a $0.205 mid. Cheap tail protection, and the reason the week's put wall sits where it does.
A separate curiosity: the September 25 $100 calls appeared from nothing with 3,285 contracts of open interest and 1,485 traded at $0.145. That's a lottery ticket roughly 23% above spot, and it is consistent with the call-tilted skew described above rather than with any serious expectation.
3 · Technical check
The two chart models we ran disagree, which is exactly the tension this article is about. The 3-day model targets $80.10 with a projected band of $78.10–$82.90 and a bearish overall bias: price below the 34-period EMA, the 50-day and the 200-day averages, with the directional-movement reading (ADX 28.7, with the negative line above the positive line) confirming a still-intact downtrend and money-flow still in distribution at −0.073. Against our neutral-with-a-bullish-tilt options read, that diverges over the interim checkpoint on September 23 — though its target sits comfortably inside the options-implied band.
The 5-day model, run to September 25, targets $83.00 with a projected band of $77.50–$84.90 and a bullish bias, citing a compressing MACD histogram, RSI recovering off the low-30s, and a rolling-over ADX with the directional-line gap narrowing sharply. That direction matches the options lean and its target sits inside the implied range, so it confirms. Both models reference the same resistance shelf — the 34-period EMA near $82.50, then the 50-day average and upper Bollinger band at $84.54–$85.07, which is the call wall again from a completely different direction.
Model vs. Market: The options market implies $73.62–$89.10 into September 25; the 5-day technical model targets $83.00 inside a $77.50–$84.90 band. The chart model is pricing a far tighter outcome than the chain is — which is the same conclusion the volatility-premium read reaches from the other side, and it is why the range-bound structure below is built with short strikes inside the implied rails rather than outside them.
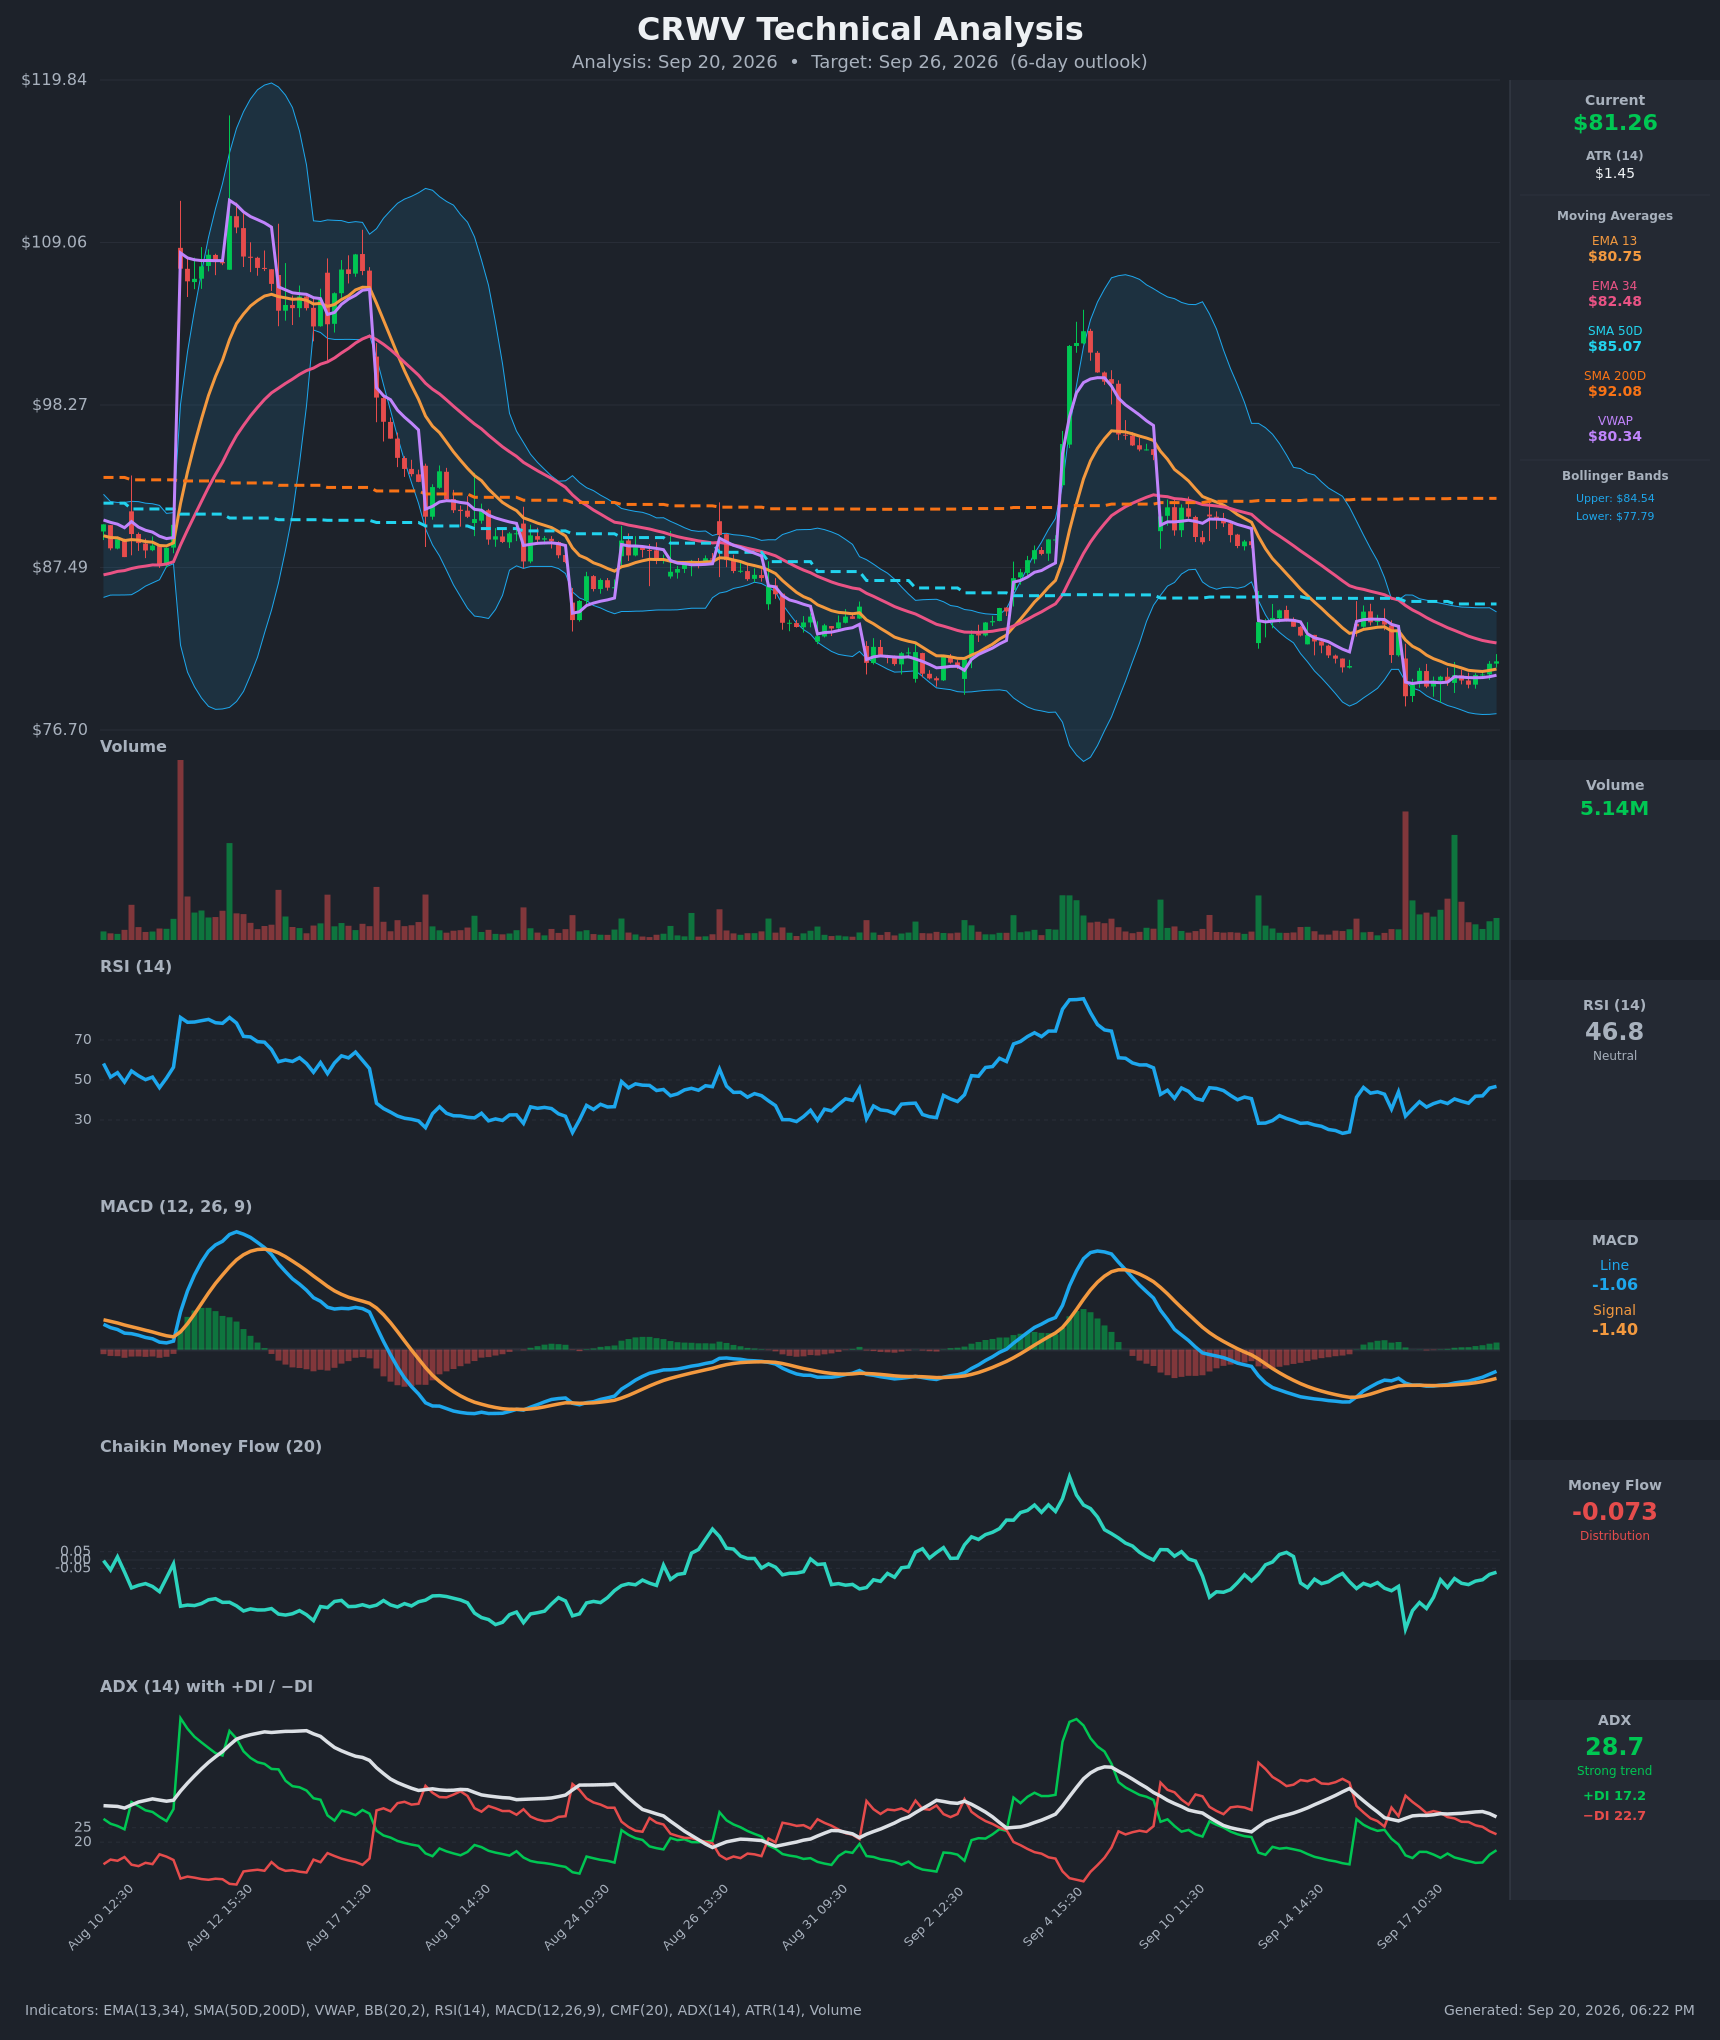
Full technical write-ups: 3-day report → · 5-day report →
Net effect on strike selection: both models flag $79.50–$78.00 as the floor they'd defend and $82.50–$85.00 as the ceiling they'd fight. That pushed our short put strikes to $75–$76 (below both floors) and the short call to $87 (above both ceilings).
4 · Three ways the next five days can go
If CRWV pushes above the call wall ($85.00): That strike carries the heaviest call open interest for September 25 and the largest gamma concentration in the chain, and it sits on top of the 50-day average at $85.07 and a swing shelf at $85.37. Heavy call open interest overhead tends to slow rallies as dealers hedge into them. A clean break through leaves comparatively thin positioning until the 20-day average at $86.21 and then the top of the implied band at $89.10.
If CRWV drifts between the walls: This is the base case the positioning describes. Max pain for September 25 is $84.00 — the strike where the most option value would expire worthless — and expiring open interest plus hedging flow sometimes pull price toward it into the final sessions. With $80.00 acting as a heavy gamma magnet just underneath and $84.00 pulling from above, a $80–$85 chop into expiration would surprise nobody.
If CRWV breaks below the put wall ($70.00): That requires a 14% slide in five sessions, well outside the implied band, but the fragility is real: the estimated dealer gamma regime for this expiration is negative, so hedging in that scenario tends to accelerate selling rather than cushion it. Watch $79.24 first — the swing support that invalidates this article's read — then the bottom of the implied range at $73.62, then $68.51 below the wall.
5 · Three defined-risk structures
Prices are end-of-day midpoints as of Friday, September 18. All structures are hypothetical. Verify live prices before trading — these will be stale by the open.
If you lean bullish: September 25 $76/$70 put credit spread
- Trade: Sell the September 25 $76 put, buy the September 25 $70 put. You collect a credit up front and keep it if CRWV stays above $76 at expiration.
- Credit: $0.79 · Max profit: $79 per spread · Max loss: $521 · Break-even: $75.21
- Why it fits: The short strike sits 6.6% below spot and below both technical models' defended floors; the long leg is the put wall itself, the single most crowded put strike for this expiration. The short $76 put carries a −0.21 delta, and you are selling premium that is running about 5 vol points above what CRWV has actually delivered.
- Makes sense only if: you accept the call-tilted skew and bullish short-dated flow as a genuine floor signal, and you're comfortable that the price trend is still pointing the other way.
- Invalidated if: CRWV closes below $79.24.
- Managing it: close at roughly 50% of max credit; with the short-term flow fighting a downtrend that is intact on every lookback, take profits early rather than holding for the last few cents. Exit regardless by September 24. If CRWV closes through $76, close rather than hope.
- Liquidity note: the $76 puts quoted 4¢ wide (about 4% of mid) and the $70 puts 1¢ wide (about 5% of a $0.205 mid) — both fill easily.
- Analyze this position →
If you expect the range to hold: September 25 $70/$75/$87/$92 iron condor
- Trade: Sell the $75 put and buy the $70 put; sell the $87 call and buy the $92 call, all September 25. You collect one credit for two spreads and keep it if CRWV finishes between $75 and $87.
- Credit: $1.32 · Max profit: $132 · Max loss: $368 · Break-evens: $73.69 and $88.32
- Why it fits: Both break-evens sit just inside the $73.62–$89.10 implied band, so this is a direct bet that the realized move comes in smaller than the chain is pricing — the same conclusion the 5-day chart model reaches with its far tighter $77.50–$84.90 projection. The short call at $87 sits above both the $85.00 call wall and the $85.07 fifty-day average; the short put at $75 sits below both models' floors and above the put wall.
- Makes sense only if: you believe the modest volatility premium is real and that neither wall gives way inside five sessions.
- Invalidated if: CRWV closes above $85.00 or below $73.62.
- Managing it: close at roughly 50% of max credit; in a negative-gamma estimate regime a breach of either short strike tends to keep going, so close the tested side rather than rolling into it. Exit regardless by September 24.
- Liquidity note: the $75 puts traded 4¢ wide, the $70 puts 1¢, the $87 calls 7¢ (about 5.6% of mid) and the $92 calls 3¢ (about 5.8%) — acceptable, but work the mid on the call side rather than paying the offer on all four legs.
- Analyze this position →
If you lean bearish: September 25 $80/$75 put debit spread
- Trade: Buy the September 25 $80 put, sell the September 25 $75 put. You pay a debit up front and profit as CRWV falls toward $75.
- Debit: $1.66 · Max profit: $334 · Max loss: $166 · Break-even: $78.35
- Why it fits: This is the trade for readers who weight the trend read over the flow read — and that read is not weak: price is down across the 5-, 20- and 50-day lookbacks, the 3-day chart model targets $80.10 with a bearish bias, and money flow is still in distribution. The long strike sits at the $80.00 gamma cluster; the short strike sits just above the implied-range floor.
- Makes sense only if: you read the call-heavy flow as complacency rather than conviction, and you want a position that gets paid if the downtrend simply continues at its current pace.
- Invalidated if: CRWV closes above $85.00.
- Managing it: this is a long-premium trade against a five-day clock, so time is the enemy — take profits at roughly 60–70% of max value rather than waiting for expiration, and reassess at the September 23 checkpoint. Exit regardless by September 24.
- Liquidity note: the $80 puts quoted 17¢ wide on a $2.435 mid — about 7%, wider than we like. Work the limit and expect some slippage; the $75 puts traded 4¢ wide.
- Analyze this position →
If none of these: no trade
There's a defensible case for standing aside. The premium edge here is thin in absolute terms — about 5 vol points over delivered movement, at the 69th percentile of this stock's own recent readings, which is good but not the kind of fat, obvious richness that makes short-premium trades forgiving. Layer on an estimated negative dealer-gamma regime (hedging that amplifies rather than dampens), a ±9.51% implied move over five sessions, and a stock that gapped more than 2% on five of the last eight sessions, and the realistic outcome for a small credit spread is that you collect $79 and sit through a 7% two-day swing to get it. If a ±$7.74 week isn't something you'd sleep through, the right position size is zero.
6 · Quick FAQ
What is CRWV's expected move this week? About ±$7.74, or ±9.51%, into the September 25 expiration — a $73.62 to $89.10 range around the $81.36 close, per the options market's straddle pricing as of Friday, September 18.
Is CRWV expected to go up or down over the next five days? Options positioning as of September 18 leans mildly bullish — calls cost about 5.3 vol points more than equidistant puts, short-dated sentiment reads broadly bullish, and new call open interest is building fast — but that's a read of what traders have done, not a forecast. Price trend is still down on every lookback we measure. The actionable map is the $73.62–$89.10 range and the $70.00/$85.00 levels.
Are CRWV options expensive right now? Two lenses, two answers. IV rank of 9.8/100 says option prices are lower than about 90% of the past year's readings. But they're also running roughly 5 vol points above the movement CRWV has actually delivered over the past twenty days — richer than about 69% of this stock's own recent readings. So: cheap versus its own history, modestly rich versus its own recent reality. That tilts the edge toward collecting premium in defined-risk form.
Where are CRWV's biggest options support and resistance? For the September 25 expiration, the put wall is $70.00 (13,662 contracts open) and the call wall is $85.00 (9,200 contracts) — with max pain at $84.00 sitting just underneath the call wall.
What invalidates this read? A close below $79.24.
Methodology & disclosures. Data: end-of-day options-chain snapshot for CRWV, 2026-09-18, generated 2026-09-20T18:22:51Z. Prices shown are midpoints and will differ from live markets. Momentum/positioning scores and volatility-premium comparisons are descriptive measurements of past option flow and past price movement — not investment advice, signals, forecasts, or guarantees. All trade structures are hypothetical. Every structure shown has a defined maximum loss; you can lose the entire max-loss amount. Options involve substantial risk and are not suitable for all investors.