DELL Options Outlook: Will the $560 Gamma Flip Hold Into October 9?
DELL options are pricing a ±$40.78 move into the October 9 expiration, a $521.74–$603.30 range. Positioning leans slightly bullish, with heavy call buying and calls building open interest, and option premium is cheap relative to how much the stock has actually moved.
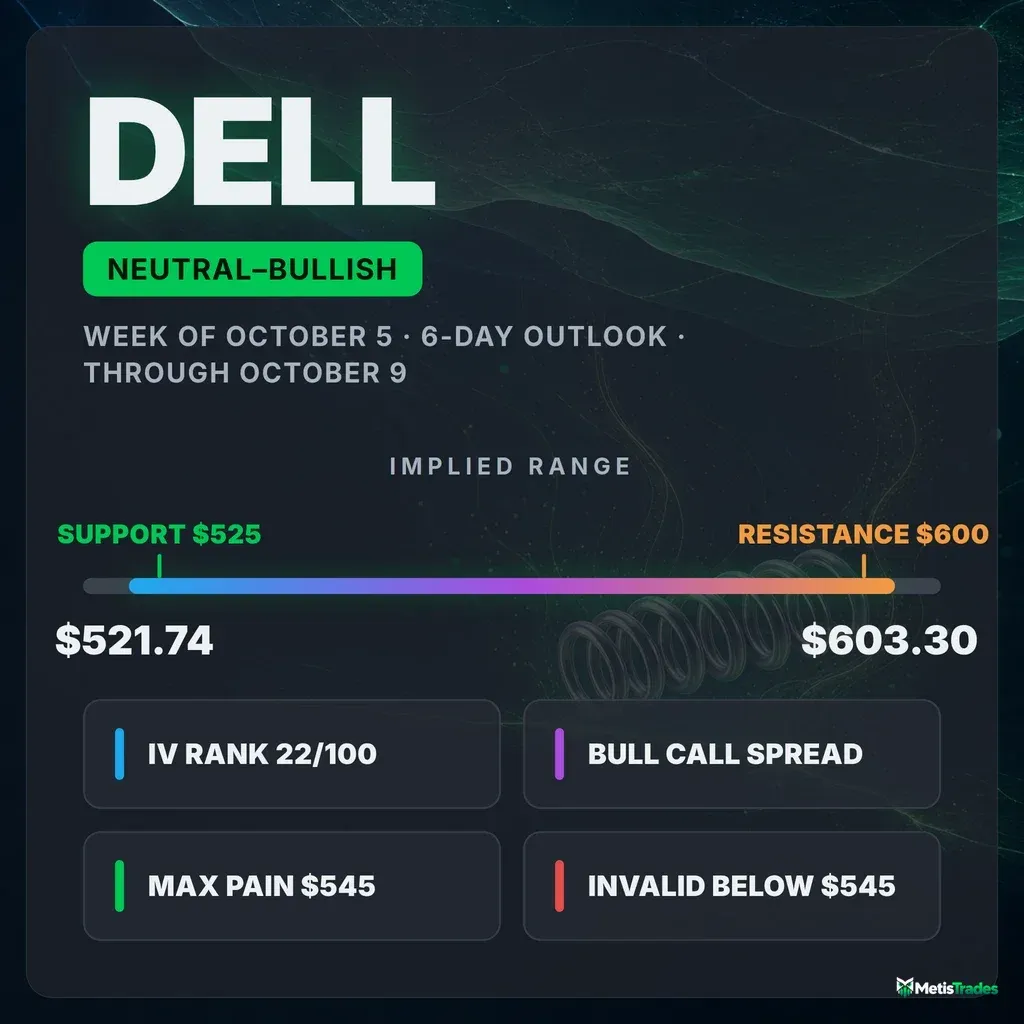
The options market implies a $521.74–$603.30 range into the October 9 expiration. Here is what's driving it, where the key levels sit, and three defined-risk ways to trade it.
Published Saturday, October 3, 2026 · Data as of Friday, October 2, 2026 close
Explore the live DELL options data in the Detailed Options Analyzer →
Quick answer
| Item | Answer |
|---|---|
| Market bias | Slightly bullish |
| Options-implied range (into October 9) | $521.74 – $603.30 (±7.25%, ±$40.78) |
| Major support | $525 (October 9 put wall) |
| Major resistance | $600 (October 9 call wall) |
| Max pain (October 9) | $545 |
| Dealer gamma regime (estimate) | Positive: hedging tends to dampen moves. Flip level ≈ $560 |
| Volatility condition | Falling. IV rank 22/100 · premium thin: options priced ~8 vol pts below delivered movement |
| Technical check | Confirms (bullish; chart model targets $568.50 by October 6 and $571.00 by October 9) |
| Best-fitting strategy | Bull call spread (October 9 $560/$580) |
| Analysis invalidated if | DELL closes below $545 |
1 · What matters today
DELL closed Friday at $562.52. Options positioning leans slightly bullish. Traders are buying calls at an unusually heavy pace for this stock, and new call contracts are piling up while put contracts are being closed.
The options market is pricing a move of about $40.78 either way by the October 9 expiration. That works out to a range of roughly $521.74 to $603.30. This is "the expected move": what straddles cost, translated into dollars.
The level that changes the picture is $545. A close below it puts DELL under its 20-day average and under the price where the most October 9 options would expire worthless. It also puts the stock well under the $560 level where market-maker hedging is estimated to flip from cushioning moves to amplifying them.
Options are also cheap right now, both against the past year and against how much the stock has actually been moving. That favors buying defined-risk structures over selling them. Both technical reports agree with the upward lean.
2 · What the options market is pricing
What changed this week
On the surface, DELL went nowhere over five sessions: the stock is down just 0.07% for the week. Underneath, it whipsawed hard:
- It closed at $536.02 on September 24.
- It rebounded to $562.89 the next day.
- It slid back to the $540s through October 1.
- Friday's session opened with a 2.31% gap up, from $541.74 to $554.25, and the stock closed at $562.52.
Our read of options flow firmed along with it. The latest reading of +17 compares with a 7-day average of +4 and a 3-day average of +12. In other words, flow turned constructive over the last three sessions after a choppy, roughly neutral week.
Puts fell out of favor at the same time:
- Volume: the put/call volume ratio, which measures how much put activity there is relative to calls (above 1 means puts dominate), printed 0.52. Its 7-day average is 0.60 and its 14-day average is 0.72.
- Open interest: the put/call ratio for open interest (contracts currently held open) dropped to 0.72, against a 7-day average of 0.87.
- Friday's change: call open interest grew by about 4,900 contracts on Friday, while put open interest shrank by about 12,100.
The biggest live open-interest build was in the October 16 $557.50 calls, which went from 105 to 814 contracts.
Implied volatility kept bleeding lower. It is down 3.1% over five sessions and down 26.6% over 30.
Into Friday's own expiration, the October 2 $555 calls added about 1,600 contracts of open interest on 3,719 contracts of volume. That expiry has now settled and is history, not a live level.
The bigger trend is not in dispute. DELL is up 8.9% over the past month and 28% over the past two and a half months, while the past week is flat. That last point matters: a fresh short-term momentum turn lower on September 23 is a reminder that the near-term tape has been choppy even inside that uptrend.
Expected move
The expected move is the move the options market is pricing in, derived from what at-the-money straddles cost. Into the October 9 expiration, that is ±$40.78, or ±7.25% of the $562.52 spot price.
| Expiration | Implied move | Range around $562.52 |
|---|---|---|
| October 9 (7 days from the data date) | ±7.25% | $521.74 – $603.30 |
| October 16 | ±10.68% | $502.44 – $622.60 |
| October 23 | ±13.22% | $488.16 – $636.89 |
| October 30 (~1 month) | ±15.80% | $473.64 – $651.40 |
The rungs widen roughly with the square root of time, with no unusual step-up between any two of them. Nothing on the calendar inside this ladder is getting a special premium.
Volatility
Implied volatility (IV) is the market's estimate of how much DELL will move, baked into option prices. At-the-money IV stands at 57.44%.
That sounds high in absolute terms, but it is low for DELL. The IV rank of 22/100 means today's IV is cheaper than 78% of the past year's range. IV is also running below its own averages:
- 30-day average: 65.2%
- 90-day average: 76.4%
- Friday's one-day change: down another 2.1%
The front-month comparison is unavailable today because Friday was an expiry day, so the usual short-dated read can't be interpolated. The individual expirations still tell the story of term structure, which compares option prices across expiration dates:
- October 9: 52.4%
- October 30: 57.0%
- December 18: 64.4%
That is an upward-sloping curve. The market is calmer about the next week than about the months beyond.
Realized movement is cooling too. DELL's 20-day realized volatility of 65.6% is well below this stock's recent norm. "Well below" here means unusual for DELL specifically, not versus the broader market. Over the last five sessions the stock has moved only about two-thirds as much as it did over the past month.
Premium rich or cheap? The volatility risk premium is the gap between how much movement options are priced for and how much DELL has actually delivered. When it is positive, option sellers have been collecting more than realized movement cost them.
Right now it is negative. Options are priced about 8 vol points below the stock's 20-day delivered movement (57.4% implied versus 65.6% realized).
On its percentile, today's gap is richer than about 46% of this stock's own recent readings. That is middling for DELL, and roughly typical of where the gap tends to sit.
The path matters. Through September 30 the gap was deeply negative, at roughly 24–29 points. It narrowed sharply on October 1 as realized movement cooled.
So what? An IV rank of 22 plus a premium that still sits below delivered movement favors owning premium through defined-risk debit spreads this week, rather than collecting it.
Skew and sentiment
Skew is the observation that puts and calls the same distance from the stock price don't cost the same. When puts are pricier, traders are paying up for crash protection.
Today, 25-delta puts carry about 0.5 vol points more IV than 25-delta calls (57.6% versus 57.1%). For DELL, the norm over the prior 60 days is calls slightly richer, by about 0.4 points. So put protection is roughly a point pricier than usual. That is a modest hedge bid, and it is the main bearish thread in the data.
Everything else points the other way:
- The call-buying pace on Friday was unusually heavy for this name.
- The one-day build of call-side open interest was well above its typical size.
- Sentiment in short-dated options leans bullish. Both the 0–7 day expirations (score +31) and the 7–30 day expirations (score +30) are tilted toward calls.
- That is firmer than their 14-day averages of +19 and +15.
- Every expiration bucket leans the same way, so the overall regime reads as "broadly bullish."
The key levels map
| Level | Price | Why it matters |
|---|---|---|
| Call wall (October 9 and whole chain) | $600 | The strike with the biggest pile of open call contracts, which often acts like a magnet or barrier. It is also the second-largest gamma strike in the chain. |
| 52-week high / swing resistance | $595.51 | DELL sits 5.54% below its yearly high. |
| Spot (Friday close) | $562.52 | Reference price for all figures. |
| Gamma flip (estimate) / large gamma strike | $560 | One rough estimate puts the flip here: below it, market-maker hedging tends to accelerate selling rather than cushion it. Spot is unusually close to it for this name. |
| Largest gamma strike | $550 | The heaviest concentration of option gamma in the chain, a likely pinning zone. |
| Friday's gap zone | $541.74 – $554.25 | An unfilled gap from Friday's open; gaps often get revisited. |
| 20-day moving average | $548.15 | The short-term trend line, 2.6% below the close. |
| Max pain (October 9) | $545 | The price where the most option value would expire worthless. Expirations sometimes gravitate toward it. |
| Large gamma strike | $540 | Another dense hedging zone, sitting inside Friday's gap. |
| Swing support | $530.45 | Late-September pivot lows. |
| Put wall (October 9) | $525 | The heaviest put open interest for this expiration, though it is thin at 412 contracts. |
| Swing support | $514 | The next pivot cluster below. |
| Put wall (whole chain) / gamma strike | $500 | The heaviest put open interest across all expirations, at 7,668 contracts. |
| 50-day moving average | $488.96 | The intermediate trend, 15% below. |
The two sets of walls only partly agree:
- Calls: the October 9 call wall and the whole chain's heaviest call strike both sit at $600.
- Puts: the October 9 put wall is $525, but the whole chain's heaviest put strike is $500.
For the next six days, $525 is the level that applies.
Positioning and unusual flow
Market makers hedge the options they've sold. One rough estimate puts dealers in a positive-gamma regime, where their hedging tends to dampen moves. This holds for the whole chain and for the October 9 expiration on its own.
The catch is that spot sits only about 0.45% above the estimated $560 flip level. A modest slip would move DELL into the zone where that cushion is estimated to disappear.
Notable live flow:
- October 9 $600 calls: 1,878 contracts traded against 830 open, roughly $831,000 in premium. Open interest grew by 129. Someone is building, or adding to, upside exposure right at the call wall.
- October 9 $560 and $570 calls: about $1.32 million and $1.17 million in premium respectively. The $560 calls added 135 contracts of open interest. This is near-the-money call demand for this exact expiration.
- December 18 $580 puts and calls: 371 puts (about $2.74 million) and 403 calls (about $2.44 million) traded at similar size, both well above existing open interest. Matching size on both sides looks more like a volatility position than a directional bet.
3 · Technical check
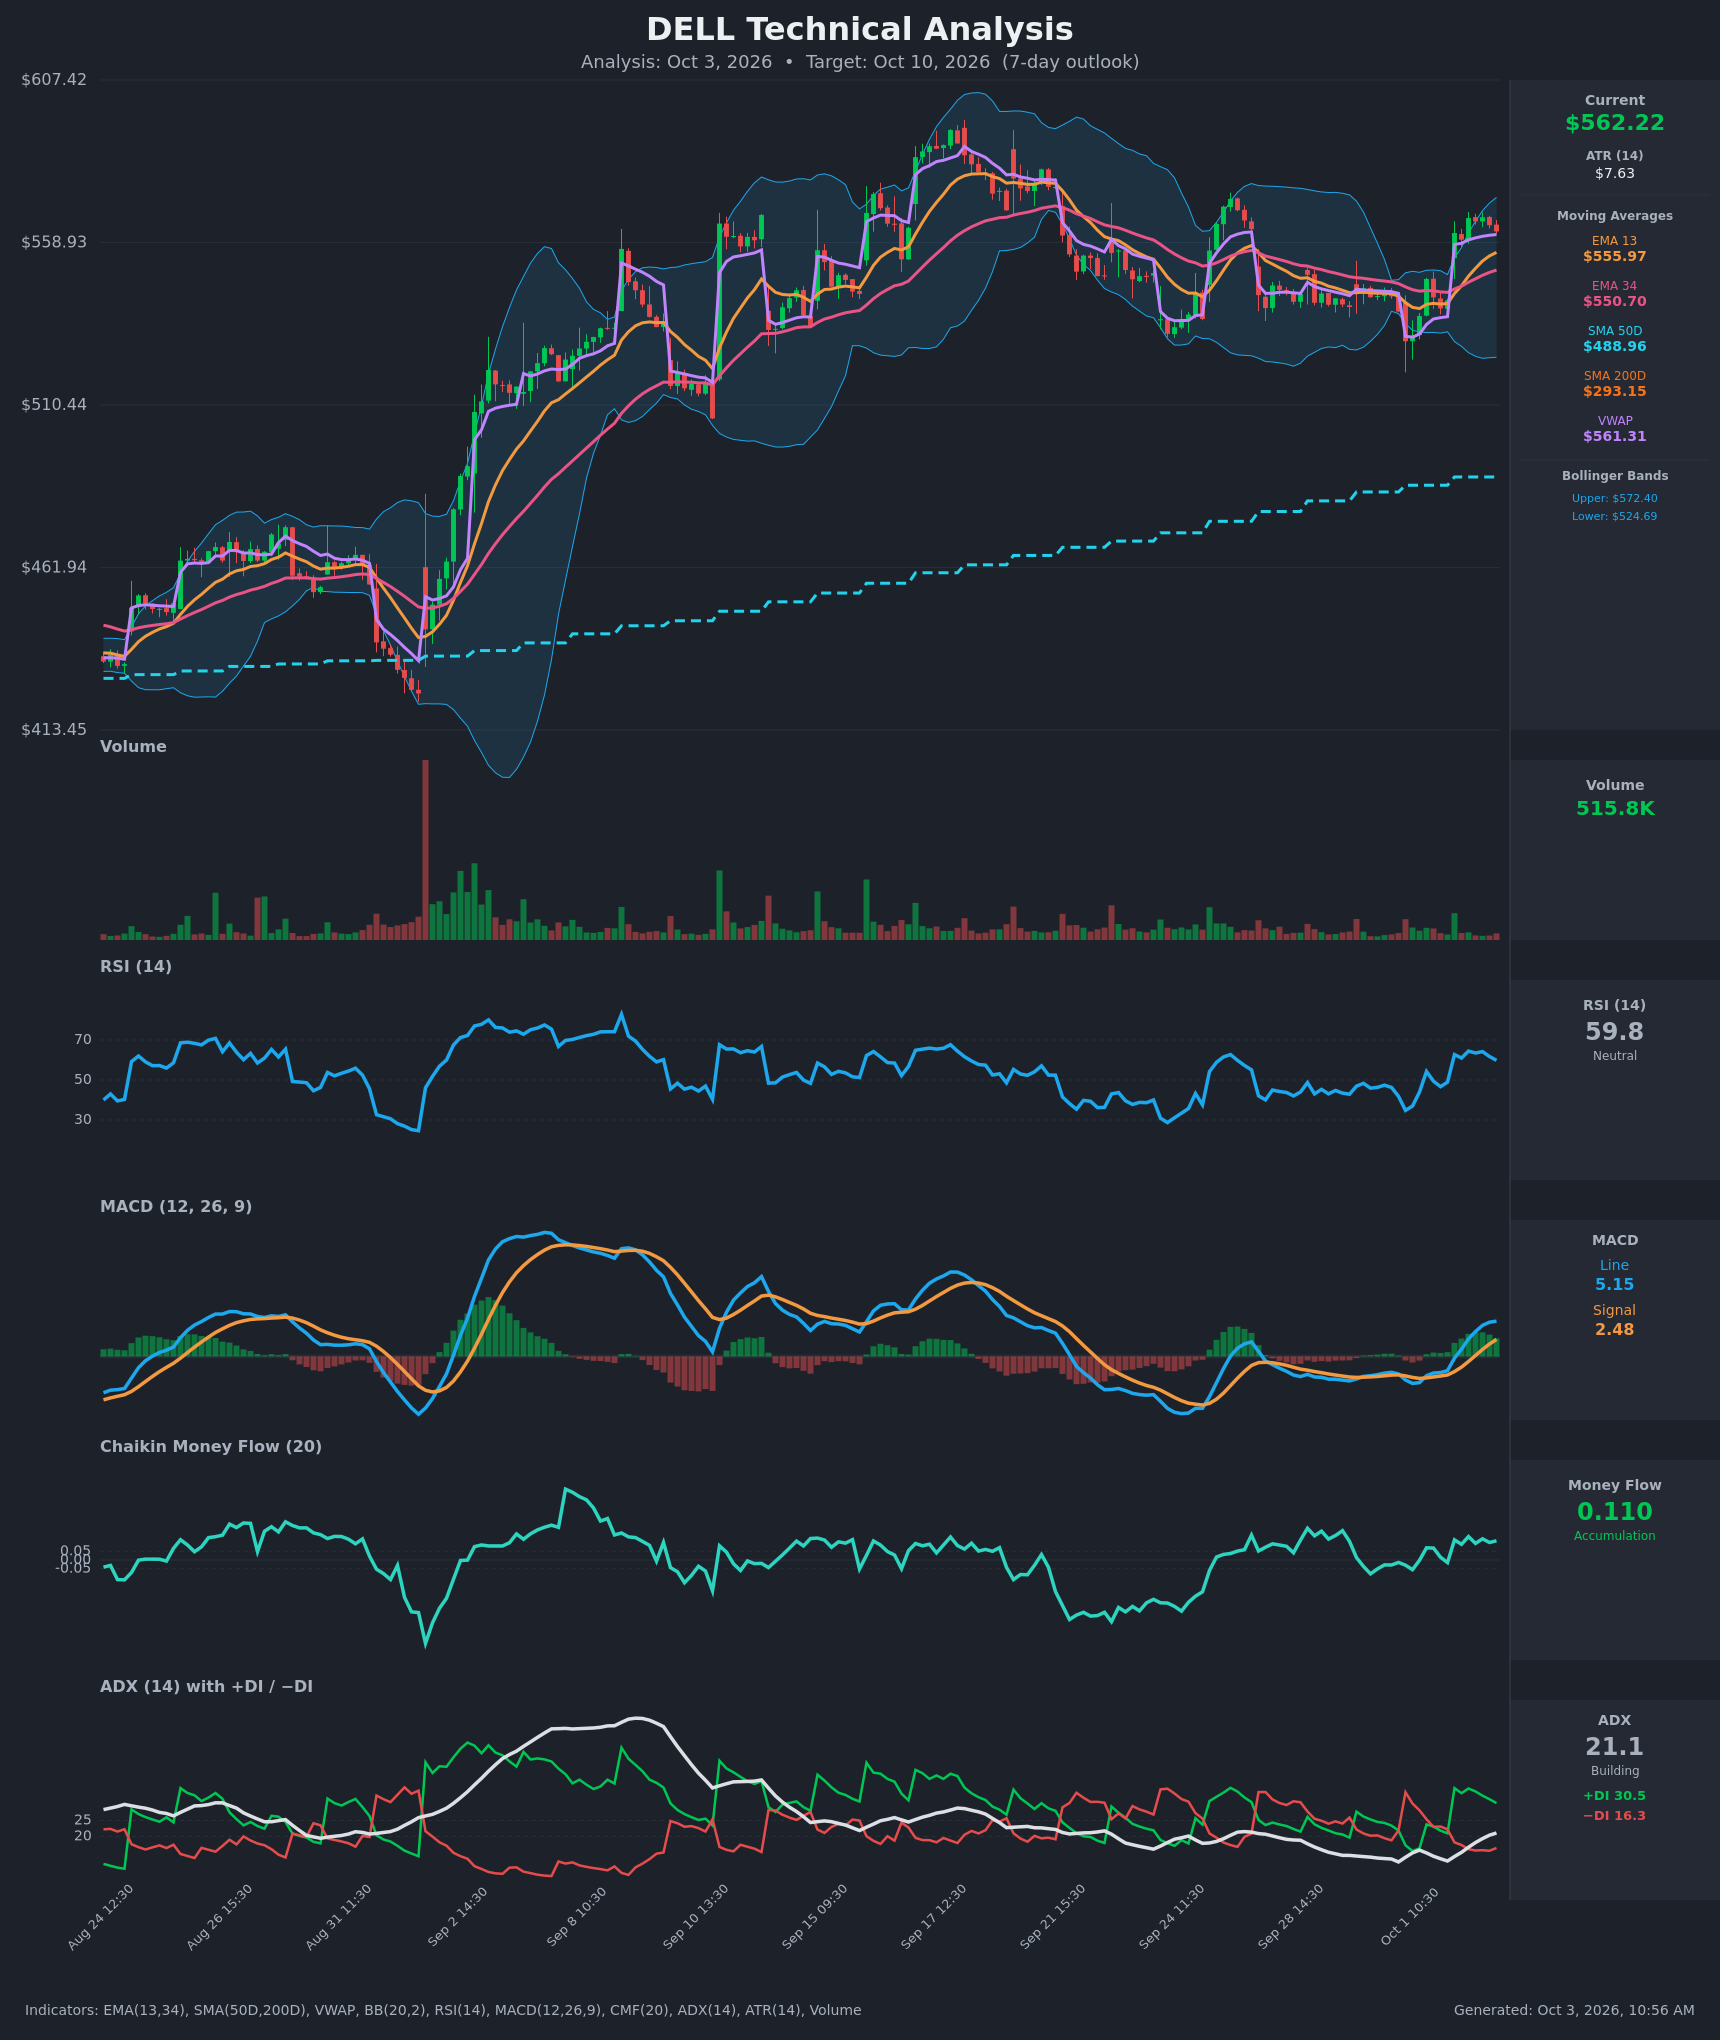
Both chart-model reports lean bullish, and both confirm the options read.
The near-term report targets $568.50 by October 6, with a projected range of $543.00–$580.00. The report covering the full window targets $571.00 by October 9, with a projected range of $546.00–$583.00.
Both targets sit comfortably inside the options-implied $521.74–$603.30 band. The most decisive technical reads are:
- A fresh bullish crossover on Friday, both of the fast moving average over the slower one and of MACD.
- Steady money-flow accumulation.
The trend-strength gauge is still below the level that marks a strong trend, so the advance looks gradual rather than explosive. The models' key levels are support near $550.70–$551 and resistance at the $572.40 upper Bollinger band. Their dominant scenario is invalidated by a close below $550 (near-term) or $551 (full window).
Model vs. Market: The options market implies $521.74–$603.30 into October 9. The 6-day technical model targets $571.00 (range $546.00–$583.00). The model sees a gentle grind higher with roughly half the movement options are paying for. If DELL stays inside the model's narrower band, cheap long premium may decay before it pays.
The technical target near $571–$583 shaped the bullish structure below: its short strike sits at $580, the top of the model's range, instead of at the more distant $600 call wall.
Full technical write-ups: Near-term (October 6) report → · October 9 report →
4 · Three ways the week can go
If DELL pushes above the call wall ($600): The heaviest call open interest overhead tends to slow rallies as hedgers sell into strength. The 52-week high at $595.51 sits just below it as a second speed bump.
A clean break above $600 would leave thinner positioning above. The next notable whole-chain call concentration is $610. That would be a move to the top edge of what options are pricing for October 9.
If DELL drifts between the walls: This is the base case for a positive-gamma regime, where hedging flows tend to absorb moves instead of chasing them. The gamma strikes at $560 and $550 act as sticky zones.
October 9 max pain at $545 sits below spot. Into expiration, expiring open interest can exert a mild pull toward the $545–$560 area even if the upward lean holds early in the week.
If DELL breaks below the put wall ($525): This is the acceleration case. The path down runs through the $560 gamma flip estimate first. Below it, one rough estimate suggests market-maker hedging amplifies selling rather than cushioning it.
Friday's unfilled gap ($541.74–$554.25) and max pain at $545 would likely be tested on the way. Losing $525 would expose the swing supports at $514 and the whole chain's $500 put wall.
5 · Three defined-risk structures
Prices are end-of-day midpoints as of October 2, 2026. All structures are hypothetical. Verify live prices before trading; these will be stale by the open.
If you lean bullish: October 9 $560/$580 bull call spread
A debit spread means you pay up front, and you profit if DELL finishes above your break-even. Both your cost and your gain are capped.
- Trade: Buy the October 9 $560 call ($17.625 mid), sell the October 9 $580 call ($9.425 mid).
- Debit: $8.20 ($820 per spread) · Max profit: $11.80 ($1,180) · Max loss: $8.20 ($820) · Break-even: $568.20
- Why it fits: Several reads line up behind it:
- Positioning leans slightly bullish.
- Call buying is unusually heavy for DELL.
- IV rank is 22, and options are priced about 8 points below delivered movement, so buying premium is the cheaper side of the trade.
- The $580 short strike sits at the top of the technical model's range.
- Makes sense only if: DELL holds above the $560 flip estimate early in the week and the gap from Friday doesn't get filled.
- Invalidated if: DELL closes below $545.
- Managing it:
- Take profits at roughly 50–60% of max profit.
- The short-term trend is flat even though the longer trend is up, so don't wait for a perfect finish. Reassess at the October 6 checkpoint.
- Exit regardless by the October 8 close to avoid expiration-day pinning toward $545–$560.
- Liquidity note: The $560 calls traded 75¢ wide (about 4% of mid), so that leg is easy to fill. The $580 calls traded 95¢ wide (about 10% of mid), so work a limit order near the midpoint rather than hitting the bid.
- Analyze this position →
If you expect the range to hold: October 9 $525/$537.50/$587.50/$600 iron condor
An iron condor sells a put spread and a call spread together. You collect a credit and keep it if DELL stays between the short strikes.
- Trade: Sell the October 9 $537.50 put ($6.375), buy the $525 put ($3.60), sell the $587.50 call ($7.075), buy the $600 call ($4.425).
- Credit: $5.425 ($542.50) · Max profit: $542.50 · Max loss: $7.075 ($707.50) · Break-evens: $532.075 and $592.925
- Why it fits: The long strikes sit at the two October 9 walls ($525 and $600), and the regime is estimated as positive gamma, where hedging tends to dampen moves. Health warning: you're selling premium that hasn't been rich lately. Options are priced below what DELL has actually delivered, so this structure is the weakest fit of the three.
- Makes sense only if: Realized movement keeps cooling, as the past five sessions suggest, and DELL settles into the $545–$575 zone.
- Invalidated if: DELL closes below $537.50 or above $587.50.
- Managing it: Close at about 50% of the credit. If either short strike is breached on a closing basis, close the whole position rather than adjusting.
- Liquidity note: Slippage across four legs will eat into the credit. Enter as a single four-leg order near the midpoint.
- $537.50 puts: 95¢ wide (about 15% of mid)
- $525 puts: 50¢ wide
- $587.50 calls: 65¢ wide
- $600 calls: 25¢ wide
- Analyze this position →
If you lean bearish: October 9 $560/$535 bear put spread
This is the mirror-image debit spread: you pay up front and profit if DELL falls below your break-even.
- Trade: Buy the October 9 $560 put ($14.65 mid), sell the October 9 $535 put ($5.725 mid).
- Debit: $8.925 ($892.50) · Max profit: $16.075 ($1,607.50) · Max loss: $8.925 ($892.50) · Break-even: $551.075
- Why it fits: It is the contrarian case. Put skew is running about a point steeper than DELL's norm. Spot is barely above the $560 gamma flip estimate. Max pain at $545 and Friday's unfilled gap sit below. A fade back into the gap would carry this spread toward max value.
- Makes sense only if: DELL closes back below $560 early in the week, confirming the gap-up failed.
- Invalidated if: DELL closes above $570.
- Managing it: Take profits near the $545 max-pain zone. Exit by the October 8 close regardless.
- Liquidity note: The $560 puts traded $1.30 wide (about 9% of mid), and the $535 puts traded 75¢ wide (about 13%). Use limit orders.
- Analyze this position →
If none of these: no trade
Standing aside is a legitimate choice this week. The upward lean is real but mild, and the October 9 walls are thin (830 calls at $600, 412 puts at $525), so they may not hold price as firmly as heavier walls would.
The chart models expect only about half the movement options are priced for. If they're right, even cheap debit spreads can bleed value while DELL chops between $550 and $570. And with spot sitting almost exactly on the $560 gamma flip estimate, the stock could flip between a dampened and an amplified regime within a single session.
If you can't watch the position daily, or the $545–$560 pinning zone makes you uneasy, no trade beats a forced one.
6 · Quick FAQ
What is DELL's expected move this week? ±$40.78 (±7.25%) into the October 9 expiration, a range of $521.74 to $603.30. This is based on the options market's straddle pricing as of October 2, 2026.
Is DELL expected to go up or down by October 9? Options positioning as of October 2 leans slightly bullish. Call buying is heavy and call open interest is building, while put protection is being trimmed. But that's a read of what traders have done, not a forecast. The actionable map is the $521.74–$603.30 range, with $525 support and $600 resistance.
Are DELL options expensive right now? No.
- An IV rank of 22/100 says option prices are cheaper than 78% of the past year's range.
- Options are also running about 8 vol points below the movement DELL has actually delivered. That gap is richer than only about 46% of this stock's own recent readings.
Together, that argues for buying defined-risk premium rather than selling it.
Where is DELL's biggest options support and resistance? For the October 9 expiration, the put wall is at $525 and the call wall is at $600. Across all expirations, the heaviest put strike is $500.
What invalidates this week's read? A DELL close below $545.
Methodology & disclosures. Data: end-of-day options-chain snapshot for DELL, 2026-10-02, generated 2026-10-03T10:56:37.997Z. Prices shown are midpoints and will differ from live markets. Momentum/positioning scores and volatility-premium comparisons are descriptive measurements of past option flow and past price movement — not investment advice, signals, forecasts, or guarantees. All trade structures are hypothetical. Every structure shown has a defined maximum loss; you can lose the entire max-loss amount. Options involve substantial risk and are not suitable for all investors.