DELL Options Are Pricing a $48.90 Swing Into Friday — And the Whole Options Corridor Is Now Behind the Stock
After a 9.9% five-day surge to a fresh 52-week high, DELL's September 18 call and put walls both sit more than $100 below spot, leaving almost no options structure overhead. Here's the $518.39–$616.19 implied range, the levels that still matter, and three defined-risk ways to trade it.

The options market implies a $518.39–$616.19 range into the September 18 expiration; here's what's driving it and three defined-risk ways to trade it.
Published Sunday, September 13, 2026 · Data as of the 2026-09-11 close
Explore the live DELL options data in the Detailed Options Analyzer →
Quick answer
| Item | Answer |
|---|---|
| Market bias | Bullish |
| Spot (chain snapshot close) | $567.29 |
| Options-implied range (into Sep 18) | $518.39 – $616.19 (±8.62%, or ±$48.90) |
| Major support | $460 — the Sep 18 put wall (the whole chain's heaviest put strike is $500; the nearest shelf under spot is $550) |
| Major resistance | $450 — the Sep 18 call wall, now far below spot; the practical overhead level is $580, the heaviest Sep 18 call open interest above the stock |
| Max pain (Sep 18) | $450 |
| Dealer gamma regime (estimate) | Positive — hedging tends to dampen moves; flip level ≈ $340 |
| Volatility condition | Falling over the past month — IV rank 42/100 · premium thin: options priced about 23 vol points below delivered movement |
| Technical check | Confirms (bullish, 3-day and 5-day chart models) |
| Best-fitting strategy | Sep 18 $570/$590 bull call debit spread |
| Analysis invalidated if | DELL closes below $548 |
1 · What matters today
DELL closed at $567.29 after gaining 9.9% in five sessions and 33% over the past ten weeks, finishing a hair under its 52-week high of $567.75. Our read of the options flow lands firmly bullish: leading positioning, momentum, and short-dated sentiment all lean the same way, and the stock has punched clean through every strike where large option positions were built. The odd consequence is that the September 18 expiration's own call wall — the strike with the biggest pile of open call contracts, usually a ceiling — sits at $450, more than $100 below the stock. There is almost no options structure overhead. The options market is pricing a ±$48.90 move into Friday, a $518.39–$616.19 band. Both chart models agree on direction with far tighter targets near $579. The level that changes the picture is $548: a close below it breaks the short-term trend structure this whole read rests on.
2 · What the options market is pricing
What changed this week
The stock did the heavy lifting. DELL is up 9.86% over five trading days and 14.73% over twenty, gapping 2.26% higher on September 11 alone on volume 1.63× its 20-day average. Options volume ran 3.46× its own 20-day norm. The single biggest positioning shift was in open interest: call open interest rose 13,159 contracts day-over-day while put open interest fell 28,869 — for every call contract held open there are now 0.58 puts, down from a 3-day average of 0.78 and a 7-day average of 0.67. Traders closed downside protection into strength rather than adding to it. The largest live open-interest build was the October 16 $600 call, which added 736 contracts to 2,645 open on 1,423 contracts of volume — that strike alone changed hands for about $4.4 million of premium. Implied volatility — the market's estimate of how much DELL will move, baked into option prices — ticked up 3.9% on the day and 2.1% over five sessions, but it is still down 26.2% over thirty days and sits well below both its 30-day (78.6%) and 90-day (78.6%) averages. The short-, medium-, and long-horizon trend reads all point bullish and agree with each other, so there's no tension to referee here: price and positioning have been heading the same way for two months.
Expected move
Into September 18, the options market is pricing a move of ±8.62%, or ±$48.90 around the $567.29 spot — that's the move implied by what at-the-money straddles cost, and it maps to a $518.39–$616.19 range. That is an enormous weekly band for a $567 stock, and it tells you how violent this name has been.
| Expiration | Implied move | Range around $567.29 |
|---|---|---|
| Sep 18 (7 DTE) | ±8.62% | $518.39 – $616.19 |
| Sep 25 (14 DTE) | ±11.87% | $499.95 – $634.63 |
| Oct 16 (35 DTE) | ±19.26% | $458.03 – $676.55 |
The rungs scale almost exactly with the square root of time — no kink, no hump between them. That flatness matters: it says the chain is not bracing for any single dated event inside the next five weeks, just carrying a uniformly high level of expected movement.
Volatility
At-the-money implied volatility is 62.1%, with an IV rank of 42/100 — today's reading is cheaper than 58% of the past year's, and its percentile rank within the year is 57. That's a middling absolute level, and the direction of travel is down: IV is 26.2% lower than it was thirty days ago and roughly 21% below its own 30-day average. The front-month read and the 25-delta skew are both unavailable in this snapshot (the nearest expiration was a same-day expiry, which makes those two interpolations impossible), so today's term-structure line is simply not there — an expiry-day artifact, not a missing market.
Two "vs its own norm" readings stand out — meaning unusual for DELL specifically, not versus the broader market. The compression of implied volatility relative to its recent average is running well above this stock's own norm, and the pace of new call open interest is likewise unusually heavy. Realized movement is accelerating too: the 5-day realized volatility is running about 1.13× the 20-day, so the stock is moving faster now than it did across the past month.
Premium rich or cheap. The gap between how much movement options are priced for and how much DELL has actually delivered — the volatility risk premium — is deeply negative: at-the-money IV of 62.1% sits about 23 vol points below the 85.2% the stock has realized over the past twenty sessions. That reading is thinner than roughly three-quarters of this stock's own recent readings (23rd percentile). The path there is mechanical and worth naming: the premium was mildly positive through the end of August and flipped hard negative on September 2, when an 8.7% overnight gap entered the 20-day realized-volatility window. It is not a trader signal; it is arithmetic. What it does mean practically is that option sellers here have been collecting less than the stock's actual movement has cost them. IV rank 42 with a 23rd-percentile premium over delivered movement favors owning premium this week rather than collecting it — debit structures over credit structures, and short strikes placed with real respect for an 85% realized vol.
Skew and sentiment
There is no 25-delta skew reading today (the call side's 25-delta IV couldn't be interpolated), so the put-versus-call cost comparison has to come from the trailing window. Over the past seven sessions, 25-delta skew has averaged about −1.9 vol points — puts have been cheaper than equidistant calls — against a 60-day median of +0.7 vol points, where puts are normally the pricier side. Traders have not been paying up for crash protection in this name; if anything they've been paying up for upside. Volume tells a similar story with a small caveat. Put volume ran 0.91 per call contract, down from a 3-day average of 1.21 but still 24% above the 60-day median of 0.74 — so there is residual hedging in the tape even as open interest drains from the put side. Sentiment in short-dated options is the loudest input: the 0–7 day bucket reads +53 against a 7-day average of +12, while the 60–120 day bucket reads −8. Our read of the curve calls that a bullish blow-off — a leveraged, front-end chase with nothing comparable being built further out. That's a genuine bullish signal about the next few sessions and a genuine caution about durability.
The key levels map
| Level | Price | Why it matters |
|---|---|---|
| Implied range top (Sep 18) | $616.19 | Upper edge of the options-implied one-standard-deviation band |
| Call open interest, Sep 18 | $590 | 735 calls open, 1,456 traded Friday — second-heaviest strike above spot |
| Heaviest overhead call strike, Sep 18 | $580 | 1,290 calls open for Friday; 5,819 across the whole chain — the only real magnet above the stock |
| Chart-model resistance | $578.47 | Upper Bollinger Band; the 3-day model's target is $578.50 |
| 52-week high | $567.75 | Friday's close came within 8 cents of it |
| Spot / close | $567.29 | Anchor for every strike and expected-move figure here |
| Chart-model support (VWAP) | $556.72 | First technical shelf on a pullback |
| Whole-chain heaviest call strike | $550 | 8,994 calls open and the single largest gamma strike in the chain — overhead resistance that flipped into a shelf |
| Short-term moving average (EMA13) | $548 | The kill switch for this read |
| Implied range floor (Sep 18) | $518.39 | Lower edge of the one-standard-deviation band |
| Swing support | $514 | Highest of the heuristic swing-pivot clusters in the price structure |
| Whole-chain heaviest put strike | $500 | 8,378 puts open; also the max-pain strike for October 16 |
| 20-day moving average | $479.37 | Spot sits 18.3% above it — a measure of how stretched this move is |
| Put wall, Sep 18 | $460 | 3,456 puts open — the expiration's own heaviest put strike, stranded far below spot |
| Call wall + max pain, Sep 18 | $450 | 5,171 calls open; also the price where the most Sep 18 option value would expire worthless |
| Gamma flip estimate | $340 | One rough estimate of the level below which market-maker hedging would amplify selling — nowhere near live |
Note the disagreement between scopes, because it's the whole story: the September 18 expiration's own walls ($450 call, $460 put) are a fossil of a $450 stock, while the whole chain combined puts its heaviest call strike at $550 and heaviest put strike at $500. Every one of those levels is now behind the stock.
Positioning and unusual flow
One rough estimate of dealer positioning puts the chain in a positive-gamma regime, both in aggregate and for the September 18 expiration specifically — in that state, market-maker hedging tends to dampen moves rather than amplify them, and the estimated flip level sits around $340, nearly 40% below spot. Read it as a cushion, not a guarantee; it is an estimate built on an assumed dealer sign convention, not observed inventory.
Three live flow items stood out. The September 18 $570 calls traded 2,442 contracts against 673 open — 3.6× turnover, top of their peer group, and about $4.43 million of premium changing hands right at the money. The October 16 $600 calls added the largest open-interest build in the chain (+736 to 2,645) on 1,423 contracts and roughly $4.41 million of premium, which is money positioning for another 6% higher a month out. On the other side, the September 18 $500 puts traded 3,807 contracts on 1,448 open — real downside hedging, but struck nearly 12% below the market.
3 · Technical check
Both chart reports are bullish and both classify as Confirms: the direction matches the options read, and both targets sit comfortably inside the options-implied range. The 3-day model targets $578.50 with a projected band of $551.00 to $583.00 into September 16. The 5-day model targets $579.00 with a band of $549.00 to $588.00 into September 18 — the same date our options thesis is anchored to.
The supporting evidence is trend-strength, not pattern-guessing: ADX at 37.7 with +DI (37.3) dominating −DI (15.1) describes an established, still-strengthening uptrend, and MACD crossed above its signal line on September 11 with a widening histogram. The one dissent is money flow — CMF at −0.019 has stayed flat-to-negative through the entire advance, a mild divergence suggesting some distribution under the surface. The 5-day report puts a 15% weight on an outright bearish reversal and marks $531 (EMA34) as the level that would confirm one.
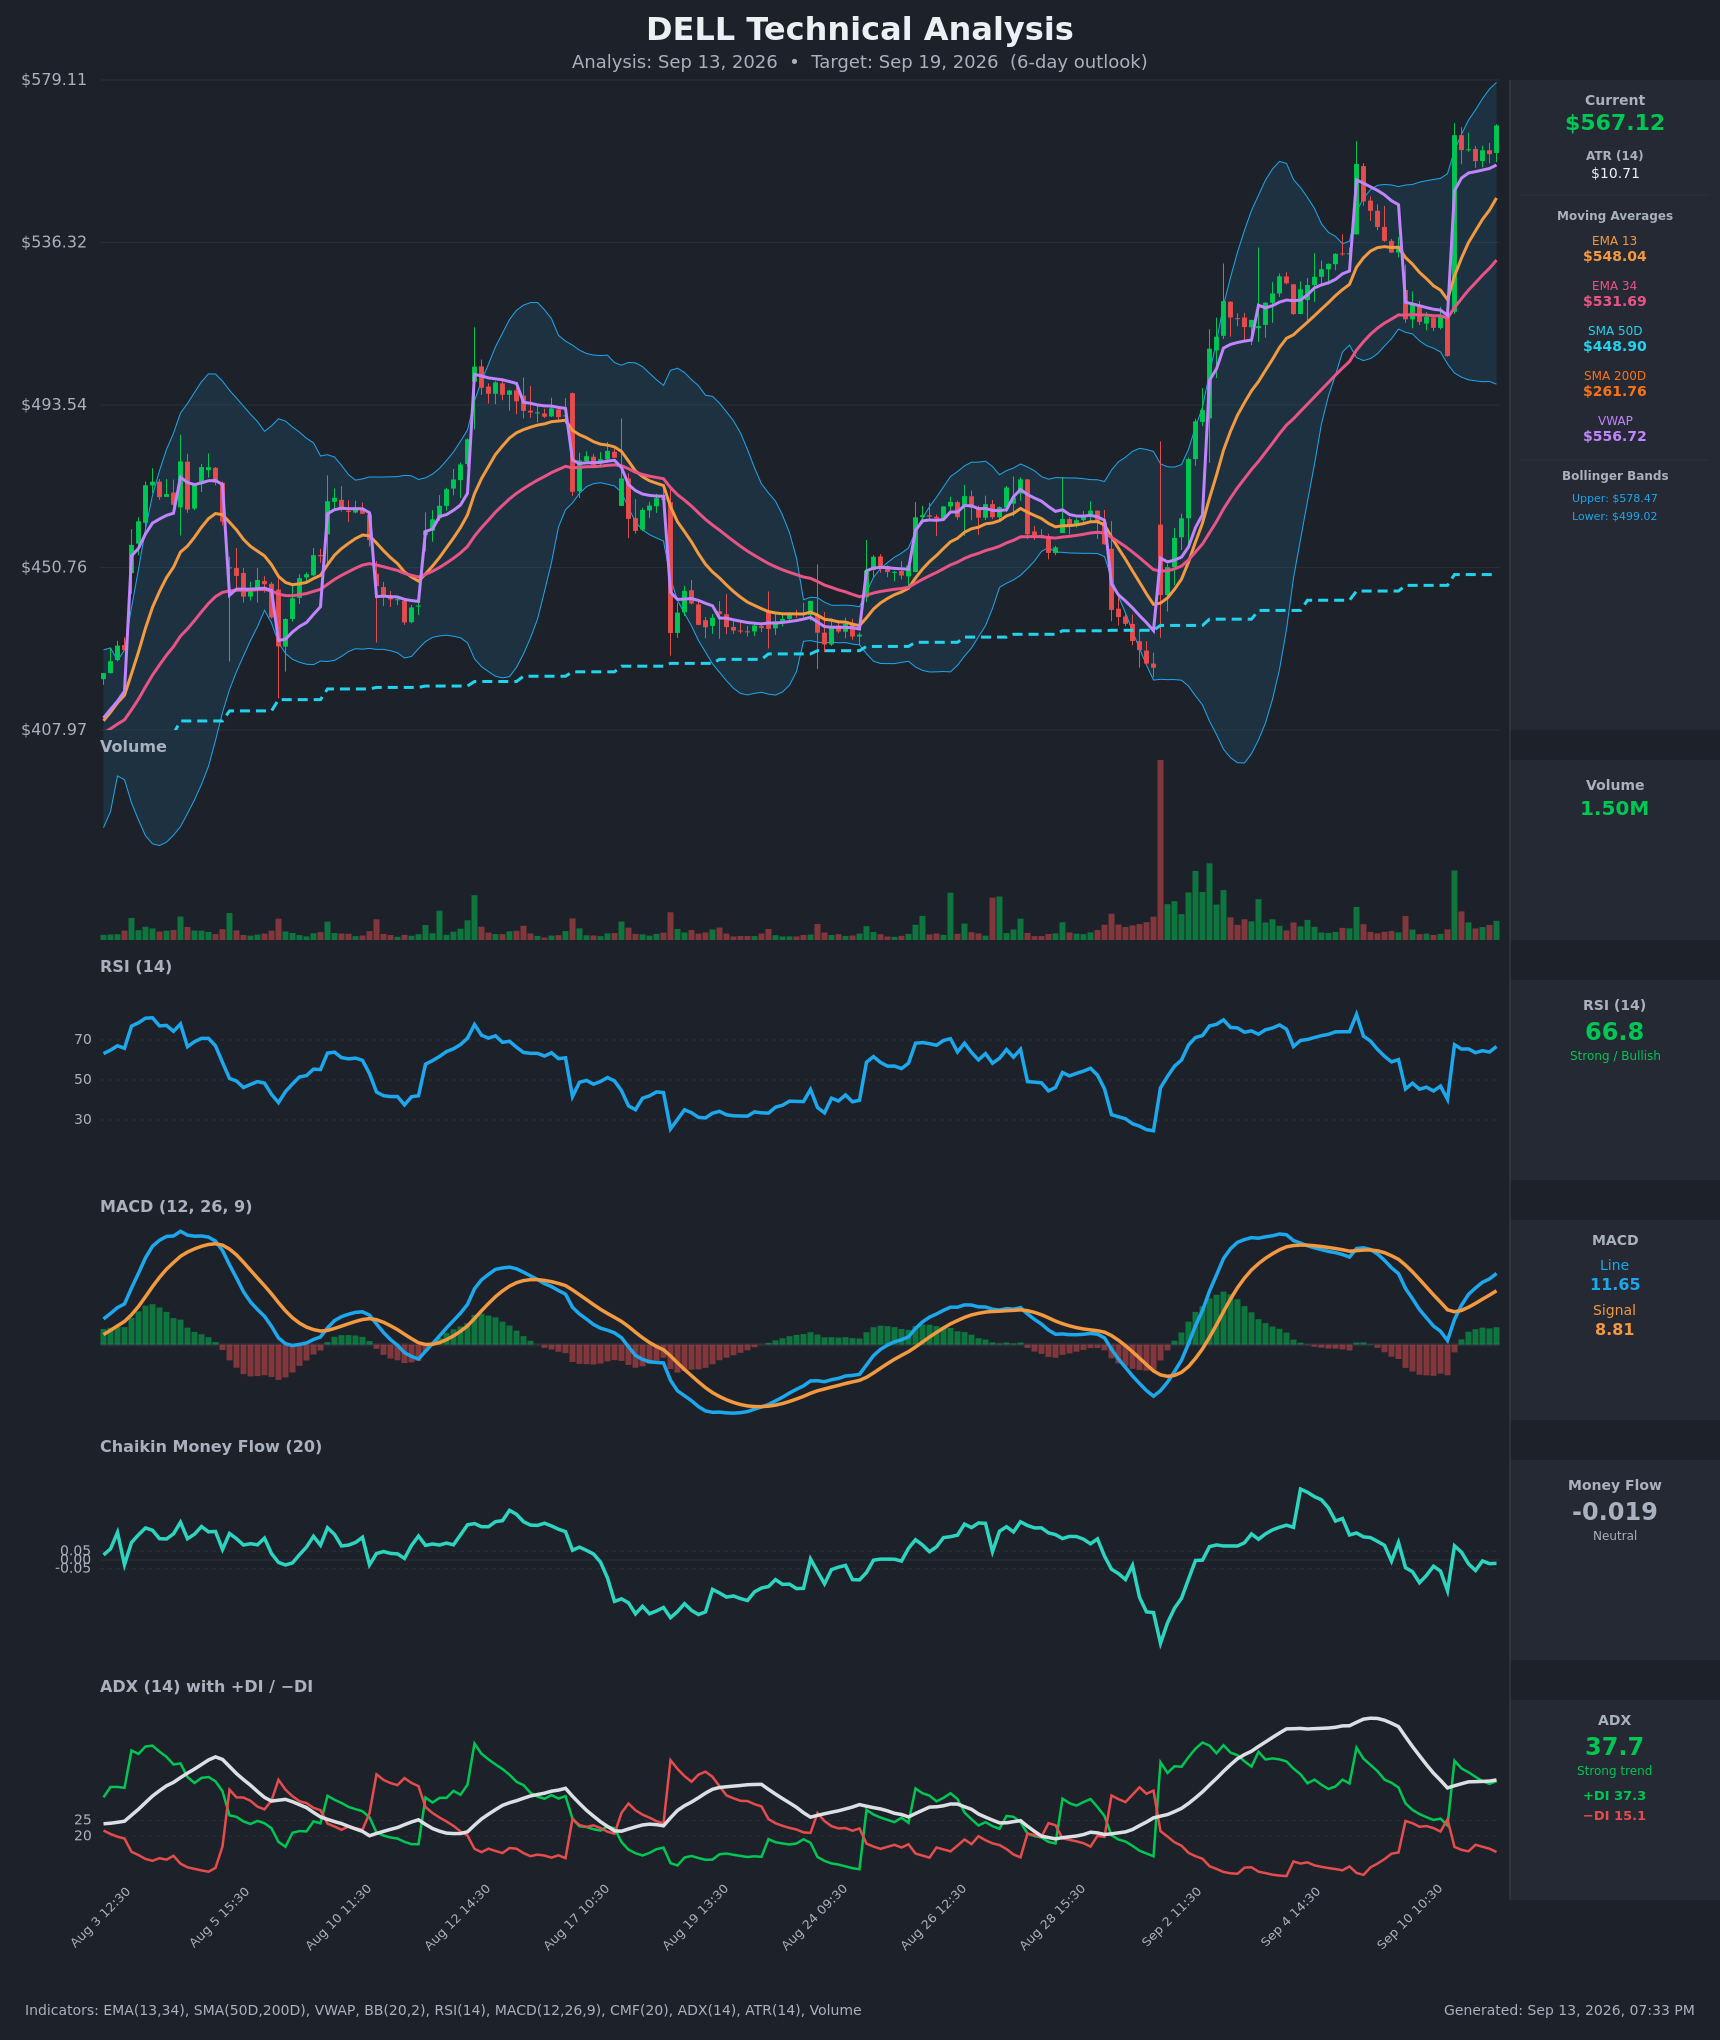
Model vs. Market: The options market implies $518.39–$616.19 into September 18; the 5-day technical model targets $579.00 within a $549.00–$588.00 band. The chart model is far more confident about where than the options market is — its whole projected range fits inside the middle third of the implied move. If the stock delivers anything like the ±8.6% the options are paying for, the chart model's band gets blown through in either direction.
The practical effect on strikes below: because both models cluster near $579 and mark technical resistance at $578.47, the bullish spread's short strike sits at $590 — above the target rather than at it — and the range-holding structure's short call sits at $585, just above that resistance shelf rather than inside it.
Full technical write-ups: 3-day report → · 5-day report →
4 · Three ways the next five days can go
If DELL pushes above $580: that is the heaviest block of September 18 call open interest above the stock (1,290 contracts, 5,819 across all expirations). Heavy call open interest overhead tends to slow rallies as dealers hedge against it, but above $590 the chain thins out dramatically — the listed September 18 strikes stop at $597.50, and open interest above that is negligible. A clean break through $590 leaves very little positioning structure until the implied-range edge at $616.19.
If DELL drifts between $550 and $580: this is the pin case, and it's unusual here because max pain for September 18 sits at $450, more than $100 below the market. With the expiration's own walls stranded that far down, there is no expiring open interest with the weight to pull price toward it; what's left is the $550 shelf — the whole chain's heaviest call strike and its largest single gamma strike — acting as a floor rather than a ceiling, with the estimated positive-gamma regime damping day-to-day swings inside the band.
If DELL breaks below $548: that's the short-term moving average both chart models flag as invalidation, and it sits just under the $550 open-interest shelf and the $556.72 VWAP. Below it, the next structural markers are the $518.39 implied-range floor and the $514 swing cluster. The gamma-flip estimate at $340 is so far away it offers no warning value — spot is sitting unusually far above that estimate even by this stock's own standards, so the "hedging amplifies selling" regime is not a near-term risk. The near-term risk is simply that a stock 18.3% above its 20-day average mean-reverts hard.
5 · Three defined-risk structures
Prices are end-of-day midpoints as of 2026-09-11. All structures are hypothetical. Verify live prices before trading — these will be stale by the open.
If you lean bullish: Sep 18 $570/$590 call debit spread
- Trade: Buy the September 18 $570 call, sell the September 18 $590 call
- Debit: $7.60 · Max profit: $1,240 per spread · Max loss: $760 · Break-even: $577.60
- Why it fits: With premium running about 23 vol points below delivered movement, you want to be long options, not short them. The short strike parks at $590, above both chart-model targets and above the $580 open-interest cluster, so the position captures the move the trend read describes without selling the tail the realized volatility says is live.
- Makes sense only if: you accept that a 62.1% at-the-money IV still makes the long leg expensive in absolute terms, and that the stock must clear $577.60 by Friday just to break even.
- Invalidated if: DELL closes below $548.
- Managing it: Take profit at roughly 60–70% of maximum value rather than holding for the full $20 width; with the short-dated sentiment reading as a front-end chase rather than a broad build, earlier profit-taking is the right instinct. Close it on any close below $548 rather than waiting for Friday.
- Liquidity note: The $570 calls quote 40¢ wide on 2,442 contracts of volume and the $590 calls 20¢ wide on 1,456 — both among the most-traded contracts in the expiration. Fills should be straightforward.
- Analyze this position →
If you expect the range to hold: Sep 18 $510/$500 put + $585/$595 call iron condor
- Trade: Sell the $510 put, buy the $500 put, sell the $585 call, buy the $595 call — all September 18. You collect a credit up front and keep it if DELL finishes between the short strikes.
- Credit: $4.08 · Max profit: $408 · Max loss: $592 · Break-evens: $505.92 and $589.08
- Why it fits: The short strikes sit outside the technical bands both chart models project ($549–$588 and $551–$583), and the short call is above the $578.47 resistance shelf. The estimated positive-gamma regime argues for damped movement inside the corridor.
- Health warning: you're selling premium that hasn't been rich lately — at-the-money IV is roughly 23 vol points below what DELL has actually delivered over twenty sessions, and both break-evens sit inside the ±$48.90 the options themselves are pricing. This is the structure the volatility data likes least.
- Makes sense only if: you believe realized movement is about to decelerate toward implied, not the other way around.
- Invalidated if: DELL closes above $585 or below $510 before Friday.
- Managing it: Close at roughly 50% of maximum credit; exit regardless by Thursday's close rather than carrying gamma risk into expiration. If either short strike is breached on a closing basis, close the tested side instead of hoping.
- Liquidity note: The $510 puts quote 20¢ wide and the $500 puts 5¢, both on heavy volume. The wings are looser — the $585 calls quote 55¢ wide (about 4.5% of mid) and the $595 calls 50¢ — so work the order and expect some slippage on the call side.
- Analyze this position →
If you lean bearish: Sep 18 $560/$540 put debit spread
- Trade: Buy the September 18 $560 put, sell the September 18 $540 put
- Debit: $7.53 · Max profit: $1,247.50 per spread · Max loss: $752.50 · Break-even: $552.48
- Why it fits: It's the mean-reversion expression, and it's a debit structure — the right side of a thin volatility premium. The case: the stock sits 18.3% above its 20-day average, money flow has stayed negative through the entire advance, and short-dated sentiment reads as a leveraged front-end chase with nothing being built beyond 30 days. This fights the headline bias, so size it accordingly.
- Makes sense only if: $548 gives way — below it the spread is already working and the next markers are $518.39 and $514.
- Invalidated if: DELL closes above $580.
- Managing it: This is a counter-trend trade against an ADX-confirmed uptrend, so treat it as a short-fuse position: take 50% of max value if it comes quickly, and cut it if the stock closes back above $570.
- Liquidity note: The $560 puts quote 40¢ wide on 3,132 contracts and the $540 puts 15¢ wide on 1,403 — the tightest pair on the put side of this expiration.
- Analyze this position →
If none of these: no trade
Standing aside is entirely defensible here. DELL has realized 85% annualized volatility over twenty sessions and is priced for 62% — which means credit structures are being paid less than the movement has historically cost, and debit structures still carry a 62% vol price tag on the long leg. That's a market with no cheap side. On top of that, the stock has run 33% in fifty sessions into its 52-week high with money flow quietly negative, and the expiration's own walls and max pain are all stranded $100+ below spot, so the usual expiration-pinning logic offers no anchor this week. If you would not be comfortable watching a $567 stock travel $49 in either direction by Friday, the honest answer is to wait for either a pullback toward the $550 shelf or a clean breakout above $580 with follow-through.
6 · Quick FAQ
What is DELL's expected move this week? ±$48.90, or ±8.62%, into the September 18 expiration — a $518.39 to $616.19 range around the $567.29 close, per the options market's straddle pricing as of September 11.
Is DELL expected to go up or down over the next five days? Options positioning as of September 11 leans bullish — leading positioning, flow momentum, and short-dated sentiment all point the same way, and the stock has cleared every strike where meaningful option open interest was built — but that's a read of what traders have already done, not a forecast. The actionable map is the $518.39–$616.19 range and the $550 shelf below / $580 cluster above.
Are DELL options expensive right now? Two lenses, same answer. IV rank of 42/100 says option prices are higher than 42% of the past year's readings — middling. But at 62.1% at-the-money IV, they're running about 23 vol points below the movement DELL has actually delivered over the past twenty sessions, thinner than roughly three-quarters of this stock's own recent readings. On that basis, owning premium beats selling it this week.
Where is DELL's biggest options support and resistance? For the September 18 expiration specifically, the put wall is $460 and the call wall is $450 — both far below the stock after the rally, which is exactly why there's so little structure overhead. Across the whole chain, the heaviest put strike is $500 and the heaviest call strike is $550. The only meaningful cluster above spot is $580.
What invalidates this week's read? A close below $548.
Methodology & disclosures. Data: end-of-day options-chain snapshot for DELL, 2026-09-11, generated 2026-09-13T19:33:17.981Z. Prices shown are midpoints and will differ from live markets. Momentum/positioning scores and volatility-premium comparisons are descriptive measurements of past option flow and past price movement — not investment advice, signals, forecasts, or guarantees. All trade structures are hypothetical. Every structure shown has a defined maximum loss; you can lose the entire max-loss amount. Options involve substantial risk and are not suitable for all investors.