DELL Options Price a $43 Move Into September 25 — Our Chart Model Sees $560
DELL options imply a $525.17–$610.95 range into the September 25 expiration, while both technical reads target $560. Here's what Friday's put surge actually changed, where the walls sit, and three defined-risk ways to trade a market whose options are cheaper than the stock's own movement.
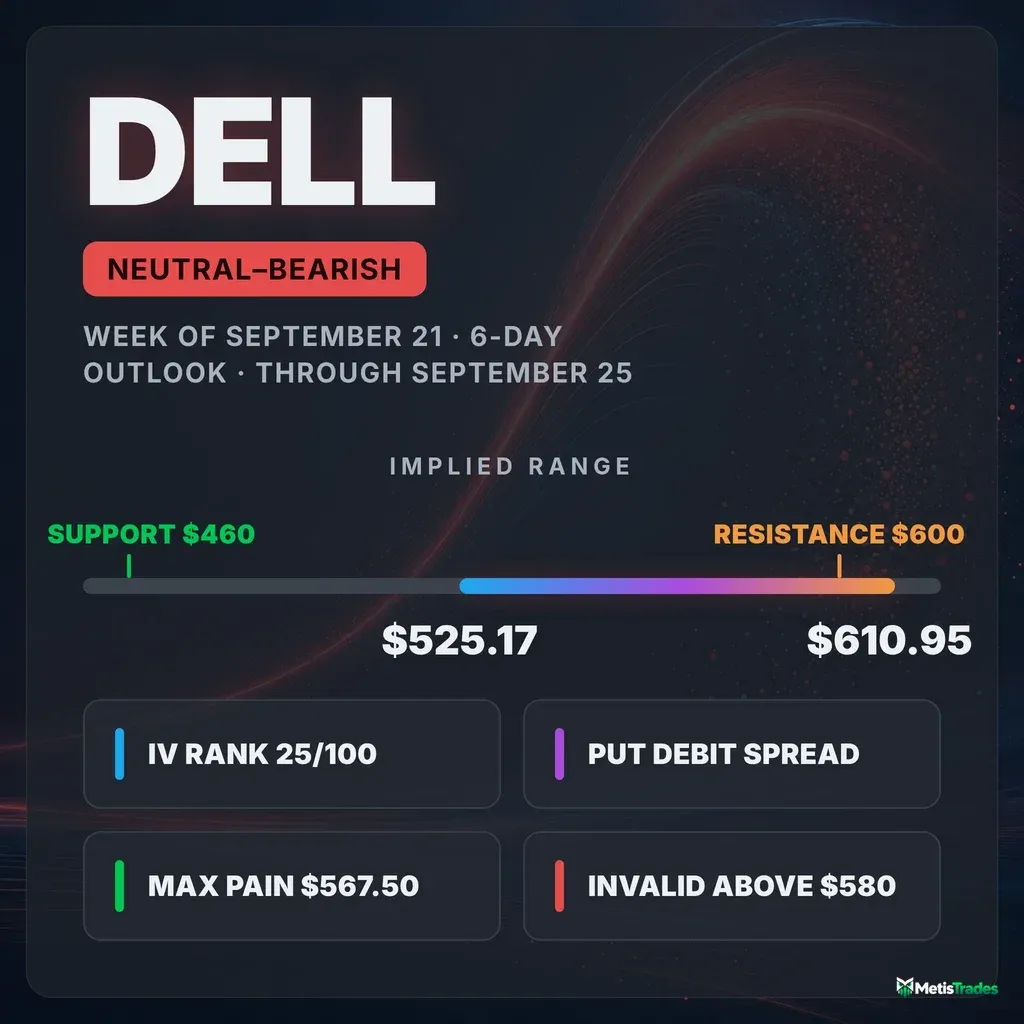
The options market implies a $525.17–$610.95 range into the September 25 expiration; here's what's driving it and three defined-risk ways to trade it.
Published Saturday, September 19, 2026 · Data as of Friday, September 18 close · Export generated September 19, 2026
Explore the live DELL options data in the Detailed Options Analyzer →
Quick answer
| Item | Answer |
|---|---|
| Market bias | Neutral with a bearish tilt |
| Options-implied range (into Sep 25) | $525.17 – $610.95 (±7.55%) |
| Major support | $460.00 (Sep 25 put wall) |
| Major resistance | $600.00 (Sep 25 call wall) |
| Max pain (Sep 25) | $567.50 |
| Dealer gamma regime (estimate) | Positive — hedging tends to dampen moves; flip level ≈ $340 |
| Volatility condition | Falling — IV rank 25/100 · premium thin: options priced ~27 vol points below delivered movement |
| Technical check | Confirms (bearish, 3-day and 6-day) |
| Best-fitting strategy | Sep 25 $570/$550 put debit spread |
| Analysis invalidated if | DELL closes above $580 |
1 · What matters today
DELL closed Friday, September 18 at $568.06 after giving back roughly 3.5% from $588.40 the session before. The options market is pricing a move of about $42.89 either way — ±7.55% — through the September 25 expiration, which frames a $525.17 to $610.95 range. The single most important thing that changed: put activity exploded. For every call contract traded on Friday there were 1.58 puts, against a roughly 0.92 average over the past 14 sessions, and open put contracts grew by 26,806 while call contracts shrank by 13,249. That is a hedging wave, not a collapse — the stock is still up 30.7% over 20 sessions. Both technical reads also lean lower, targeting $560. The level that changes the picture is $580: a close above it and the downside lean is dead.
2 · What the options market is pricing
What changed this week
Price went nowhere and positioning went everywhere. DELL is up just 0.14% over the trailing five sessions but +30.7% over 20, and the path there included a −5.06% gap down on September 14 and a +1.86% gap up on September 16. Against that backdrop, Friday's flow turned decisively defensive: put/call volume printed 1.58 versus a 0.79 sixty-day median and a 1.00 average over the last seven sessions, and the ratio of open put contracts to open call contracts climbed from 0.58 to 0.91 over five days — a 56% build. Compared with this stock's own recent history, Friday's put-heavy volume reading was one of the most extreme in the sample. Implied volatility kept bleeding through all of it: the market's estimate of how much DELL will move, baked into option prices, fell 4.6% on the day and 5.8% over five sessions.
The biggest forward-looking change in open contracts sat in the target expiration: the September 25 $600 calls added 465 contracts on 1,798 lots traded (about $1.22 million of premium changing hands), while the September 25 $577.5 and $580 puts added 427 and 417 contracts respectively. Into the September 18 expiration that settled Friday, the $565 puts had added 1,472 contracts of open interest — settled history now, but it tells you where the hedging started. One more note for context: the short- and long-term trend reads still agree on the upside (price is up over both the 20- and 50-session lookbacks with the near-term read flat), but our flow-momentum measure flipped from a bullish to a bearish crossover on September 18 — a fresh turn against a still-intact uptrend.
Expected move
Into September 25, the options market is pricing a move of roughly ±$42.89, or ±7.55% — that figure is derived from what at-the-money straddles cost, and it describes the size of the swing, not a target. Around Friday's $568.06 close, that maps to $525.17 on the downside and $610.95 on the upside.
| Expiration | Implied move | Range around $568.06 |
|---|---|---|
| Sep 25 (7 DTE) | ±7.55% | $525.17 – $610.95 |
| Oct 2 (14 DTE) | ±11.02% | $505.46 – $630.66 |
| Oct 9 (21 DTE) | ±13.79% | $489.72 – $646.40 |
| Oct 16 (28 DTE) | ±16.14% | $476.37 – $659.75 |
The ladder rises smoothly with time — no kink, no step-up between rungs, which is what a chain looks like when there is no dated event pulling one expiration's pricing away from its neighbours.
Volatility
At-the-money implied volatility sits at 58.5%. IV rank is 25/100 — today's reading is cheaper than about 75% of the past year's, and the percentile measure (45/100) says a bit under half of the last year's sessions closed below it. Direction is firmly down: IV is 20.5% below its 30-day average of 73.6% and 37.5% below where it sat 30 snapshots ago. The front-month read and term-structure slope are unavailable today (a same-day-expiring nearest contract can't be interpolated into a front-month number), so the across-expirations comparison sits out this week.
The stock, meanwhile, has been anything but calm: 20-day realized volatility — how much DELL has actually been moving — is 85.1%, running above this name's own recent norm, with the 5-day-versus-20-day pace slightly cooler than its own month.
Premium rich or cheap. The volatility risk premium — the gap between how much movement options are priced for and how much DELL has actually delivered — is negative by about 27 vol points (58.5% implied against 85.1% delivered). When that number is positive, option sellers have been collecting more than realized movement cost them; here it is deeply the other way. At the 26th percentile of this stock's own recent readings, today's premium is thinner than roughly three-quarters of them, and it has been negative continuously since early September, when the stock's realized movement exploded. That combination — IV rank 25 and a 26th-percentile premium against delivered movement — argues for owning premium rather than selling it this week, and it is why the debit structures lead the trade section below.
Skew and sentiment
A clean 25-delta skew reading — how much more expensive puts are than equidistant calls — isn't available for Friday's snapshot, so the headline comparison against this name's 0.75 vol-point sixty-day norm has to sit out. What is available says the same thing anyway: the 25-delta put carries a 60.0% implied volatility against 58.5% at the money, and across expirations in the one-to-four-week window, 25-delta puts are running about 3.4 vol points over the matching calls versus a 2.2-point baseline for this name — roughly 1.2 points richer than usual. Traders are paying up for downside protection, modestly.
Directional lean in short-dated options is where the story sharpens. The 0–7 day bucket scored −58 and the 7–30 day bucket −21, against seven-session averages near flat (−4 and +1). Our read of options flow summarises it as aggressive front-end put demand — an abrupt swing, not a settled regime. One genuine counterweight: 13 call contracts versus 8 puts cleared the peer-relative unusual-volume bar, so the sweep-sized single-contract activity still skewed to the call side even as aggregate put volume swamped the tape.
The key levels map
| Level | Price | Why it matters |
|---|---|---|
| Top of the implied range (Sep 25) | $610.95 | Upper rail of the ±7.55% move priced for the target expiration |
| Call wall (Sep 25) | $600.00 | Heaviest call open interest at the target expiration (1,364) — the strike with the biggest pile of open calls, which often acts as a barrier |
| 52-week high | $595.51 | Friday's close sits 4.6% below it |
| Heavy gamma strike | $580.00 | One of the chain's largest gamma piles; Sep 25 put open interest here grew by 417 contracts Friday |
| Chart resistance (EMA13) | $577.00 | The technical model's reclaim level — the bearish chart case fails above it |
| Spot | $568.06 | September 18 close |
| Max pain (Sep 25) | $567.50 | Where the most option value would expire worthless — expirations sometimes gravitate toward it |
| Chart support (EMA34) | $566.00 | The 3-day report's stated support and its bearish-continuation trigger |
| Chart-model target | $560.00 | Both technical reports' target; also a large gamma strike chain-wide |
| Lower Bollinger band | $556.54 | The 6-day report's stated support |
| Chain-wide heaviest call strike | $550.00 | Aggregate call wall across all expirations (9,164) and the largest total-gamma strike — note this differs from the Sep 25 wall at $600 |
| Bottom of the implied range (Sep 25) | $525.17 | Lower rail of the priced move |
| Swing support | $514.00 | Heuristic level from recent swing-pivot clustering — an estimate, not a guaranteed reaction zone |
| 20-day moving average | $503.67 | Price sits 12.8% above it — the rally is stretched versus its own month |
| Chain-wide heaviest put strike | $500.00 | Aggregate put wall across all expirations (9,596) |
| Put wall (Sep 25) | $460.00 | Heaviest put open interest at the target expiration (868) — but a brand-new strike, 19% below spot and thin |
| Gamma flip estimate | $340.00 | One rough estimate of where market-maker hedging would start amplifying selling instead of cushioning it — far below the market |
The wall disagreement matters: for the September 25 expiration specifically, the heaviest call strike is $600 and the heaviest put strike is $460, while the whole chain combined clusters at $550 calls and $500 puts. Use the September 25 pair for this week's map; the aggregate pair describes where October and beyond sits.
Positioning and unusual flow
The dealer-gamma read is an estimate, not observed inventory, and it says positive at both the whole-chain level and for the September 25 expiration on its own: in this regime market-maker hedging tends to dampen moves rather than amplify them, and spot sits roughly 40% above the estimated flip level of $340 — further above it than is typical for this name. Translation: nothing in the positioning structure is set up to accelerate a slide this week.
Three non-expired flow items stood out, all in the target expiration. The $600 calls traded 1,798 contracts against 1,364 open — about $1.22 million of premium — and added 465 contracts of open interest, which is exactly how a call wall gets built. The $580 puts traded 904 against 464 open and added 417 contracts; the $575 calls traded 1,246 against 272 open at the 100th percentile of their peer group. And a brand-new $460 put strike appeared with 868 contracts of open interest on 400 lots — a far-out-of-the-money crash hedge that, mechanically, is now the expiration's put wall despite sitting 19% below the market.
3 · Technical check
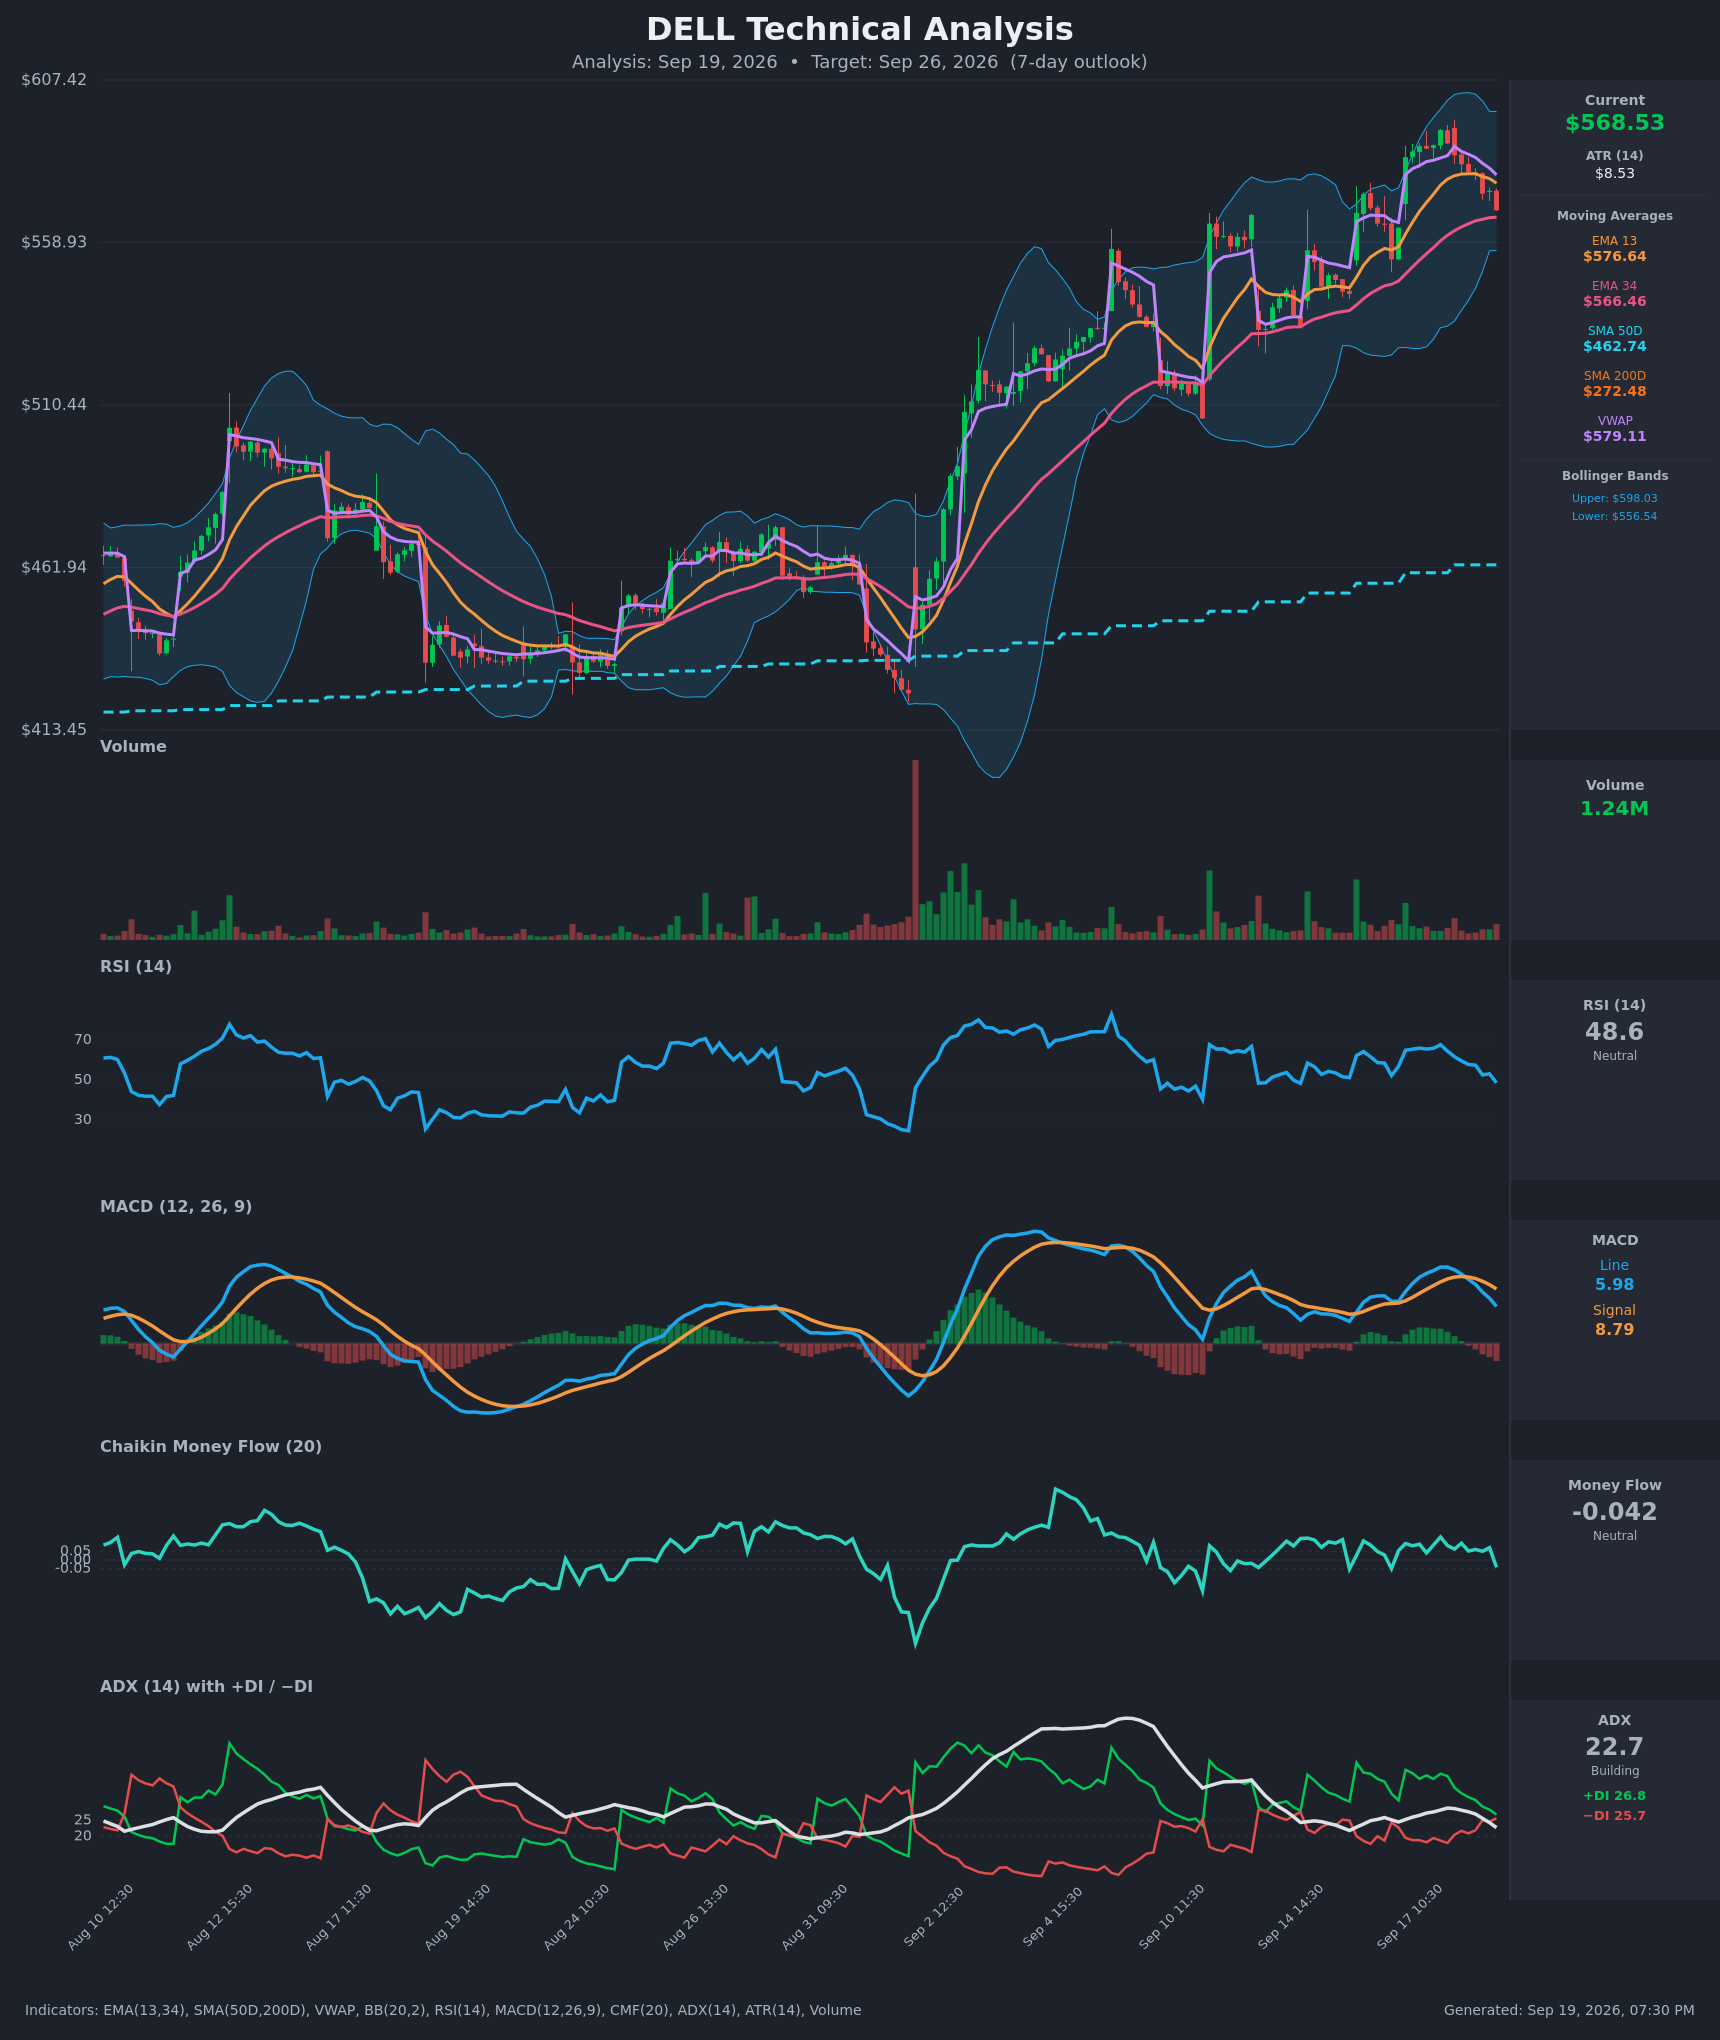
Both technical reads are bearish and both land inside the options-implied range, which classifies them as confirming the positioning tilt rather than extending it. The 3-day report (target date September 22) puts DELL at $560 with a projected band of $550 to $580, citing a MACD crossover on September 18, RSI rolling over from 67.6 to 48.6, and money flow turning negative for the first time in over a week. The 6-day report (target date September 25) also targets $560, with a wider projected band of $546 to $586, and adds that the +DI/−DI lines have converged to 26.8 versus 25.7 — a directional crossover it considers imminent.
Both reports are explicit that the longer-term structure is still an uptrend: price sits far above its 50- and 200-day averages, and neither calls this a reversal. The dominant scenario in the 6-day report is a pullback toward $550–$556, invalidated by a reclaim and hold above $577. That invalidation level is three dollars under the $580 gamma-and-open-interest shelf the options data points at, which is why the trade structures below use $580 as the kill switch rather than a tighter chart number.
Model vs. Market: The options market implies $525.17–$610.95 into September 25; the 6-day technical model targets $560 with a $546–$586 band. The chart model is calling for a far smaller, directional drift inside a range the options market has priced generously — if the stock simply sits still for three sessions, the option buyer loses and the chart model is still right.
Full technical write-ups: 3-day report → · 6-day report →
4 · Three ways the next six days can go
If DELL pushes above the call wall ($600): that is where the heaviest September 25 call open interest sits, and it grew on Friday — positioning like that tends to slow rallies as dealers hedging short calls sell into strength. A clean break through it leaves the $610.95 upper rail of the implied range as the next reference, with thin expiration-specific open interest in between. Getting there requires a 5.6% move in six sessions, which this stock has managed repeatedly this month.
If DELL drifts between the rails: max pain for September 25 sits at $567.50, 56 cents under Friday's close, and the estimated dealer gamma regime is positive — hedging flows that dampen rather than amplify. This is the mechanically easiest outcome: a chop between roughly $556 and $580 into expiration, with expiring open interest exerting a mild pull toward the $567.50 area.
If DELL breaks lower: be honest about the geography — the September 25 put wall at $460 is 19% below the market and unreachable inside six sessions, so it is not the level that matters here. The practical downside branch runs through $566 (the chart support), then $556.54, and then the $550 strike that carries the chain's largest total gamma. Below that, the implied-range floor of $525.17 is the next options reference. The estimated gamma flip at $340 stays far away throughout, so the positioning structure offers no acceleration mechanism on this timeframe — a slide here would have to come from selling pressure, not hedging mechanics.
5 · Three defined-risk structures
Prices are end-of-day midpoints as of September 18, 2026. All structures are hypothetical. Verify live prices before trading — these will be stale by the open. Note up front: DELL's option markets are wide right now, with most September 25 strikes quoting 7–14% of mid. Work limit orders at the midpoint; do not pay the ask.
If you lean bearish (the structure the data favours): Sep 25 $570/$550 put debit spread
- Trade: Buy the September 25 $570 put, sell the September 25 $550 put
- Debit: $8.68 · Max profit: $1,132.50 · Max loss: $867.50 · Break-even: $561.33
- Why it fits: It is the bias direction expressed with bought rather than sold premium, which is the right side of a market where options are priced about 27 vol points below what the stock has actually delivered. Both technical reads target $560 — inside the spread's profitable zone — and the short $550 leg sits at the chain's largest gamma strike, a natural place for a slide to stall.
- Makes sense only if: you think the September 17–18 rollover extends rather than resolves as another shallow flag in an intact uptrend.
- Invalidated if: DELL closes above $580.
- Managing it: the near-term flow turning down against a 50-session uptrend argues for short holds and early exits — take profit if DELL trades into the $555–$550 area, and make a keep-or-kill decision by September 23 rather than letting six days of time decay do the deciding.
- Liquidity note: the $570 puts quoted $17.05/$18.65 (about $1.60 wide, 9% of mid) and the $550 puts $8.55/$9.80 (about $1.25 wide, 14% of mid). Both are wide — leg in with limits and expect to give up something on the fill.
- Analyze this position →
If you lean bullish: Sep 25 $570/$580 call debit spread
- Trade: Buy the September 25 $570 call, sell the September 25 $580 call
- Debit: $4.58 · Max profit: $542.50 · Max loss: $457.50 · Break-even: $574.58
- Why it fits: the trend reads over 20 and 50 sessions are still bullish, and buying the spread rather than selling a put spread respects a market where premium is thin versus delivered movement. The short $580 leg caps the trade right at the heavy gamma shelf where a bounce would most plausibly stall, well below the $600 call wall.
- Makes sense only if: you read Friday's put surge as hedging into a strong run rather than the start of a top — the position needs a reclaim of the $577 chart resistance to work.
- Invalidated if: DELL closes below $560.
- Managing it: take half off if DELL trades $580; with seven days to expiration this decays quickly, so close the balance by September 23 unless the stock has already cleared the short strike.
- Liquidity note: the $570 calls quoted $16.70/$18.25 (9% of mid) and the $580 calls $12.20/$13.60 (11% of mid) — wide, but among the tighter pairings in this expiration.
- Analyze this position →
If you expect the range to hold: Sep 25 $540/$545/$592.5/$597.5 iron condor
- Trade: Sell the $545 put / buy the $540 put, and sell the $592.5 call / buy the $597.5 call, all September 25
- Credit: $2.78 · Max profit: $277.50 · Max loss: $222.50 · Break-evens: $542.23 and $595.28
- Why it fits: the estimated dealer gamma regime is positive at this expiration, max pain sits at $567.50 essentially on top of spot, and both short strikes sit outside the $546–$586 band the 6-day chart model projects. A credit spread collects premium up front and wins if price stays between the short strikes.
- Health warning: you're selling premium that hasn't been rich lately — implied volatility is running about 27 vol points below what DELL has actually delivered over 20 sessions, and at the 26th percentile of this stock's own recent readings. Both short strikes are around 30-delta, which is aggressive for a name that gapped 5% in a single session this month.
- Makes sense only if: you believe realized movement is about to converge down toward implied, not the other way around.
- Invalidated if: DELL closes outside $542.23–$595.28.
- Managing it: close at roughly 50% of max credit; if either short strike is breached on a closing basis, take the loss rather than defend.
- Liquidity note: the $592.5 calls quoted $7.65/$10.15 and the $540 puts $5.75/$6.65 — 12–15% of mid on the outer legs. This is the widest of the three structures and the one where slippage will hurt most; a four-leg fill at anything worse than $2.40 credit materially changes the math.
- Analyze this position →
If none of these: no trade
There is a real case for standing aside. The options are objectively cheap versus delivered movement, which is the classic setup for buying premium — but "cheap" here means the stock has been realizing 85% volatility, gapping 2–5% on ordinary sessions, and a six-day debit spread can be right about direction and still be destroyed by the path. Meanwhile the quoted markets are 7–15% of mid across the expiration, so a round trip in any of these structures leaks a meaningful share of the edge before the thesis is even tested. If you cannot comfortably lose the full debit on a one-week position, or you'd be tempted to defend a breached condor, this is a week to watch $580 and $566 and do nothing else.
6 · Quick FAQ
What is DELL's expected move this week? About ±$42.89, or ±7.55%, into the September 25 expiration — a $525.17 to $610.95 range around Friday's $568.06 close, per straddle pricing as of September 18.
Is DELL expected to go up or down over the next six days? Options positioning as of September 18 leans mildly bearish — a heavy one-day swing into puts across both volume and open interest — but that is a read of what traders have done, not a forecast. The actionable map is the $525.17–$610.95 range plus the $460 put wall and $600 call wall, with $567.50 max pain sitting right on top of spot.
Are DELL options expensive right now? No, on both lenses. IV rank 25/100 says option prices are lower than 75% of the past year's readings; on top of that they're running about 27 vol points below the movement DELL has actually delivered over the past 20 sessions — thinner than roughly three-quarters of this stock's own recent readings. That favours owning premium over selling it this week.
Where is DELL's biggest options support and resistance? For the September 25 expiration, the put wall is $460 and the call wall is $600. Note the put wall is a thin, newly created strike 19% below the market; across the whole chain combined, the heaviest strikes are $500 on the put side and $550 on the call side.
What invalidates this week's read? A close above $580.
Methodology & disclosures. Data: end-of-day options-chain snapshot for DELL, 2026-09-18, generated 2026-09-19T19:30:09.594Z. Prices shown are midpoints and will differ from live markets. Momentum/positioning scores and volatility-premium comparisons are descriptive measurements of past option flow and past price movement — not investment advice, signals, forecasts, or guarantees. All trade structures are hypothetical. Every structure shown has a defined maximum loss; you can lose the entire max-loss amount. Options involve substantial risk and are not suitable for all investors.