DELL Options Are Pricing a $42 Move — Our Read Sees a Range Anchored at the $450 Put Wall
After a 19% slide in a month, DELL options imply a $414.26–$498.62 range into October 30, with heavy put hedging sitting right on top of the $450 put wall. Our read of the positioning is neutral; the chart model leans bearish, and that disagreement is the story.
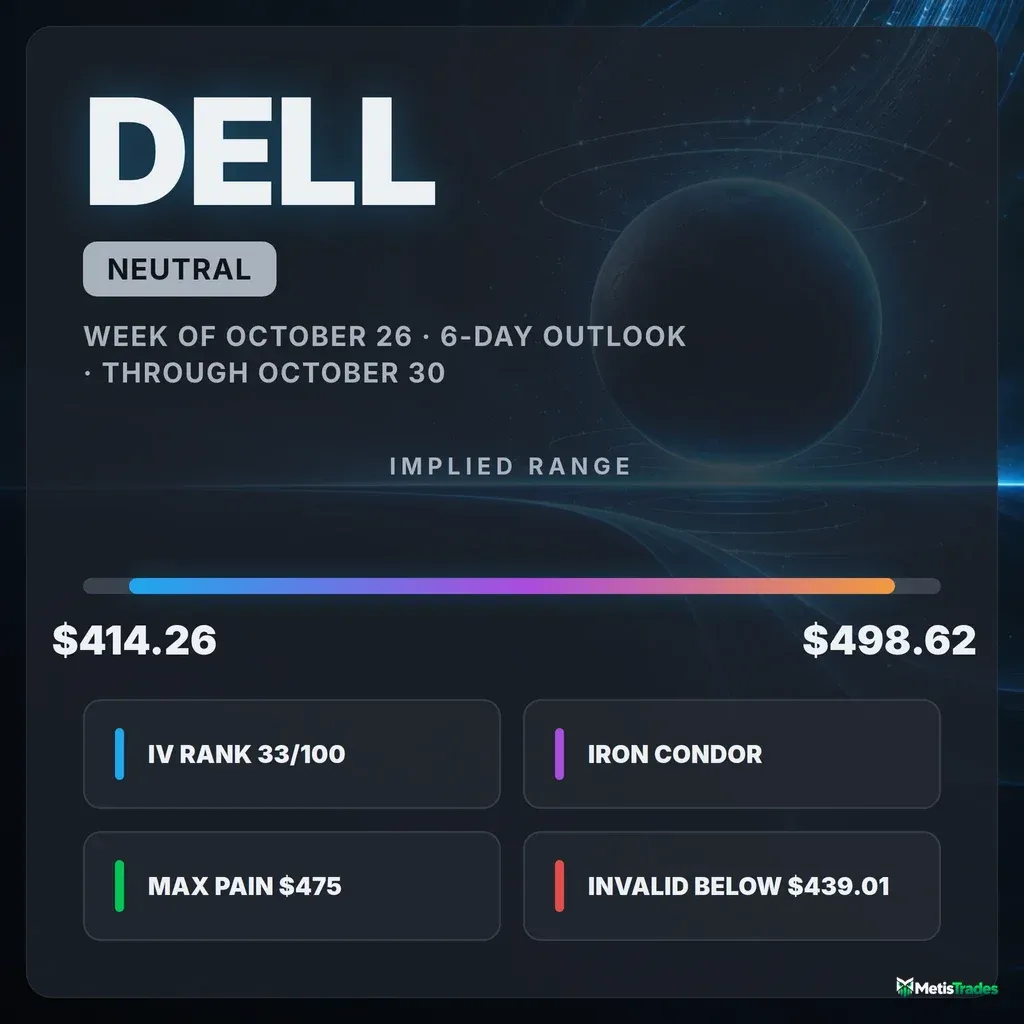
The options market implies a $414.26–$498.62 range into October 30. Here's what is driving it and three defined-risk ways to trade it.
Published Saturday, October 24, 2026 · Data as of Friday, October 23, 2026 close
Explore the live DELL options data in the Detailed Options Analyzer →
Quick answer
| Item | Answer |
|---|---|
| Market bias | Neutral |
| Options-implied range (into Oct 30) | $414.26 – $498.62 (±9.24%, ±$42.18) |
| Major support | $450 (Oct 30 put wall) |
| Major resistance | $600 (Oct 30 call wall). Nearer overhead are max pain at $475 and the whole chain's heaviest strike at $500. |
| Max pain (Oct 30) | $475 |
| Dealer gamma regime (estimate) | Negative: hedging tends to amplify moves. No flip-level estimate is available today. |
| Volatility condition | Neutral. IV rank 33/100 · premium fair: options are priced ~0.7 vol pts above delivered movement. |
| Technical check | Diverges (bearish, 3-day and 6-day models; 6-day target $450, model range $435–$468) |
| Best-fitting strategy | Iron condor around the walls, if the range holds |
| Analysis invalidated if | DELL closes below $439.01 |
1 · What matters today
DELL closed Friday at $456.44 after losing about 19% in a month. Our read of the options market heading into October 30 is neutral.
Traders are clearly paying up for downside protection. But that protection is piled up right at the $450 strike, which holds the most open put contracts for this expiration. Meanwhile, the price where the most option value would expire worthless sits higher, at $475. Taken together, this looks like hedging after a hard drop, not a fresh bet on more downside.
The options market is pricing a move of about $42 either way, so a range of roughly $414 to $499 by October 30.
The level that changes the picture is $439.01. A close below it would break recent swing support and push DELL under the put wall, where market-maker hedging tends to speed moves up.
The chart-based technical models lean bearish, which is the main tension in this setup.
2 · What the options market is pricing
What changed this week
DELL finished the five sessions up 1.0%. That small gain hides a violent path:
- A 7.7% gap higher on October 21.
- A 5.1% gap lower on October 22.
- All of it on top of an 18.9% decline over the past 20 sessions.
Put-heavy positioning eased but did not disappear:
- Put/call open interest (puts held open for every call held open) slipped from 1.55 to 1.37 over five days. That is still well above its 14-day average of 1.12, so traders are holding a lot more protection than they were two weeks ago.
- Put/call volume was 0.97 on Friday, against a 7-day average of 0.87. Puts and calls traded nearly one-for-one, a bit more put-heavy than usual.
Our read of options flow has improved from deeply negative earlier in the week to only mildly negative on Friday. The sellers' grip has loosened.
The single biggest open-interest change was in the November 20 $420 puts. They added 859 contracts, bringing open interest to 2,151, on 1,191 contracts of volume. That is longer-dated insurance roughly 8% below spot.
For context on Friday's expiration, which is now settled history: the October 23 $440 puts gained 780 contracts of open interest into expiry and finished worthless with the stock above $456.
The short-, medium- and longer-term trend reads all agree. The month-long decline dominates, and the last week's bounce only flattened the near-term picture.
Expected move
The expected move is the move the options market is pricing in, derived from what straddles cost. For October 30 it is ±$42.18, or ±9.24%, around the $456.44 spot. That puts the implied range at $414.26 to $498.62.
| Expiration | Implied move | Range around $456.44 |
|---|---|---|
| October 30 | ±9.24% | $414.26 – $498.62 |
| November 6 | ±13.07% | $396.78 – $516.10 |
| November 20 | ±17.93% | $374.60 – $538.28 |
The rungs scale almost exactly with time. Implied volatility is nearly flat across these three expirations, so the market isn't flagging any single date as special. It is simply pricing a stock that has been moving a lot.
Volatility
Implied volatility (IV) is the market's estimate of how much DELL will move, baked into option prices. At-the-money IV is 66.45%.
The IV rank is 33/100, meaning today's IV sits about a third of the way up its past-year range. By a different yardstick, it is higher than about 66% of the past year's daily readings. The past year included some extreme spikes, which stretch the range and keep the rank modest.
Direction over different windows:
- IV slipped 1.8% on the day.
- It is up 0.7% over five sessions and 7.0% over 30.
- It sits above its 30-day average of 60.6% but below its 90-day average of 73.3%.
In short, IV is elevated versus last month but nowhere near its recent extremes.
The front-month comparison across expiration dates is unavailable today, because Friday was an expiry day.
Compared against this stock's own recent history, two things stand out:
- DELL's 20-day realized volatility of 65.7% is actually running a little below its own norm, even after the slide. This stock is used to moving hard.
- Movement over the past week has run slightly faster than over the past month.
Is premium rich or cheap? The volatility risk premium is the gap between how much movement options are priced for and how much DELL has actually delivered. When it is positive, option sellers have been collecting more than realized movement cost them. Right now options are priced only about 0.7 vol points above what DELL has delivered over the past 20 days. That sits in the middle of this stock's recent readings: richer than about 57% of them, no more.
The path explains the near-zero gap. Early October, options were priced about 10 points below delivered movement. Then the gap jumped to about 14 points rich around October 13 as the sell-off began. Since then it has collapsed toward zero, because the sell-off's big daily moves are now inside the 20-day realized window and have mechanically lifted the "delivered" side.
The combination of IV rank 33 and a 57th-percentile premium means neither buying nor selling premium carries a clear edge this week. Structure choice should come from the levels, not from cheap or rich volatility.
Skew and sentiment
Skew captures the fact that puts and calls the same distance from the stock price don't cost the same. When puts are pricier, traders are paying up for crash protection.
- 25-delta puts carry 68.3% IV, versus 63.7% for comparable calls. That is a gap of about 4.6 vol points.
- DELL's 60-day norm is about −0.5 points, meaning calls were normally slightly pricier.
- Skew has averaged 4.8 points over the past seven sessions, so the stretch has persisted all week.
- Versus its own history, this put premium is unusually steep for DELL.
The flow agrees. Among contracts trading at unusually heavy volume for their peer group, puts outnumbered calls 11 to 7 on Friday, a more put-dominated mix than is normal for this name.
Not everything points down:
- Friday's day-over-day open-interest build leaned to calls: about 6,985 call contracts added versus 2,662 puts.
- Sentiment in options expiring within a week turned positive, driven by call open interest building.
- The 7–30 day window stayed negative, with richer puts than usual and put-side flow dominating.
The summary phrase for the curve is "mixed": near-dated traders are leaning on calls while the following month stays hedged. We read the steep put skew as insurance bought after a 19% drop, priced near the $450 floor. We do not read it as conviction that the drop resumes.
The key levels map
| Level | Price | Why it matters |
|---|---|---|
| Call wall (Oct 30) | $600 | Biggest pile of open calls for this expiration (922 contracts). Far above the expected move, so it is more a ceiling on dreams than a near-term barrier. |
| Swing resistance | $530.45 / $517.09 / $506.25 | Pivot clusters from the pre-crash range. |
| 20-day moving average | $524.28 | Price sits 12.9% below it. |
| 50-day moving average | $512.87 | Price sits 11.0% below it. |
| Whole chain's heaviest strike | $500 | Largest call and put open interest across all expirations, and the largest gamma strike. |
| Top of implied range | $498.62 | Upper edge of the Oct 30 expected move. |
| Swing resistance | $485.70 | Near the Oct 22 gap-down origin. That gap ($461.11–$485.88) is still unfilled. |
| Large gamma strike | $480 | Heavy open interest on both calls and puts. |
| Max pain (Oct 30) | $475 | The price where the most option value would expire worthless; expirations sometimes gravitate toward it. |
| Technical resistance | $467.26 | The chart model's key overhead level. |
| 100-day moving average | $466.81 | Just 2.2% overhead. |
| Swing resistance | $463.48 | First overhead pivot. |
| Large gamma strike | $460 | Dense open interest just above spot. |
| Spot (Oct 23 close) | $456.44 | Reference price. |
| Swing support | $454.77 | Immediate floor. |
| Put wall (Oct 30) | $450 | Biggest pile of open puts for this expiration (956 contracts), and the second-largest gamma strike chain-wide. |
| Technical support | $445 | The 6-day chart model's support level. |
| Gamma strike / swing support | $440 / $439.01 | The line in the sand for this analysis. |
| Swing support | $424 / $419.10 | Next structural floors. |
| Bottom of implied range | $414.26 | Lower edge of the Oct 30 expected move. |
Note that the October 30 expiration's walls ($450 put, $600 call) differ from the whole chain's heaviest strike, which is $500 for both calls and puts. For the next six days, the October 30 levels are the relevant ones.
Positioning and unusual flow
Market makers hedge the options they've sold. One rough estimate suggests the dealer gamma regime is negative, both for the October 30 expiration alone and for the chain as a whole. In this regime their hedging tends to amplify moves rather than dampen them.
That is why a ±9% expected move isn't exaggerated: if price slips, hedging flows can add to selling rather than absorb it. No reliable flip-level estimate is available today.
Notable live flow:
- Nov 20 $420 puts: 1,191 contracts traded, about $1.97 million in premium. Open interest rose by 859. This is the largest dollar flow in the chain: someone is paying real money for protection roughly 8% below spot over the next month.
- Oct 30 $442.5 puts: 212 contracts against only 12 open, about 18 times existing open interest. This is short-dated interest in a break just below the put wall.
- Oct 30 $500 calls: 1,064 contracts traded against 774 open, at a $3.55 midpoint. This is cheap upside lottery interest at the chain's heaviest strike, the counterweight to the put buying.
3 · Technical check
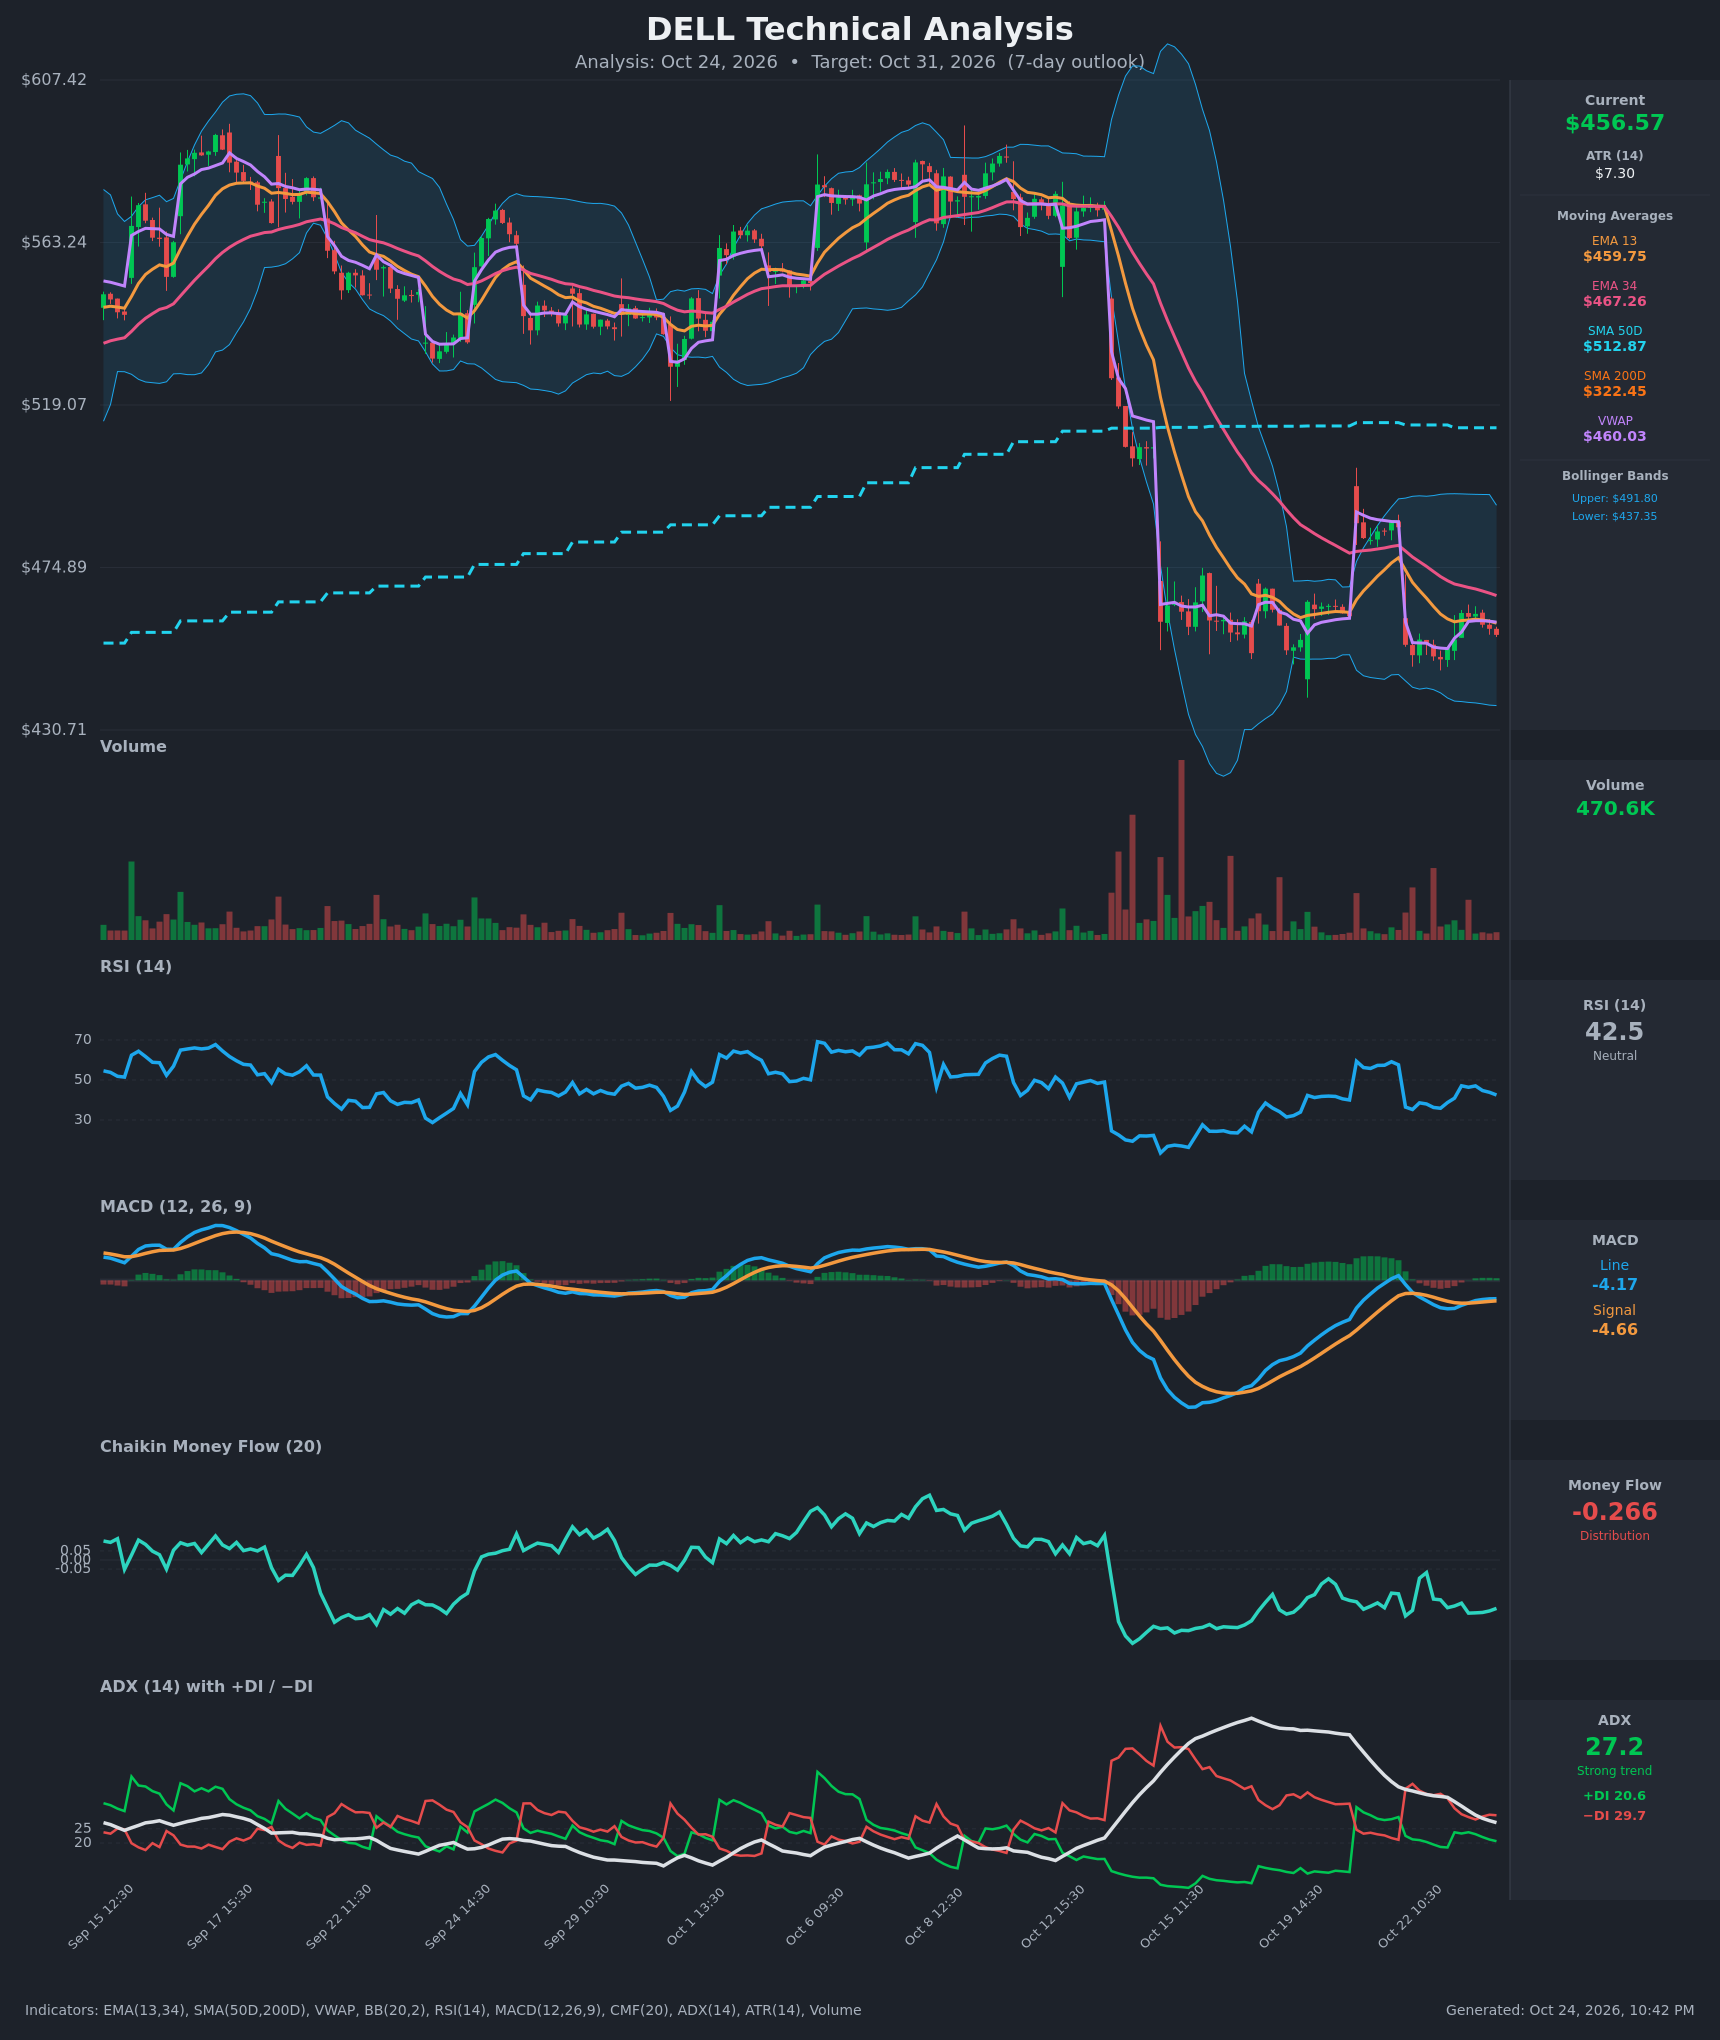
The 3-day chart model (target date October 27) is bearish. It targets $452 within a projected range of $438 to $466. It describes a bear-flag consolidation between roughly $450 and $462 after the gap-down, with money-flow readings showing persistent distribution. Its dominant scenario is a breakdown below $449.50, invalidated by a close above $467.
The 6-day chart model (target date October 30) is also bearish. It targets $450 within a projected range of $435 to $468, with support at $445 and resistance at $467.26. Its main breakdown scenario is invalidated by a close above $468. The trend-strength readings show sellers in control, but that trend is fading as it matures.
Both targets sit well inside the options-implied range, so this is not a magnitude disagreement. It is a direction disagreement: the charts expect drift lower, while the options positioning sees a hedged market sitting on a put wall with max pain above. We classify both as Diverges.
The resolution point is $445–$449.50. A decisive break there would confirm the charts and take the stock toward our $439.01 kill switch. Holding it keeps the options read in charge.
Model vs. Market: The options market implies $414.26–$498.62 into October 30; the 6-day technical model targets $450. The model's target sits right on the put wall, so the next few sessions will show whether that wall acts as a floor or as the trapdoor the chart expects.
The TA did shape strike selection. The condor's short put sits at $437.5, just below the 6-day model's $435–$468 range low being tested, and its short call at $487.5 sits well above the model's $468 ceiling.
Full technical write-ups: 3-day report → · 6-day report →
4 · Three ways the week can go
If DELL pushes toward max pain ($475) and beyond: The October 22 gap ($461.11–$485.88) is unfilled, and positioning above spot thins out after the $460 and $480 gamma strikes. In a negative-gamma regime, a rally can feed on itself as hedgers buy. The $600 call wall is too far away to cap anything this week. The practical brakes are the $467.26 technical resistance and the $485.70 swing level.
If DELL drifts between $450 and $475: This is the base case. The heaviest October 30 put pile sits at $450, and max pain at $475 sits above spot, so expiring open interest has no reason to drag price lower. With the steep put skew already paid for, a quiet week tends to bleed that insurance premium, which favors range structures.
If DELL breaks below the put wall ($450): This is the acceleration case. In a negative-gamma regime, one rough estimate suggests hedging amplifies selling rather than cushioning it. A close below $439.01 would break swing support and the $440 gamma strike together, leaving $424 and $419.10 as the next structural floors and the $414.26 bottom of the implied range in play.
5 · Three defined-risk structures
Prices are end-of-day midpoints as of October 23. All structures are hypothetical. Verify live prices before trading; these will be stale by the open.
If you lean bullish: October 30 $440/$430 put credit spread
With a put credit spread, you collect premium up front and are betting DELL stays above the short strike through expiration.
- Trade: Sell the Oct 30 $440 put ($9.70), buy the Oct 30 $430 put ($6.75).
- Credit: $2.95 · Max profit: $295 · Max loss: $705 · Break-even: $437.05
- Why it fits: The short strike sits below the $450 put wall and right at the $440 gamma strike, so you are selling into the rich put skew (puts about 4.6 points over calls) beneath the biggest put pile.
- Makes sense only if: The $450 put wall holds on closing basis early in the week.
- Invalidated if: DELL closes below $439.01.
- Managing it: Close at about 50% of max credit. Because the month-long trend is still down, take profits early rather than holding into the final day. Exit regardless by the October 29 close, and close immediately if DELL closes through $440.
- Liquidity note: The $440 puts traded 30¢ wide (about 3% of mid), and the $430 puts 20¢ wide (about 3%). Fills near mid are realistic.
- Analyze this position →
If you expect the range to hold: October 30 $427.5/$437.5 – $487.5/$500 iron condor
An iron condor pairs a put credit spread with a call credit spread. You collect premium on both sides and profit if DELL stays between the short strikes.
- Trade:
- Put side: sell the Oct 30 $437.5 put ($8.925), buy the $427.5 put ($6.15).
- Call side: sell the Oct 30 $487.5 call ($5.925), buy the $500 call ($3.55).
- Credit: $5.15 · Max profit: $515 · Max loss: $735 (on the wider $12.50 call side) · Break-evens: $432.35 and $492.65
- Why it fits: The short put sits below the $450 put wall and the $439.01 support. The short call sits above max pain ($475) and the $485.70 swing resistance. Both chart models' projected ranges ($438–$466 and $435–$468) sit inside the short strikes.
- Makes sense only if: The base case plays out and the put wall and max pain bracket the week.
- Invalidated if: DELL closes below $439.01, or above $485.70 on the upside.
- Managing it: The negative-gamma estimate means moves can accelerate, so don't defend a tested side. Close the whole condor if either short strike is breached on a close. Take profits at about 50% of credit, and exit by the October 29 close.
- Liquidity note: Quoted spreads on the four legs:
- $437.5 puts: 25¢ wide (about 3%).
- $427.5 puts: 30¢ wide (about 5%).
- $487.5 calls: 25¢ wide (about 4%).
- $500 calls: 10¢ wide.
- Analyze this position →
If you lean bearish: October 30 $455/$440 put debit spread
With a put debit spread, you pay up front for a defined-risk bet that DELL falls toward the lower strike.
- Trade: Buy the Oct 30 $455 put ($15.80), sell the Oct 30 $440 put ($9.70).
- Debit: $6.10 · Max profit: $890 · Max loss: $610 · Break-even: $448.90
- Why it fits: It expresses the chart models' bearish view, with both targets near $450, at a defined cost. Selling the $440 put recovers some of the steep put premium, so you aren't paying full price for skew.
- Makes sense only if: DELL fails at the $460–$467.26 resistance cluster and closes below the $450 put wall.
- Invalidated if: DELL closes above $467.26.
- Managing it: Take profits at about 60–70% of max value if $440 is reached early. Exit by the October 29 close; this spread loses value quickly if the stock simply sits still.
- Liquidity note: The $455 puts traded 30¢ wide (about 2%), and the $440 puts 30¢ wide (about 3%). Both are easy fills.
- Analyze this position →
If none of these: no trade
Standing aside is a defensible choice here:
- Premium is neither rich nor cheap: about 0.7 vol points over delivered movement, with an IV rank of 33. Neither side of the volatility trade has an edge.
- Dealer positioning is estimated to amplify moves, so range trades can be overrun quickly.
- DELL has gapped 4–8% four times in the past eight sessions. A $42 expected move means any of these structures can swing from max profit to max loss in a single session.
If you can't watch the position daily, waiting for the $445–$450 zone to resolve before choosing a side costs you nothing but a little time decay.
6 · Quick FAQ
What is DELL's expected move this week? ±$42.18 (±9.24%) into October 30, for a range of $414.26 to $498.62, per the options market's straddle pricing as of the October 23 close.
Is DELL expected to go up or down over the next week? Options positioning as of October 23 reads neutral. Heavy put hedging is concentrated at the $450 put wall, while max pain sits higher at $475. That is a read of what traders have done, not a forecast. The actionable map is the $414.26–$498.62 range and the $450 support level.
Are DELL options expensive right now? IV rank 33/100 puts implied volatility about a third of the way up its past-year range. On top of that, options are running only about 0.7 vol points above the movement DELL has actually delivered, richer than about 57% of this stock's recent readings. In short, premium is fairly priced, with no clear edge for buyers or sellers. Puts specifically are expensive relative to calls.
Where is DELL's biggest options support and resistance? For October 30, the put wall is $450 and the call wall is $600. Max pain is $475, and the whole chain's heaviest strike is $500.
What invalidates this week's read? A DELL close below $439.01.
Methodology & disclosures. Data: end-of-day options-chain snapshot for DELL, 2026-10-23, generated 2026-10-24T22:42:01.874Z. Prices shown are midpoints and will differ from live markets. Momentum/positioning scores and volatility-premium comparisons are descriptive measurements of past option flow and past price movement — not investment advice, signals, forecasts, or guarantees. All trade structures are hypothetical. Every structure shown has a defined maximum loss; you can lose the entire max-loss amount. Options involve substantial risk and are not suitable for all investors.