DELL Options Outlook: Will the $400 Put Wall Hold Through November 6?
After an 11.9% gap down, DELL options imply a $379.41–$469.19 range into the November 6 expiration. Put buying hit an extreme, but positioning this lopsided has often marked hedging after a shock rather than the start of a new leg lower.
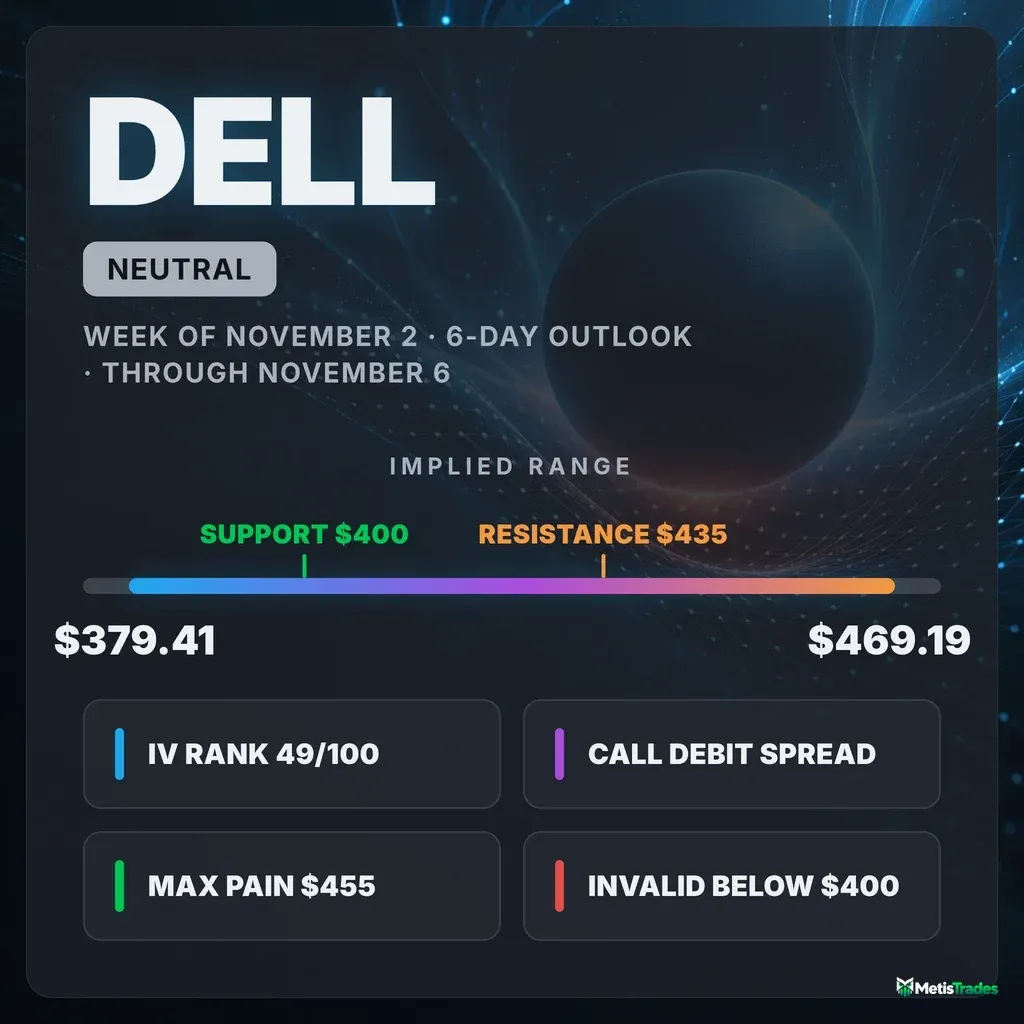
The options market implies a $379.41–$469.19 range for DELL into the November 6 expiration. This article covers what is driving that range, why record put buying does not settle the direction, and three defined-risk ways to trade it.
Published Saturday, October 31, 2026 · Data as of Friday, October 30, 2026 close
Explore the live DELL options data in the Detailed Options Analyzer →
Quick answer
| Item | Answer |
|---|---|
| Market bias | Neutral |
| Options-implied range (into Nov 6) | $379.41 – $469.19 (±10.58%, ±$44.89) |
| Major support | $400.00 put wall (Nov 6 expiration and the whole chain) |
| Major resistance | $435.00 call wall (Nov 6 expiration; thin open interest) |
| Max pain (Nov 6) | $455.00 |
| Dealer gamma regime (estimate) | Negative: hedging tends to amplify moves. No flip-level estimate is available in today's data. |
| Volatility condition | Rising. IV rank 49/100. Premium is thin: options are priced ~0.7 vol pts below the movement DELL has actually delivered. |
| Technical check | Diverges (bullish, 3-day and 6-day; 6-day target $434.00) |
| Best-fitting strategy | Nov 6 $425/$440 call debit spread, but only while DELL holds $415. Debit structures beat premium-selling this week. |
| Analysis invalidated if | DELL closes below $400 |
1 · What matters today
Our read is neutral.
DELL gapped down nearly 12% on Friday and closed at $424.30. Traders then bought puts at a pace far beyond anything this stock has seen lately. That flow looks bearish on its face. For DELL, though, readings this lopsided have more often been hedging after a shock than the start of a new leg lower.
The options market is pricing a move of about $44.89 either way by November 6, which gives a range of roughly $379 to $469. The level that matters most is $400. That strike holds the biggest pile of open put contracts in the entire chain. A close below it would turn this from a post-gap stabilization story into a breakdown.
The technical models lean toward a modest bounce into the $430s, which adds a mild counterweight to the put-heavy flow.
2 · What the options market is pricing
What changed this week
DELL fell 7.04% over the past five sessions, and almost all of it came Friday. The stock opened at $419.03 after a $475.51 close, an 11.88% gap down. Over the past month it is down 24.57%.
The options market reacted on every measure:
- Implied volatility (IV), the market's estimate of how much DELL will move baked into option prices, rose 9.1% in a day and 19.5% in five days.
- IV rank climbed to 49/100, against a 7-day average of 39.4 and a 14-day average of 34.5.
- The put/call volume ratio (how much put trading there is relative to calls; above 1 means puts dominate) hit 3.21. Over the past seven sessions it averaged 1.21. That is the most put-heavy session for this name relative to its own recent norm by a wide margin.
- Open interest (contracts currently held open) shifted the same way. The put/call open-interest ratio rose to 1.97 against a 7-day average of 1.27. Call open interest shrank by 25,089 contracts while put open interest grew by 18,673.
Some of that flow was settled history by the close. Into Friday's expiration, the October 30 $420 puts alone traded 23,168 contracts.
The short- and long-term trend reads agree on direction: bearish over the past week and the past month, flat over the past two-plus months. Our momentum read flipped back through neutral to the bearish side on Friday. That flip came just one session after a brief bullish turn, so the near-term trend has been whipsawing rather than grinding.
Expected move
The expected move is the move the options market is pricing in, derived from what straddles cost. For the November 6 expiration it is ±$44.89, or ±10.58%, around the $424.30 spot. That is a range of $379.41 to $469.19.
| Expiration | Implied move | Range around $424.30 |
|---|---|---|
| November 6 | ±10.58% | $379.41 – $469.19 |
| November 13 | ±14.35% | $363.41 – $485.19 |
| November 20 | ±17.17% | $351.45 – $497.15 |
| November 27 | ±22.27% | $329.81 – $518.79 |
The rungs widen roughly with time, with one exception. The November 27 expiration carries noticeably richer IV (80.4%) than November 20 (71.6%), so its range steps out further than time alone would explain.
Volatility
At-the-money IV stands at 79.43%. That is well above its 30-day average of 62.1% and above its 90-day average of 73.1%. It is up 35.8% over the past 30 sessions.
An IV rank of 49/100 means today's IV sits about midway between its 52-week low and high. By IV percentile, however, it is higher than about 84% of the past year's daily readings. In other words, DELL options are expensive by this stock's historical standard, even though they are not at their peak.
The front-month term structure (comparing option prices across expiration dates) is unavailable today because of the expiry-day artifact. The ~60-day IV is 71.1%, below the headline 79.43%, so near-dated options are carrying the stress.
Realized volatility tells the same story. DELL's 10-day realized volatility is 88.3%, versus 80.1% over 20 days and 70.8% over 30 days. The stock's own movement is accelerating, and its short-term pace is running well above its own recent norm.
Is premium rich or cheap? The volatility risk premium is the gap between how much movement options are priced for and how much DELL has actually delivered. When it is positive, option sellers have been collecting more than realized movement cost them.
- Right now the gap is slightly negative. Options are priced about 0.7 vol points below the 80.1% DELL has delivered over 20 days.
- That reading sits right at the 50th percentile of this stock's own recent readings: richer than half of them, thinner than the other half.
- Earlier this week the gap was about +4.6 points. The violent price action ate that cushion.
So what? An IV rank of 49 combined with a premium that is not running above delivered movement favors owning premium through defined-risk debit spreads over selling it this week.
Skew and sentiment
Skew means that puts and calls the same distance from the stock price don't cost the same. When puts are pricier, traders are paying up for crash protection. Today, 25-delta puts trade at 81.5% IV against 70.3% for calls, a gap of 11.2 vol points. DELL's 60-day norm is roughly flat, at −0.4 points, and the past seven sessions averaged about 3.7. Traders are paying a steep premium to protect against a further drop.
Unusual flow agrees. Nine put contracts cleared the top-percentile volume bar versus four calls.
Sentiment by expiration is split:
- Next 7 days: the reading is bullish (+69). The summary label is a "bullish blow-off," meaning a front-end chase. That score, however, rests only on a modest net build of call open interest in the near week.
- 7 to 30 days: the reading is bearish (−38).
- 30 to 60 days: also bearish (−43).
Read the whole curve as defensive, with a small speculative bounce bet layered on the front week. Our leading positioning read, which is built only from flow and skew, printed its most put-heavy level of the past several months.
Context matters here. For DELL specifically, extreme put readings like this have more often accompanied hedging after a sharp drop than fresh downside conviction. That is why we do not take the flow at face value.
The key levels map
| Level | Price | Why it matters |
|---|---|---|
| 50-day moving average | $513.89 | Intermediate trend line, now far overhead |
| Whole-chain call wall | $500 | Heaviest call open interest across all expirations (5,323 contracts) |
| Swing resistance | $485.70 | Top of the pre-gap trading range |
| Unfilled gap (top) | $475.51 | Thursday's close, where Friday's gap began |
| Swing resistance | $463.48 | Prior pivot inside the gap zone |
| Max pain (Nov 6) | $455 | Where the most Nov 6 option value would expire worthless; sits well above spot |
| Large-gamma strikes | $450 / $440 | Heavy open interest that can slow price as it approaches |
| Swing resistance | $439.01 | First structural ceiling above spot |
| Call wall (Nov 6) | $435 | Heaviest Nov 6 call strike, but only 46 contracts, so a weak barrier |
| Spot | $424.30 | Friday's close |
| Swing support | $424 / $419.10 | The post-gap shelf buyers defended Friday |
| Put wall (Nov 6 and whole chain) | $400 | Largest put pile for the week (922 contracts) and the chain (12,058); also the single largest gamma strike |
| Swing support | $368.15 / $358.88 | Next structural floors if $400 breaks |
| 200-day moving average | $331.27 | Long-term uptrend line, still well below |
The Nov 6 walls ($435 / $400) differ from the whole-chain walls ($500 / $400). The two agree on the floor and disagree on the ceiling. For this week, $435 is the relevant upside marker, but it is thinly held.
The max-pain level is also worth unpacking. Max pain is the price where the most option value would expire worthless, and expirations sometimes gravitate toward it. Here it sits at $455, above the call wall.
Positioning and unusual flow
Market makers hedge the options they've sold. One rough estimate puts dealer gamma in negative territory, both for the Nov 6 expiration and for the whole chain. In this regime their hedging tends to amplify moves rather than cushion them. Combined with realized volatility running hot, that argues for respecting the full width of the implied range.
Three pieces of non-expired flow stood out:
- Nov 20 $400 puts: 2,051 contracts traded, about $3.7 million in premium, on a strike now holding 3,538 open contracts. This is the biggest dollar trade in the live chain, and it reinforces $400 as the line traders are protecting.
- Nov 6 $400 puts: 1,662 contracts traded (about $1.4 million), roughly double the open interest that existed in the strike before, building this week's put wall.
- Nov 6 $440 and $450 calls: 657 and 532 contracts traded, against just 19 and 46 open contracts. These are small, fresh bets on a snap-back. They are not size, but they explain the bullish tint in the front-week sentiment read.
3 · Technical check
Both chart-model reports lean bullish. Each describes an oversold relief bounce inside a strong downtrend.
- 3-day report: targets $428.50 by November 3, with a projected range of $415.00–$435.00.
- 6-day report: targets $434.00 by November 6, with a projected range of $412.00–$445.00.
Both targets sit comfortably inside the options-implied range. That makes this a divergence on direction, not magnitude: the chart models tilt up, while the raw options flow tilts down.
Two readings carry the technical case. RSI rebounded from an extreme 15.3 to 24.7, and money flow turned back to accumulation even as price made a new low. Against that, a strong-trend reading with sellers dominant keeps the models' own conviction modest. The 6-day report's dominant bounce scenario is invalidated on a close below $415.44.
Model vs. Market: The options market implies $379.41–$469.19 into November 6. The 6-day technical model targets $434.00. A move through the $435 call wall would side with the chart models; a close back below $415 would hand the argument to the put buyers.
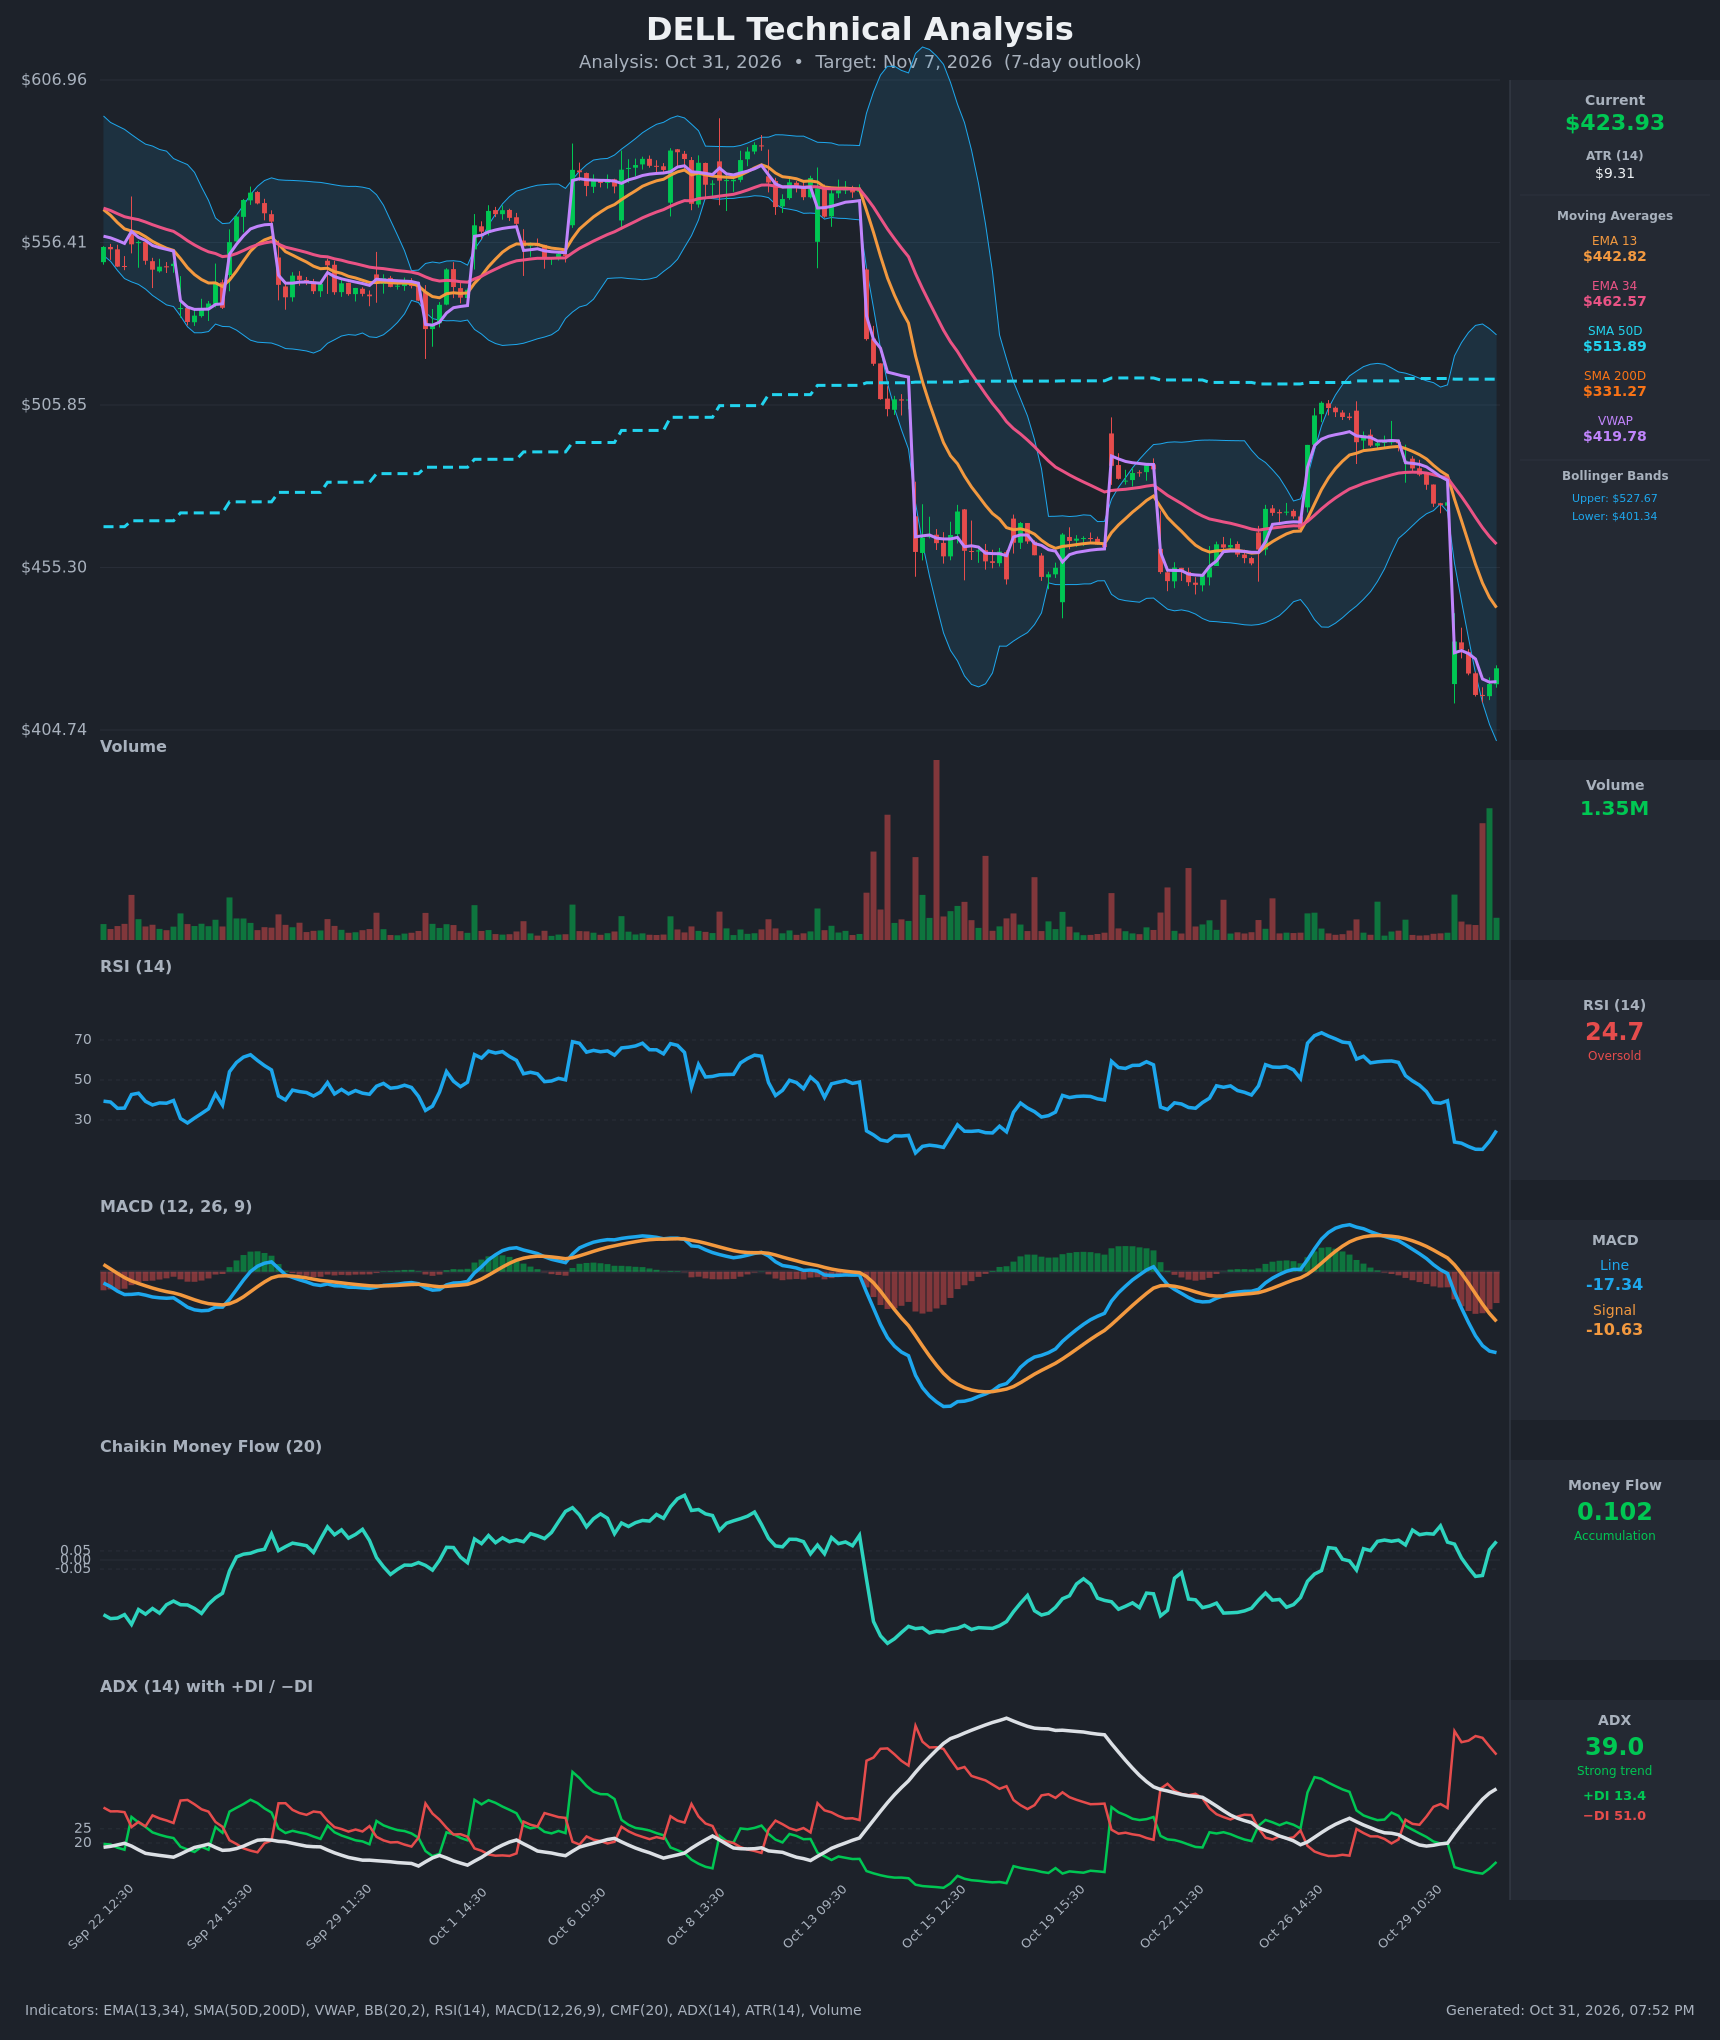
Full technical write-ups: 3-day report → · 6-day report →
The TA's $415 invalidation and its $434–$443 bounce target shaped the bullish structure below. It uses a $425/$440 call spread with $415 as the exit line.
4 · Three ways the week can go
If DELL pushes above the call wall ($435): The Nov 6 call wall is unusually thin at 46 contracts, so it is a weak barrier. In a negative-gamma setting, a clean break can extend quickly. Above $435, the large-gamma strikes at $440 and $450 and the $439.01 swing level are the next speed bumps. Max pain at $455 sits beyond them.
If DELL drifts between the walls ($400–$435): This is the stabilization case. Price digests the gap around the $419–$424 shelf while elevated IV bleeds out of near-dated options. Max pain at $455 is far enough above spot that expiration "gravity" is unlikely to matter much in six days. The walls do more of the work here than max pain does.
If DELL breaks below the put wall ($400): $400 is the largest put pile and the largest gamma strike in the chain. Losing it would remove the level traders have paid most to defend. The negative-gamma estimate suggests market-maker hedging would then add to selling rather than cushion it. The next structural floors are $368.15 and $358.88, and the lower edge of the implied range is $379.41.
5 · Three defined-risk structures
Prices are end-of-day midpoints as of October 30, 2026. All structures are hypothetical. Verify live prices before trading; these will be stale by the open.
The thin premium (options priced at or below delivered movement) puts the debit spreads first this week. The premium-selling structure comes last, with a warning attached.
If you lean bullish: Nov 6 $425/$440 call debit spread
A debit spread means you pay up front for a call spread that profits if DELL rises toward the short strike.
- Trade: Buy the Nov 6 $425 call ($17.38), sell the Nov 6 $440 call ($10.72).
- Debit: $6.65 ($665 per spread)
- Max profit: $835
- Max loss: $665
- Break-even: $431.65
- Why it fits: Both chart models target the $428–$443 zone. The Nov 6 call wall at $435 is thin. Owning premium suits a week where options aren't priced above delivered movement.
- Makes sense only if: DELL holds the $415 area the technical models flag as support.
- Invalidated if: DELL closes below $415.
- Managing it: Take profits at roughly 50–60% of max gain. The longer-term trend is still down, so don't wait for a full run to $440. Exit by the November 5 close regardless.
- Liquidity note: The $425 calls quoted $16.50–$18.25 ($1.75 wide) and the $440 calls $10.05–$11.40 ($1.35 wide). Both are wider than 5% of mid, so work a limit near the midpoint and expect some slippage.
- Analyze this position →
If you lean bearish: Nov 6 $420/$400 put debit spread
Here you pay for a put spread that profits if DELL falls toward the $400 put wall.
- Trade: Buy the Nov 6 $420 put ($16.03), sell the Nov 6 $400 put ($8.55).
- Debit: $7.48 ($747.50 per spread)
- Max profit: $1,252.50
- Max loss: $747.50
- Break-even: $412.52
- Why it fits: Skew is 11.2 vol points steep, put flow hit an extreme, and the bearish trend reads agree. Selling the $400 put caps the trade at the wall where buyers have historically defended.
- Makes sense only if: The post-gap shelf at $419 gives way in the first session or two.
- Invalidated if: DELL closes above $435.
- Managing it: Close at roughly 50% of max gain. If $400 is tagged early, take it rather than waiting for expiration. Exit by the November 5 close.
- Liquidity note: The $400 puts quoted $8.05–$9.05 ($1.00 wide) and the $420 puts $15.10–$16.95 ($1.85 wide). Both are wide relative to mid, so use limit orders.
- Analyze this position →
If you expect the range to hold: Nov 6 $395/$400 – $450/$455 iron condor
An iron condor collects a credit by selling a put spread below the market and a call spread above it. You keep the credit if DELL finishes between the short strikes.
- Trade: Sell the $400 put ($8.55), buy the $395 put ($7.15), sell the $450 call ($7.80), buy the $455 call ($6.53). All legs expire Nov 6.
- Credit: $2.68 ($267.50 per condor)
- Max profit: $267.50
- Max loss: $232.50
- Break-evens: $397.33 and $452.68
- Why it fits: The short put sits on the $400 put wall. The short call sits on the $450 large-gamma strike, just below $455 max pain. One caveat: you're selling premium that hasn't been rich lately, and the negative-gamma estimate means moves can overshoot.
- Makes sense only if: DELL settles into a post-gap base and IV starts to fall.
- Invalidated if: DELL closes below $400 or above $450.
- Managing it: Close at about 50% of the credit. If either short strike is breached on a closing basis, close the trade rather than hope.
- Liquidity note: The legs quoted $0.70–$1.10 wide each. Across four legs that friction can consume a meaningful share of a $2.68 credit, so only enter at or near mid.
- Analyze this position →
If none of these: no trade
Standing aside is a legitimate call this week, for three reasons:
- Every Nov 6 leg trades roughly 9–15% wide relative to its midpoint, which taxes both debit and credit structures.
- The direction is genuinely contested. Put flow is extreme, but historically that has been a poor directional signal for DELL, and the chart models disagree with it.
- Premium is not rich enough to pay you for selling it. A negative-gamma, high-realized-volatility tape can punish whichever side is wrong quickly.
Waiting a session or two for DELL to either reclaim the low-$430s or lose $415 costs little and sharpens the trade.
6 · Quick FAQ
What is DELL's expected move this week? About ±$44.89 (±10.58%) into the November 6 expiration. That implies a $379.41–$469.19 range, per straddle pricing as of October 30.
Is DELL expected to go up or down over the next week? Options positioning as of October 30 reads neutral overall. Put buying is extreme, but for this stock that has more often signaled post-shock hedging than continuation. Remember this is a read of what traders have done, not a forecast. The actionable map is the $379.41–$469.19 range and the $400 support / $435 resistance levels.
Are DELL options expensive right now? Partly. IV rank is 49/100, so IV sits midway in its 52-week range, but it is higher than about 84% of the past year's daily readings. Even so, options are priced about 0.7 vol points below the movement DELL has actually delivered, a 50th-percentile reading for this stock. That favors defined-risk debit spreads over selling premium.
Where is DELL's biggest options support and resistance? For November 6, the put wall is $400 and the call wall is $435. The call wall is thinly held. Across the whole chain, the call wall is $500.
What invalidates this week's read? A close below $400, the put wall and the largest gamma strike in the chain.
Methodology & disclosures. Data: end-of-day options-chain snapshot for DELL, October 30, 2026, generated 2026-10-31T19:52:46.455Z. Prices shown are midpoints and will differ from live markets. Momentum/positioning scores and volatility-premium comparisons are descriptive measurements of past option flow and past price movement — not investment advice, signals, forecasts, or guarantees. All trade structures are hypothetical. Every structure shown has a defined maximum loss; you can lose the entire max-loss amount. Options involve substantial risk and are not suitable for all investors.