EEM Expected Move: Options Price a $1.91 Swing Into October 9, Pinned Between $66 and $68.50
The options market implies a $65.76–$69.58 range for EEM into the October 9 expiration, with max pain at $67 and the expiration's walls at $66 and $68.50. Heavy put buying looks like hedging, not a directional call, and the overall read is neutral.
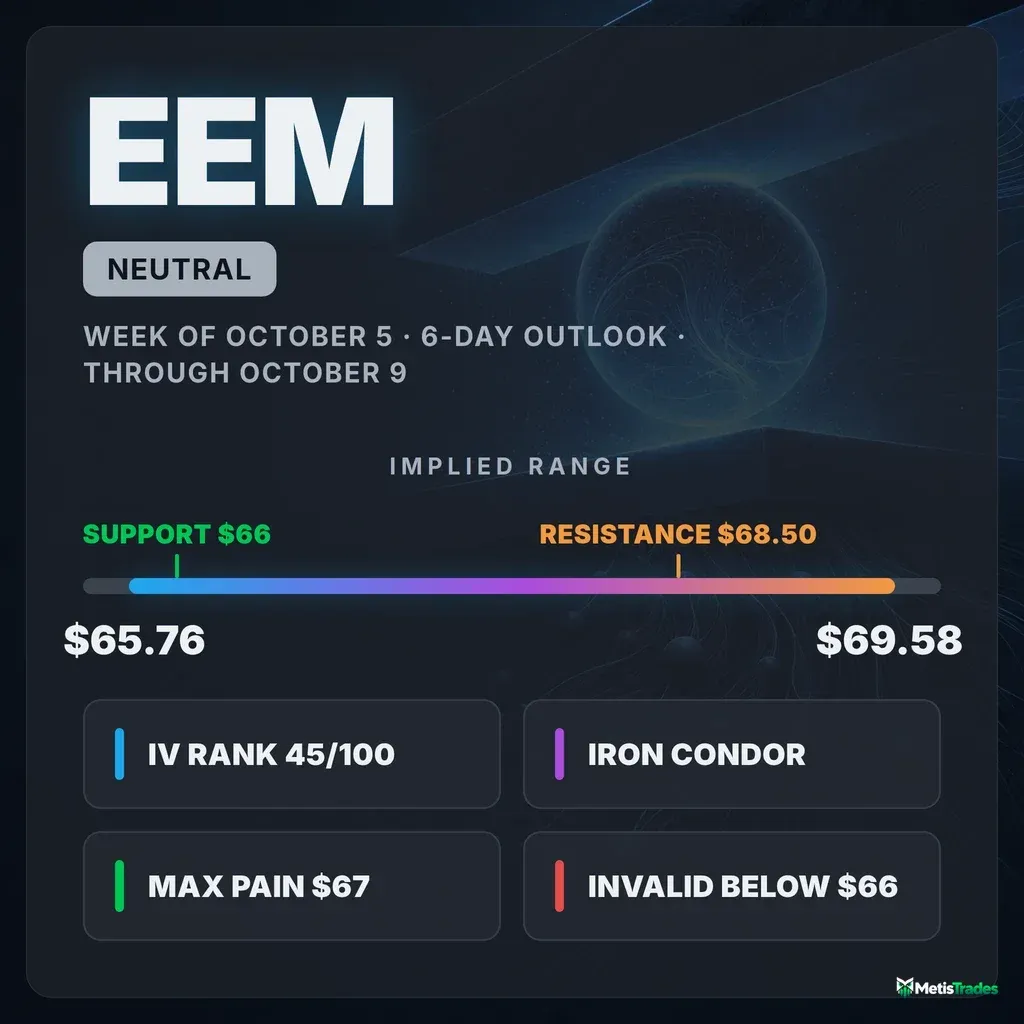
The options market implies a $65.76–$69.58 range for EEM into the October 9 expiration. Here is what is driving it, and three defined-risk ways to trade it.
Published Saturday, October 3, 2026 · Data as of Friday, October 2, 2026 close
Explore the live EEM options data in the Detailed Options Analyzer →
Quick answer
| Item | Answer |
|---|---|
| Market bias | Neutral |
| Options-implied range (into October 9) | $65.76 – $69.58 (±2.82%, about ±$1.91) |
| Major support | $66.00 (October 9 put wall) |
| Major resistance | $68.50 (October 9 call wall) |
| Max pain (October 9) | $67.00 |
| Dealer gamma regime (estimate) | Positive — hedging tends to dampen moves; flip level ≈ $70 |
| Volatility condition | Neutral — IV rank 45/100 · premium fair: options priced ~0.6 vol pts above delivered movement |
| Technical check | Mixed (bullish, 6-day chart model; target $68.05 sits inside the implied range) |
| Best-fitting strategy | Iron condor with short strikes at the $66 / $68.50 walls |
| Analysis invalidated if | EEM closes below $66.00 |
1 · What matters today
EEM closed Friday, October 2, at $67.67. The options market reads it as a neutral setup. On the surface, traders were buying puts heavily: almost five puts traded for every call. Look closer and that flow is protection being bought against an intact uptrend. Traders who bought puts were not betting on a decline. The fund still sits above all its major moving averages.
Options are pricing a move of about $1.91 either way into the October 9 expiration, a range of roughly $65.76 to $69.58. The biggest open-contract piles for that expiration sit at $66 on the put side and $68.50 on the call side. The price where the most option value would expire worthless is $67.
The level that changes the picture is $66. A close below it breaks the floor the positioning is built around. The chart model leans mildly bullish, with a target of $68.05, which still sits inside the options range.
2 · What the options market is pricing
What changed this week
EEM finished the past five sessions down 0.46%, which is essentially flat. The path was not quiet, though: the fund dipped to $66.79 on September 30 and bounced back to $67.67 by Friday.
Implied volatility (IV) is the market's estimate of how much EEM will move, baked into option prices. IV rose about 6.6% over five sessions, then gave back 4.9% on Friday as the price recovered.
Put/call open interest compares put contracts currently held open with call contracts held open. It climbed from 1.24 to 1.29 over five days, against a 7-day average of 1.27 and a 14-day average of 1.19. That means 1.29 puts are now open for every call, a slow but steady build of protection.
The single biggest new position was in the November 20 $73 calls, which added 2,796 contracts of open interest. Close behind were matching builds in the November 20 $67 puts (+2,690) and $67 calls (+2,459), a two-sided pattern that looks like volatility positioning more than a directional bet.
The short-, medium- and long-term trend reads all agree on "flat." Price is down 0.5% over the past week, up 0.3% over about a month, and up 4.8% over about two and a half months, with no clear trend at any horizon.
Expected move
The expected move is the move the options market is pricing in, derived from what straddles cost. For the October 9 expiration it is ±2.82%, or about ±$1.91, around the $67.67 chain price. That puts the 1-sigma range at $65.76 – $69.58.
| Expiration | Implied move | Range around $67.67 |
|---|---|---|
| October 5 (near the 3-day checkpoint) | ±1.47% | $66.68 – $68.66 |
| October 9 (target expiration) | ±2.82% | $65.76 – $69.58 |
| October 16 | ±4.14% | $64.87 – $70.47 |
| October 30 (~1 month) | ±6.31% | $63.40 – $71.94 |
The ladder widens smoothly with time, with no sudden step between rungs. That says the chain is not bracing for any single date-specific event inside this window.
Volatility
At-the-money IV is 22.94%. IV rank shows where today's IV sits versus the past year. At 45/100, today's level is cheaper than about 55% of the past year's readings, so it sits mid-range.
IV is a touch above its 30-day average of 22.57% but well below its 90-day average of 29.55%. The longer view is calmer than the summer was. Over 30 sessions IV is down 4.9%.
Term structure compares option prices across different expiration dates. The front-month read is unavailable today because Friday was an expiry day. Two-month IV is 24.09%, a little above spot IV, which is a normal, upward-sloping shape.
Movement has been slowing. Five-day realized volatility is running well below EEM's 20-day pace, an unusually sharp slowdown compared with this fund's own recent history. Broad-market fear is also subdued: the VIX sits near the low end of its one-year range.
Is premium rich or cheap? The volatility risk premium is the gap between how much movement options are priced for and how much EEM has actually delivered. When it is positive, option sellers have been collecting more than realized movement cost them. Right now options are priced only about 0.6 vol points above the 22.37% EEM has actually delivered over 20 days. That gap ranks at 57/100 against this fund's own recent readings, meaning it is richer than 57% of them and roughly middle of the road.
The gap shrank sharply on Friday, from about 2.2 points the day before. It also briefly turned negative on September 25, so the cushion for option sellers has been thin and twitchy. Together with IV rank 45, the picture is fairly priced premium: selling premium is workable but carries no special edge, and buying it is not a bargain either.
Skew and sentiment
Skew captures the fact that puts and calls the same distance from the stock price don't cost the same. When puts are pricier, traders are paying up for crash protection. Puts are running about 3.1 vol points over calls (24.4% vs. 21.4%), against a 60-day norm of 2.3 points for this fund. Protection has gotten more expensive, and that steepening is unusually pronounced for EEM.
The put/call ratio measures how much put activity there is relative to calls; above 1 means puts dominate. Friday's put/call volume ratio was 4.85, versus a 7-day average of 3.17 and a 14-day average of 2.41. That is an unusually put-heavy session even for this name, though total option volume was only about half its 20-day average.
Not all the flow pointed down. Since Thursday, net open interest grew on the call side (about +17,800 contracts) while put open interest shrank (about −39,400). That suggests some of the put volume was closing or rolling existing positions rather than opening new bearish ones.
By expiration, sentiment splits sharply:
- 0–7 days: strongly bullish (+57). Short-dated calls are bid unusually rich relative to puts, a front-end call chase.
- 7–30 days: bearish (−42). In this band, puts carry a fatter premium than usual.
Traders are chasing a quick bounce while hedging anything further out. That combination fits a range-bound read better than a trending one.
The key levels map
| Level | Price | Why it matters |
|---|---|---|
| 52-week high | $71.57 | Top of the year's range, 5.45% above the close |
| Swing resistance | $71.22 | Prior pivot cluster |
| Whole-chain call wall / gamma-flip estimate | $70.00 | Heaviest call OI across all expirations (125,371 contracts); one rough estimate also puts the gamma flip here |
| October 9 implied-range top | $69.58 | Upper 1-sigma edge |
| Swing resistance | $69.18 | Near the September 22 high of the six-week range |
| October 9 call wall | $68.50 | Biggest call pile for this expiration (1,268 contracts); the near-term ceiling |
| Large-gamma strike | $68.00 | Second-largest gamma concentration in the chain |
| Swing resistance | $67.97 | First overhead pivot |
| Close | $67.67 | Friday's close |
| 20-day moving average | $67.45 | Price is 0.33% above it |
| September 21 gap base | $67.03 | Prior close beneath the September 21 gap-up |
| October 9 max pain | $67.00 | Where the most option value would expire worthless; expirations sometimes gravitate toward it |
| 100-day moving average | $66.64 | Price is 1.55% above it |
| Swing support | $66.61 | Nearest structural floor |
| 50-day moving average | $66.41 | Held on the late-September dip |
| October 9 put wall | $66.00 | Biggest put pile for this expiration (867 contracts); the near-term floor |
| October 9 implied-range bottom | $65.76 | Lower 1-sigma edge |
| Swing support | $65.45 | Next pivot below the wall |
| Whole-chain put wall | $65.00 | Heaviest put OI across all expirations (130,005) and the single largest gamma strike |
| Swing support | $64.44 | Deeper structural floor |
| 200-day moving average | $62.99 | Long-term trend line, 7.42% below |
Positioning and unusual flow
Market makers hedge the options they've sold. In a positive-gamma regime, their hedging tends to dampen moves: they sell into rallies and buy into dips. Under its stated assumptions, one rough estimate puts both the whole chain and the October 9 expiration on its own in positive territory. That supports a pin around the $66–$68.50 corridor.
The gamma flip level is the price below which market-maker hedging tends to accelerate selling rather than cushion it. The same rough estimate places that level at $70, above spot, and spot is sitting somewhat closer to it than usual for EEM. The two estimates don't fully agree, so treat the cushion as soft rather than firm.
Three flow items stand out, none of them expired:
- October 16 $64 puts: 10,100 contracts traded, about $212,100 in premium, against 14,149 already open. This is a large, cheap, out-of-the-money hedge one week past the target expiration.
- December 18 $64.50 puts: 4,414 contracts traded against just 82 open, roughly $770,000 in premium. This is the day's biggest money flow, and it is longer-dated protection rather than a near-term bet.
- November 20 $73 calls: +2,796 contracts of new open interest. Someone is keeping cheap upside exposure in place even while the shorter dates hedge.
Into Friday's expiration, the October 2 $68.50 calls shed 363 contracts of open interest. That is settled history now, and it lined up with that expiration's $67 max pain.
3 · Technical check
Both chart-model reports lean bullish, and both targets sit inside the options range, so the classification is Mixed. The magnitude is consistent with what options price, but the chart takes a directional side the options data does not.
- The 3-day model (to October 6) targets $67.95, with a projected range of $66.55–$69.25. That is wider than the October 5 options rung of $66.68–$68.66.
- The 6-day model (to October 9) targets $68.05, with a projected range of $65.95–$69.10, well inside the $65.76–$69.58 implied range.
The most decisive reads are fresh bullish crossovers in the short and medium moving averages and in MACD on October 2. Against them, money-flow is flat near zero, so volume isn't confirming the bounce. The model's dominant scenario is invalidated on a close below $67.20, and it flags $67.81 and $68.90 as resistance.
Model vs. Market: The options market implies $65.76–$69.58 into October 9; the 6-day technical model targets $68.05. That target sits just under the $68.50 call wall, so even the chart's bullish case is a drift toward the ceiling rather than a break through it. A daily close above $68.50 would be the first sign the chart is seeing something the options aren't.
The TA nudged strike selection only on the upside. The bullish debit spread below is capped at $68.50 so that the chart target sits just inside its profit zone, and the condor's short call stays at the wall rather than closer in.
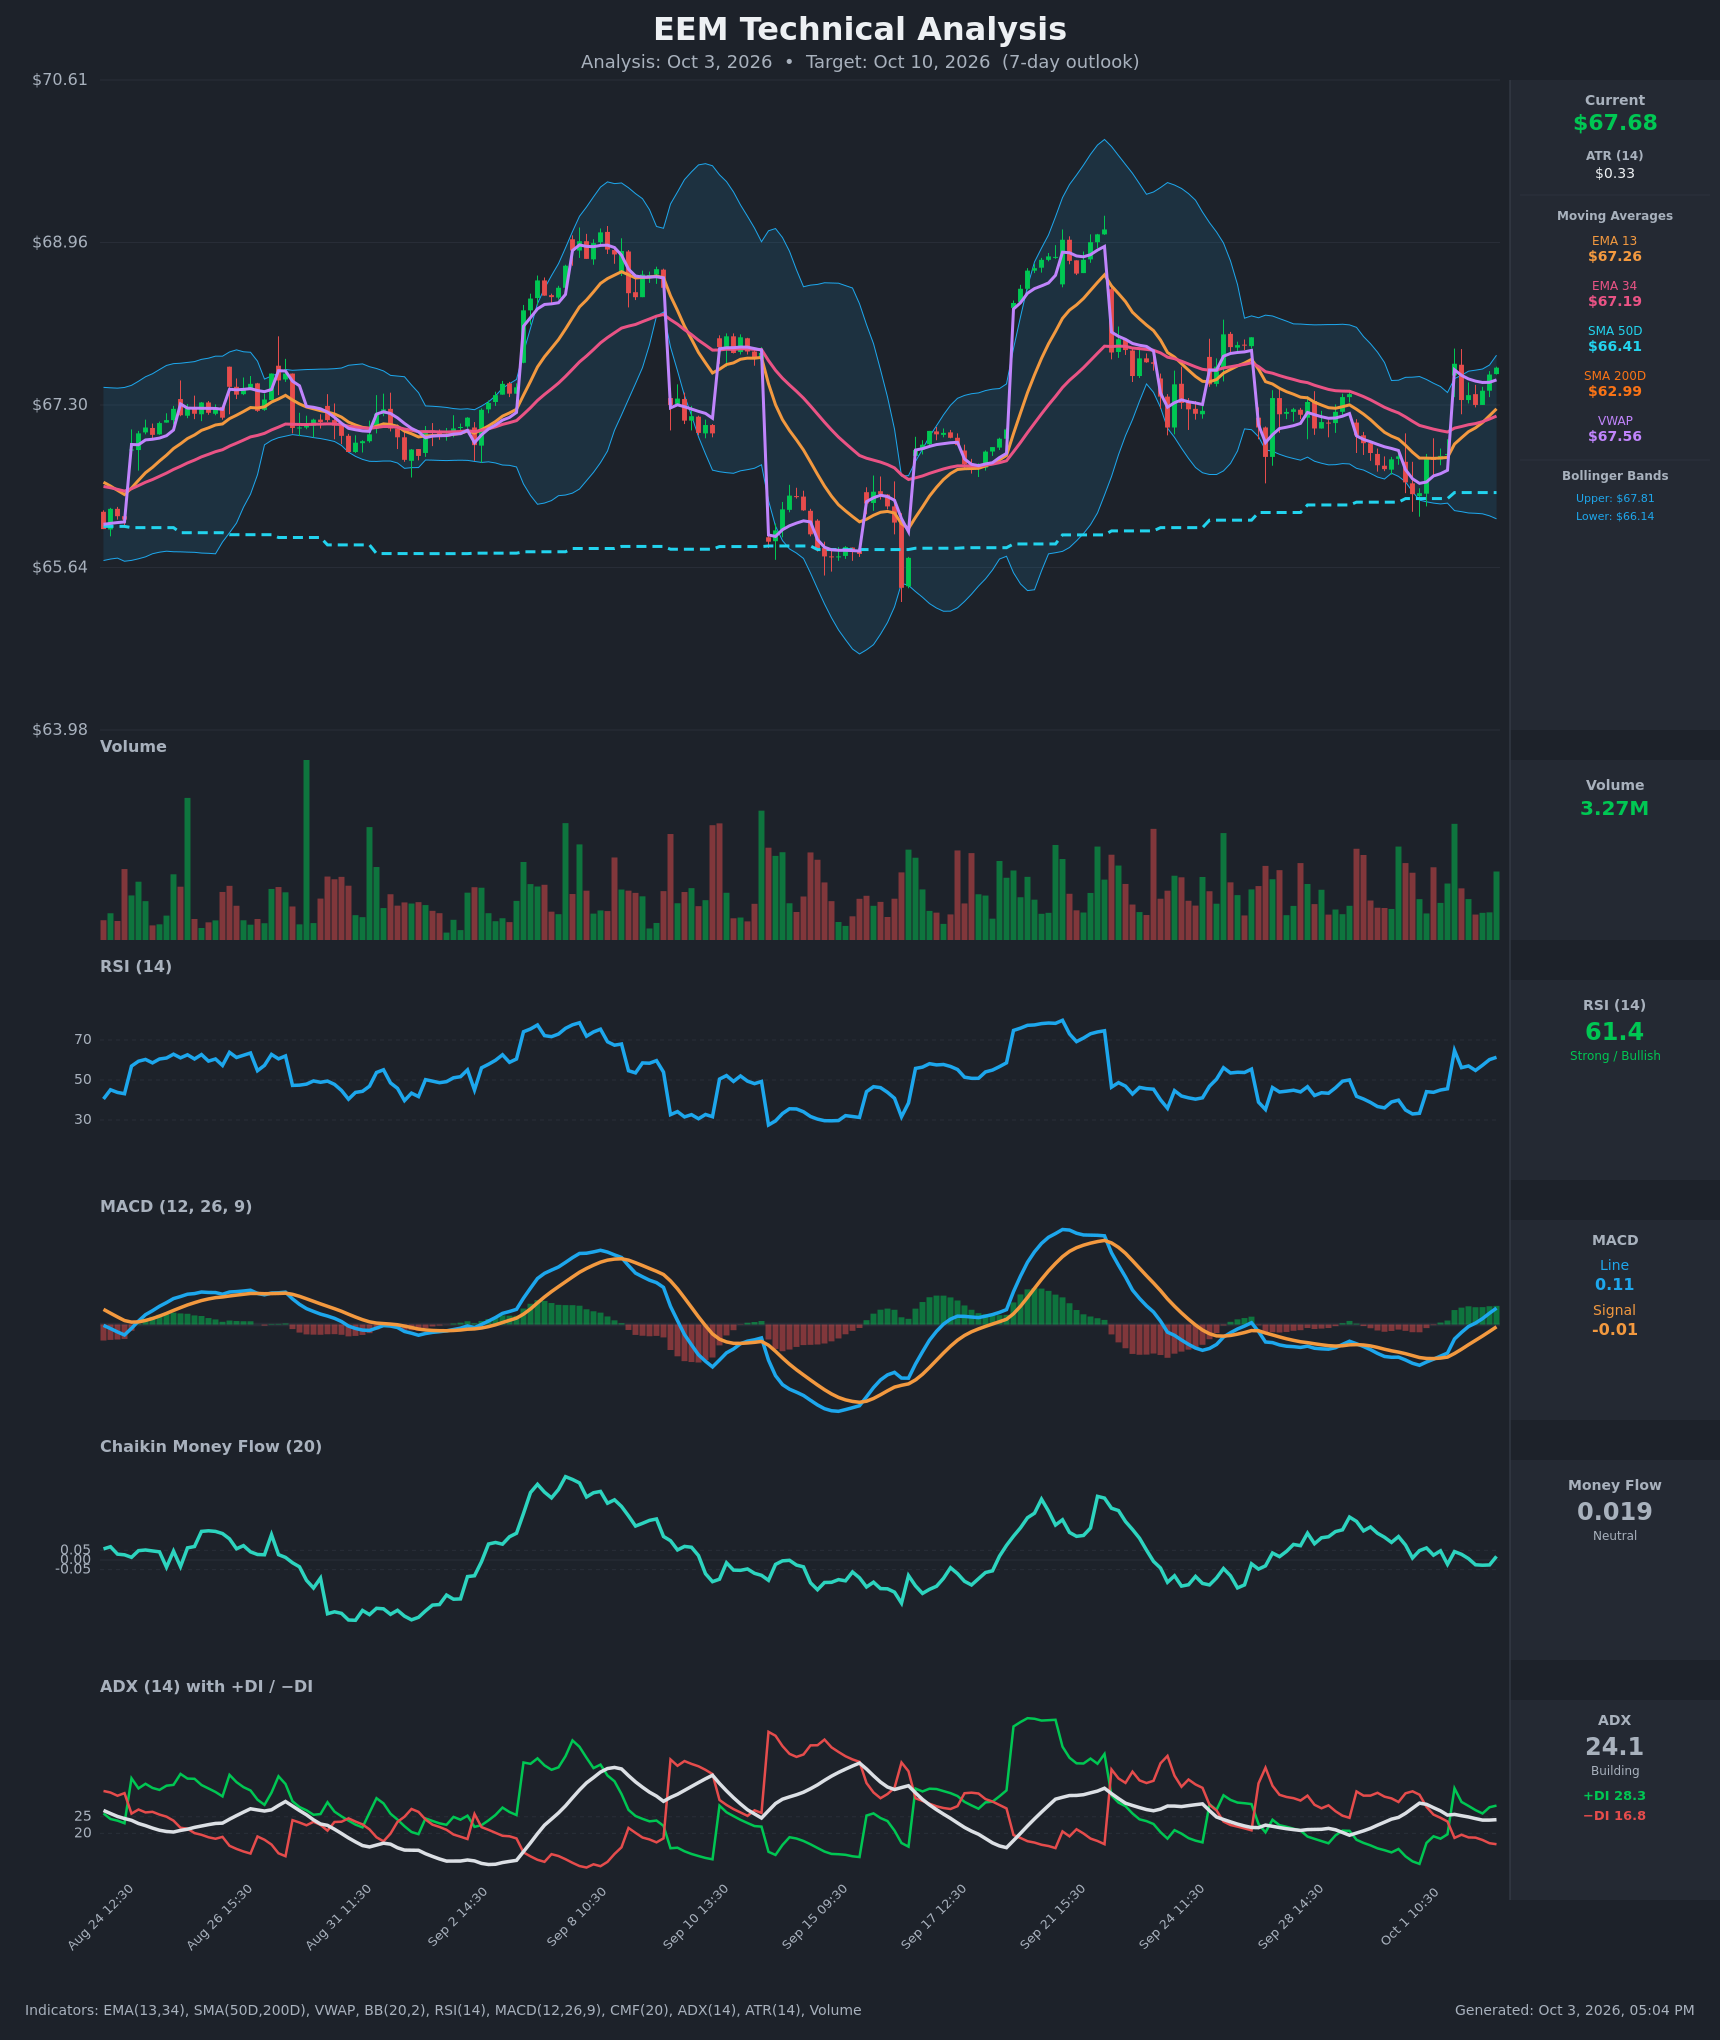
Full technical write-ups: 3-day report → · 6-day report →
4 · Three ways the next six days can go
If EEM pushes above the call wall ($68.50): The heaviest call OI for October 9 sits right there, and in a positive-gamma setting dealer hedging tends to lean against rallies into that strike. A clean break clears thinner positioning up to the $69.18 swing high and the $69.58 range edge. The whole-chain $70 call wall is the next major pile above that.
If EEM drifts between the walls: This is the base case positioning supports. With the expiration's floor at $66, its ceiling at $68.50, max pain at $67 and an estimated dampening hedge regime, expiring OI tends to pull price toward the middle of the corridor into October 9. Note the shrinking short-term realized volatility: the fund has already been moving less than usual.
If EEM breaks below the put wall ($66.00): Losing $66 removes the expiration's floor and puts the $65.76 range edge and the $65 whole-chain put wall in play. Spot already sits below the ~$70 gamma-flip estimate. One rough estimate suggests that below the flip, market-maker hedging can amplify selling rather than cushion it, so a break could travel faster than the quiet tape implies.
5 · Three defined-risk structures
Prices are end-of-day midpoints as of October 2, 2026. All structures are hypothetical. Verify live prices before trading; these will be stale by the open.
If you lean bullish: October 9 $67.50/$68.50 bull call spread
- Trade: Buy the October 9 $67.50 call (mid $0.815), sell the October 9 $68.50 call (mid $0.415). A debit spread: you pay up front and profit if EEM rises toward the short strike.
- Debit: $0.40 ($40 per spread) · Max profit: $0.60 ($60) · Max loss: $0.40 ($40) · Break-even: $67.90
- Why it fits: The 6-day chart target of $68.05 sits inside the profit zone, and the short strike sits exactly on the call wall, where rallies tend to stall. You are not paying for upside the positioning says is hard to reach.
- Makes sense only if: EEM holds the $67.20–$67.45 area (the moving-average cluster) early in the week.
- Invalidated if: EEM closes below $67.00.
- Managing it: With the trend reads flat at every horizon, take profits early. Close at about 60–70% of max value if EEM tags $68.50 before October 9, and exit by October 8 regardless rather than holding into expiration-day pin risk.
- Liquidity note: The $68.50 calls quoted 7¢ wide ($0.38/$0.45), but the $67.50 calls were 23¢ wide ($0.70/$0.93). Use limit orders near mid; slippage on the long leg is the main cost.
- Analyze this position →
If you expect the range to hold: October 9 $65/$66 – $68.50/$69.50 iron condor (best fit)
- Trade: Sell the October 9 $66 put (mid $0.225), buy the $65 put (mid $0.14), sell the $68.50 call (mid $0.415), buy the $69.50 call (mid $0.155). A credit structure: you collect premium up front and keep it if EEM stays between the short strikes.
- Credit: $0.345 ($34.50 per condor) · Max profit: $34.50 · Max loss: $0.655 ($65.50) · Break-evens: $65.66 and $68.85
- Why it fits: The short strikes sit on the October 9 put and call walls, max pain at $67 is centered inside them, and the estimated gamma regime favors dampened moves. With premium only fairly priced, defined risk and wall-anchored strikes are what make this worth doing.
- Makes sense only if: EEM stays between $66 and $68.50 through the October 6 checkpoint.
- Invalidated if: EEM closes below $66.00, or above $68.50 on the call side.
- Managing it: Close at about 50% of max credit. If either short strike is breached on a closing basis, close the condor rather than hope for a reversal. Exit by October 8 to avoid expiration-day assignment noise.
- Liquidity note: The $66 puts quoted 5¢ wide ($0.20/$0.25), the $65 puts 8¢ ($0.10/$0.18), the $68.50 calls 7¢ and the $69.50 calls 7¢ ($0.12/$0.19). Those are tight in cents but large relative to the small credits, so leg-by-leg fills can eat a meaningful share of the premium. Work the full order as one ticket at mid.
- Analyze this position →
If you lean bearish: October 9 $67/$66 bear put spread
- Trade: Buy the October 9 $67 put (mid $0.455), sell the October 9 $66 put (mid $0.225). A debit spread that profits if EEM slips toward the put wall.
- Debit: $0.23 ($23 per spread) · Max profit: $0.77 ($77) · Max loss: $0.23 ($23) · Break-even: $66.77
- Why it fits: Put skew is stretched and 7–30 day sentiment is bearish. The spread targets a slide to max pain and the put wall at a better than 3-to-1 payoff, without paying for the richer downside wings.
- Makes sense only if: The October 2 gap-up fails and EEM closes back below the $67.20 moving-average cluster.
- Invalidated if: EEM closes above $68.50.
- Managing it: Take profits near $66 rather than waiting for expiration, since the put wall tends to slow declines. Exit by October 8 regardless.
- Liquidity note: The $67 puts quoted 11¢ wide ($0.40/$0.51) and the $66 puts 5¢ wide. Fills near mid are realistic with patience.
- Analyze this position →
If none of these: no trade
Standing aside is a reasonable choice here. IV rank 45 and a 0.6-point premium over delivered movement mean option sellers aren't being paid generously, so the condor's $34.50 credit leaves little room for slippage. Meanwhile, the flat trend reads and the split between short-dated call chasing and longer-dated hedging give neither debit spread a real directional edge.
If you can't monitor the position daily, or the round-trip spread costs on these small premiums bother you, waiting for a cleaner signal is legitimate. A close outside $66–$68.50 or a meaningful jump in IV would both qualify.
6 · Quick FAQ
What is EEM's expected move into October 9? About ±$1.91 (±2.82%), for a range of $65.76–$69.58, based on straddle pricing as of the October 2 close.
Is EEM expected to go up or down over the next six days? Options positioning as of October 2 reads neutral. Heavy put buying looks like hedging an intact uptrend, while short-dated calls are bid. That is a read of what traders have done, not a forecast. The actionable map is the $65.76–$69.58 range and the $66 / $68.50 walls.
Are EEM options expensive right now? IV rank 45/100 says option prices are higher than about 45% of the past year's readings. On top of that, they're running only about 0.6 vol points above the movement EEM has actually delivered, richer than 57% of this fund's own recent readings. In short, premium is fair, not rich.
Where is EEM's biggest options support and resistance? For the October 9 expiration, the put wall is $66.00 and the call wall is $68.50, with max pain at $67.00. Across the whole chain, the heaviest piles sit at $65 (puts) and $70 (calls).
What invalidates this read? A close below $66.00.
Methodology & disclosures. Data: end-of-day options-chain snapshot for EEM, 2026-10-02, generated 2026-10-03T17:04:39.150Z. Prices shown are midpoints and will differ from live markets. Momentum/positioning scores and volatility-premium comparisons are descriptive measurements of past option flow and past price movement — not investment advice, signals, forecasts, or guarantees. All trade structures are hypothetical. Every structure shown has a defined maximum loss; you can lose the entire max-loss amount. Options involve substantial risk and are not suitable for all investors.