EEM Options Are Pricing a $2.12 Move Into Friday — Our Read and the Charts Disagree
The options market implies a $65.72–$69.96 range for EEM into the September 18 expiration, with volatility premium richer than 86% of this ETF's own recent readings. Here's what the positioning says, where the technical models push back, and three defined-risk ways to trade it.

The options market implies a $65.72–$69.96 range into the September 18 expiration; here's what is driving it and three defined-risk ways to trade it.
Published Sunday, September 13, 2026 · Data as of Friday, September 11 close
Explore the live EEM options data in the Detailed Options Analyzer →
Quick answer
| Item | Answer |
|---|---|
| Market bias | Slightly bullish (neutral-bullish) |
| Spot (Sep 11 close) | $67.84 |
| Options-implied range (into Sep 18) | $65.72 – $69.96 (±$2.12, ±3.12%) |
| Major support (Sep 18 put wall) | $66.00 |
| Major resistance (structural — the Sep 18 call wall sits below spot at $66.00) | $68.64 |
| Max pain (Sep 18) | $65.00 |
| Dealer gamma regime (estimate) | Positive — hedging tends to dampen moves; flip level ≈ $67.00 |
| Volatility condition | Cooling off the week's spike — IV rank 43/100 · premium rich: options priced ~2.7 vol points above delivered movement |
| Technical check | Diverges (bearish, 3-day and 5-day models) |
| Best-fitting strategy | Sep 18 $66/$65 put credit spread, conditional on $66 holding |
| Analysis invalidated if | EEM closes below $66.00 |
1 · What matters today
EEM closed Friday, September 11 at $67.84 after a one-day gap lower on September 10 was bought back almost immediately. The options market is pricing a move of about $2.12 in either direction through Friday, September 18 — that's the move implied by what straddles cost at that expiration, or roughly 3.1% of the share price. Our read of the flow leans slightly bullish: call-side open interest built hard on Friday (calls +80,232 contracts against puts −66,074), short-dated sentiment is positive, and the premium traders pay for downside protection is flatter than this ETF's own norm.
The unusual wrinkle this week is that the heaviest open interest for the September 18 expiration sits below the price, at $66.00 on both the call and the put side, with max pain down at $65.00 — the whole options corridor is anchored under spot. Meanwhile both technical models we ran lean bearish toward $67.55–$67.60. The level that settles it: a close below $66.00 kills this read.
2 · What the options market is pricing
What changed this week
Price did very little and positioning did a lot. EEM is up just 0.55% over the last five sessions and 1.75% over twenty, closing Friday at $67.84 after a −1.62% opening gap on September 10 that was recovered within a session. Implied volatility — the market's estimate of how much EEM will move, baked into option prices — sits at 22.4% at the money, down 3.8% on the day but up 13.6% over five sessions, and still 10% below its own 30-day average of 25.0%.
Put activity spiked on the final session: put volume ran 1.50 times call volume, against a 7-day average of 0.79 and a 14-day average of 1.20 — easily the most put-tilted day of the fortnight. But open interest tells the opposite story. Put open interest relative to calls has thinned from 1.06 to 0.94 over five sessions (for every 100 calls held open there are now 94 puts), and Friday's net build was decisively call-side: call open interest across the chain grew by 80,232 contracts while put open interest shed 66,074. That one-day net build is unusually large compared against this ETF's own recent history. Among still-live near-dated contracts, the September 18 $69 calls shed 2,908 contracts of open interest while the September 18 $67 calls added 2,509 and the $67 puts added 1,953 — traders rolling exposure down toward the money rather than chasing upside. Into Friday's own settled expiration, the $67.50 puts traded 1,031 contracts and expired worthless.
The multi-horizon trend read is flat and internally consistent: price is +0.5% over roughly a week, +1.7% over a month and +2.1% over two and a half months, with the momentum reads neutral at every one of those lookbacks. There is no trend to fight here, and no trend to lean on either.
Expected move
Into the September 18 expiration, the options market is pricing a move of ±$2.12 (±3.12%) around Friday's $67.84 close — a range of $65.72 to $69.96. Here is how that scales across the ladder:
| Expiration | Implied move | Range around $67.84 |
|---|---|---|
| Sep 14 (3 days) | ±1.28% | $66.97 – $68.71 |
| Sep 16 (5 days) | ±2.48% | $66.16 – $69.52 |
| Sep 18 (7 days) | ±3.12% | $65.72 – $69.96 |
| Oct 16 (35 days) | ±6.93% | $63.14 – $72.54 |
The jump between the rungs is steeper than time alone explains: the Monday September 14 contracts price at-the-money volatility of just 14.1%, while the September 18 contracts price 22.5%. That is a thin, lightly traded Monday expiration being marked cheap rather than a statement about the week — anchor your math on the September 18 rung, which is where the open interest actually lives.
Volatility
At-the-money implied volatility is 22.4%, with an IV rank of 43/100 — where today's IV sits versus the past year, meaning option prices are cheaper than 57% of the past year's readings. The percentile read is similar at 49. IV slipped 3.8% on the day, but is up 13.6% over five sessions and down 28.5% over thirty; it sits below both the 30-day average (25.0%) and well below the 90-day average (30.2%). The front-month read is unavailable today — Friday was an expiry day, so there is no clean near-tenor ATM print to compare against the 60-day tenor. The broad volatility backdrop is quiet: VIX is at 13.5/100 on its own 52-week rank, and it has tracked EEM's implied volatility with a 0.63 correlation over the past 60 sessions.
Two "vs its own norm" readings are worth flagging — meaning unusual for EEM specifically, not versus the broader market. Realized volatility over the past 20 days is 19.7%, unusually depressed for this ETF. But the ratio of 5-day to 20-day realized movement is 1.26, well above its own norm: the last week has been noticeably jumpier than the month that preceded it. The September 10 gap and Friday's recovery are exactly that acceleration.
Premium rich or cheap. The volatility risk premium — the gap between how much movement options are priced for and how much EEM has actually delivered — is running about 2.7 vol points positive. When that gap is positive, option sellers have been collecting more than realized movement cost them. Today's reading sits at the 86th percentile against this ETF's own recent readings, meaning richer than 86% of them. The path over the past two weeks is one-directional: the gap flipped from negative on August 27, widened to roughly 4.1 vol points around September 8–10 as the gap-down spiked implied volatility, and has cooled back to 2.7 as price stabilized. That combination — a middling IV rank of 43 but an 86th-percentile premium over delivered movement — favors collecting premium this week rather than owning it, and it is why the credit structures lead the trade section below.
Skew and sentiment
Puts and calls the same distance from the price do not cost the same: the 25-delta put is marked at 23.2% implied volatility against 21.6% for the 25-delta call, so puts run about 1.6 vol points over calls. Traders are still paying up for crash protection — but by less than usual. This ETF's own 60-day median for that gap is 2.9 vol points, so downside protection is roughly 1.3 points cheaper than normal, and the gap has flattened by about 1.5 points over the last five sessions. Flat skew is complacency, not conviction, and it is one of the four inputs pushing our bias to the bullish side of neutral.
Sentiment in short-dated options is positive across the near part of the curve and negative at the back: the 0–7 day bucket reads +31, the 7–30 day bucket +26, the 30–60 day bucket +23, and the 60–120 day bucket −21. The overall regime label is Mixed — the buckets disagree, with the disagreement cleanly split between near-dated optimism and longer-dated hedging. On a 7-day average the near buckets sit at +19 each, so Friday's readings are a modest firming rather than a one-day spike.
The key levels map
| Level | Price | Why it matters |
|---|---|---|
| 52-week high | $71.57 | 5.2% overhead; EEM sits at the 81st percentile of its 52-week range |
| Top of implied range (Sep 18) | $69.96 | Upper rail of the move options are pricing this week |
| Call OI shelf | $69.00 | 27,374 contracts open at the Sep 18 $69 call; 42,846 chain-wide — rallies tend to slow into piles like this |
| Swing resistance | $68.64 | Nearest price-structure resistance; the technical models mark $68.55 alongside it |
| Largest gamma strike | $68.00 | Second-heaviest total gamma across the chain; 44,354 Sep 18 calls open here |
| Spot | $67.84 | Friday's close |
| Swing support | $67.65 | Nearest structural support; the 3-day model targets just below it |
| 20-day moving average | $67.18 | Price sits 0.98% above it |
| Gamma flip level (estimate) | ≈$67.00 | One rough estimate suggests that below this price, market-maker hedging stops cushioning and starts accelerating moves |
| Swing support | $66.19 | Second structural shelf |
| Sep 18 call wall AND put wall | $66.00 | 75,114 calls and 62,659 puts open at the same strike — the expiration's entire center of gravity, sitting $1.84 below spot |
| 50-day moving average | $65.86 | Price is 3.01% above it; the intermediate uptrend is intact |
| Bottom of implied range (Sep 18) | $65.72 | Lower rail of the move options are pricing |
| Max pain (Sep 18) | $65.00 | Where the most option value would expire worthless; also the whole chain's heaviest call strike (98,158) and put strike (79,603) |
| 200-day moving average | $62.03 | 9.36% below price — the long-term structure is not in question |
Note the disagreement worth naming: the September 18 expiration's own call and put walls both sit at $66.00, while the whole chain's heaviest call and put open interest sits one strike lower at $65.00. Both readings point the same direction — the gravity in this chain is below the current price, not above it.
Positioning and unusual flow
The dealer gamma estimate is positive both chain-wide and for the September 18 expiration specifically, which means market makers hedge the options they've sold in a way that tends to dampen moves rather than amplify them. Treat that as an estimate built on an assumed dealer sign convention, not observed inventory. The flip level — below which the same rough estimate says hedging starts accelerating selling rather than cushioning it — sits at roughly $67.00, only $0.84 under Friday's close. That is uncomfortably close.
Three flow items stand out, none of them expired:
- Sep 18 $65 calls: 10,008 contracts traded against 61,403 open, moving roughly $3.0 million of premium — by far the day's largest dollar print. Deep in-the-money call volume at the chain's heaviest strike usually means rolling and closing, not fresh direction.
- Sep 25 $64.5 puts: 8,000 contracts traded against just 51 open — turnover of about 157× the existing position, roughly $184,000 of premium. That is a genuinely new downside hedge being laid on below the expected-move floor.
- Sep 18 $65 puts: 15,513 contracts on 60,287 open, about $209,000 of premium, with the puts marked at a $0.135 mid. Cheap tail insurance being topped up into expiration.
3 · Technical check (the 20%)
Both technical models we ran come back bearish, which makes this a divergence rather than a confirmation. The 3-day model (target date September 16) projects $67.55 with a range of $66.60 to $68.60. The 5-day model (target date September 18, matching our expiration) projects $67.60 with a range of $66.30 to $69.00 and marks support at $66.90, resistance at $68.55. Both reports were generated September 13 against a reference price of $67.83 — a penny off the options snapshot's $67.84, which is normal vendor timing, not a data error.
The reasoning behind both is the same pair of reads: Chaikin Money Flow at −0.080 has kept deteriorating even as price recovered off the September 10 low, and the directional movement indicators still have the bearish line above the bullish one (26.1 vs 22.0) on a modestly rising ADX of 24.6. Against that, the MACD histogram has been narrowing since the September 10 bottom and price sits well above both the 50-day ($65.86) and 200-day ($62.03) averages. The 5-day model's dominant scenario — a 40% pullback case toward $66.90–$67.00 — is explicitly invalidated by a strong close back above $68.20.
Crucially, both technical targets sit comfortably inside the options-implied range. This is a disagreement about direction, not about magnitude: the charts want a $0.25 drift lower, the options corridor allows two dollars in either direction. That gap resolves the moment EEM either takes out $68.20–$68.64 on a closing basis or loses $67.00. Practically, the divergence did one thing to the structures below: it kept the short call strikes on the high side of the expected move rather than shading them down toward the technical target, and it argues for taking profits early rather than holding credit spreads to expiration.
Model vs. Market: The options market implies $65.72–$69.96 into September 18; the 5-day technical model targets $67.60 with a $66.30–$69.00 range, and the 3-day model targets $67.55 against the September 16 expiration's implied $66.16–$69.52. The chart models are asking for less movement and slightly lower prices than the options are paying for — which is the same thing the volatility premium is saying from the other side.
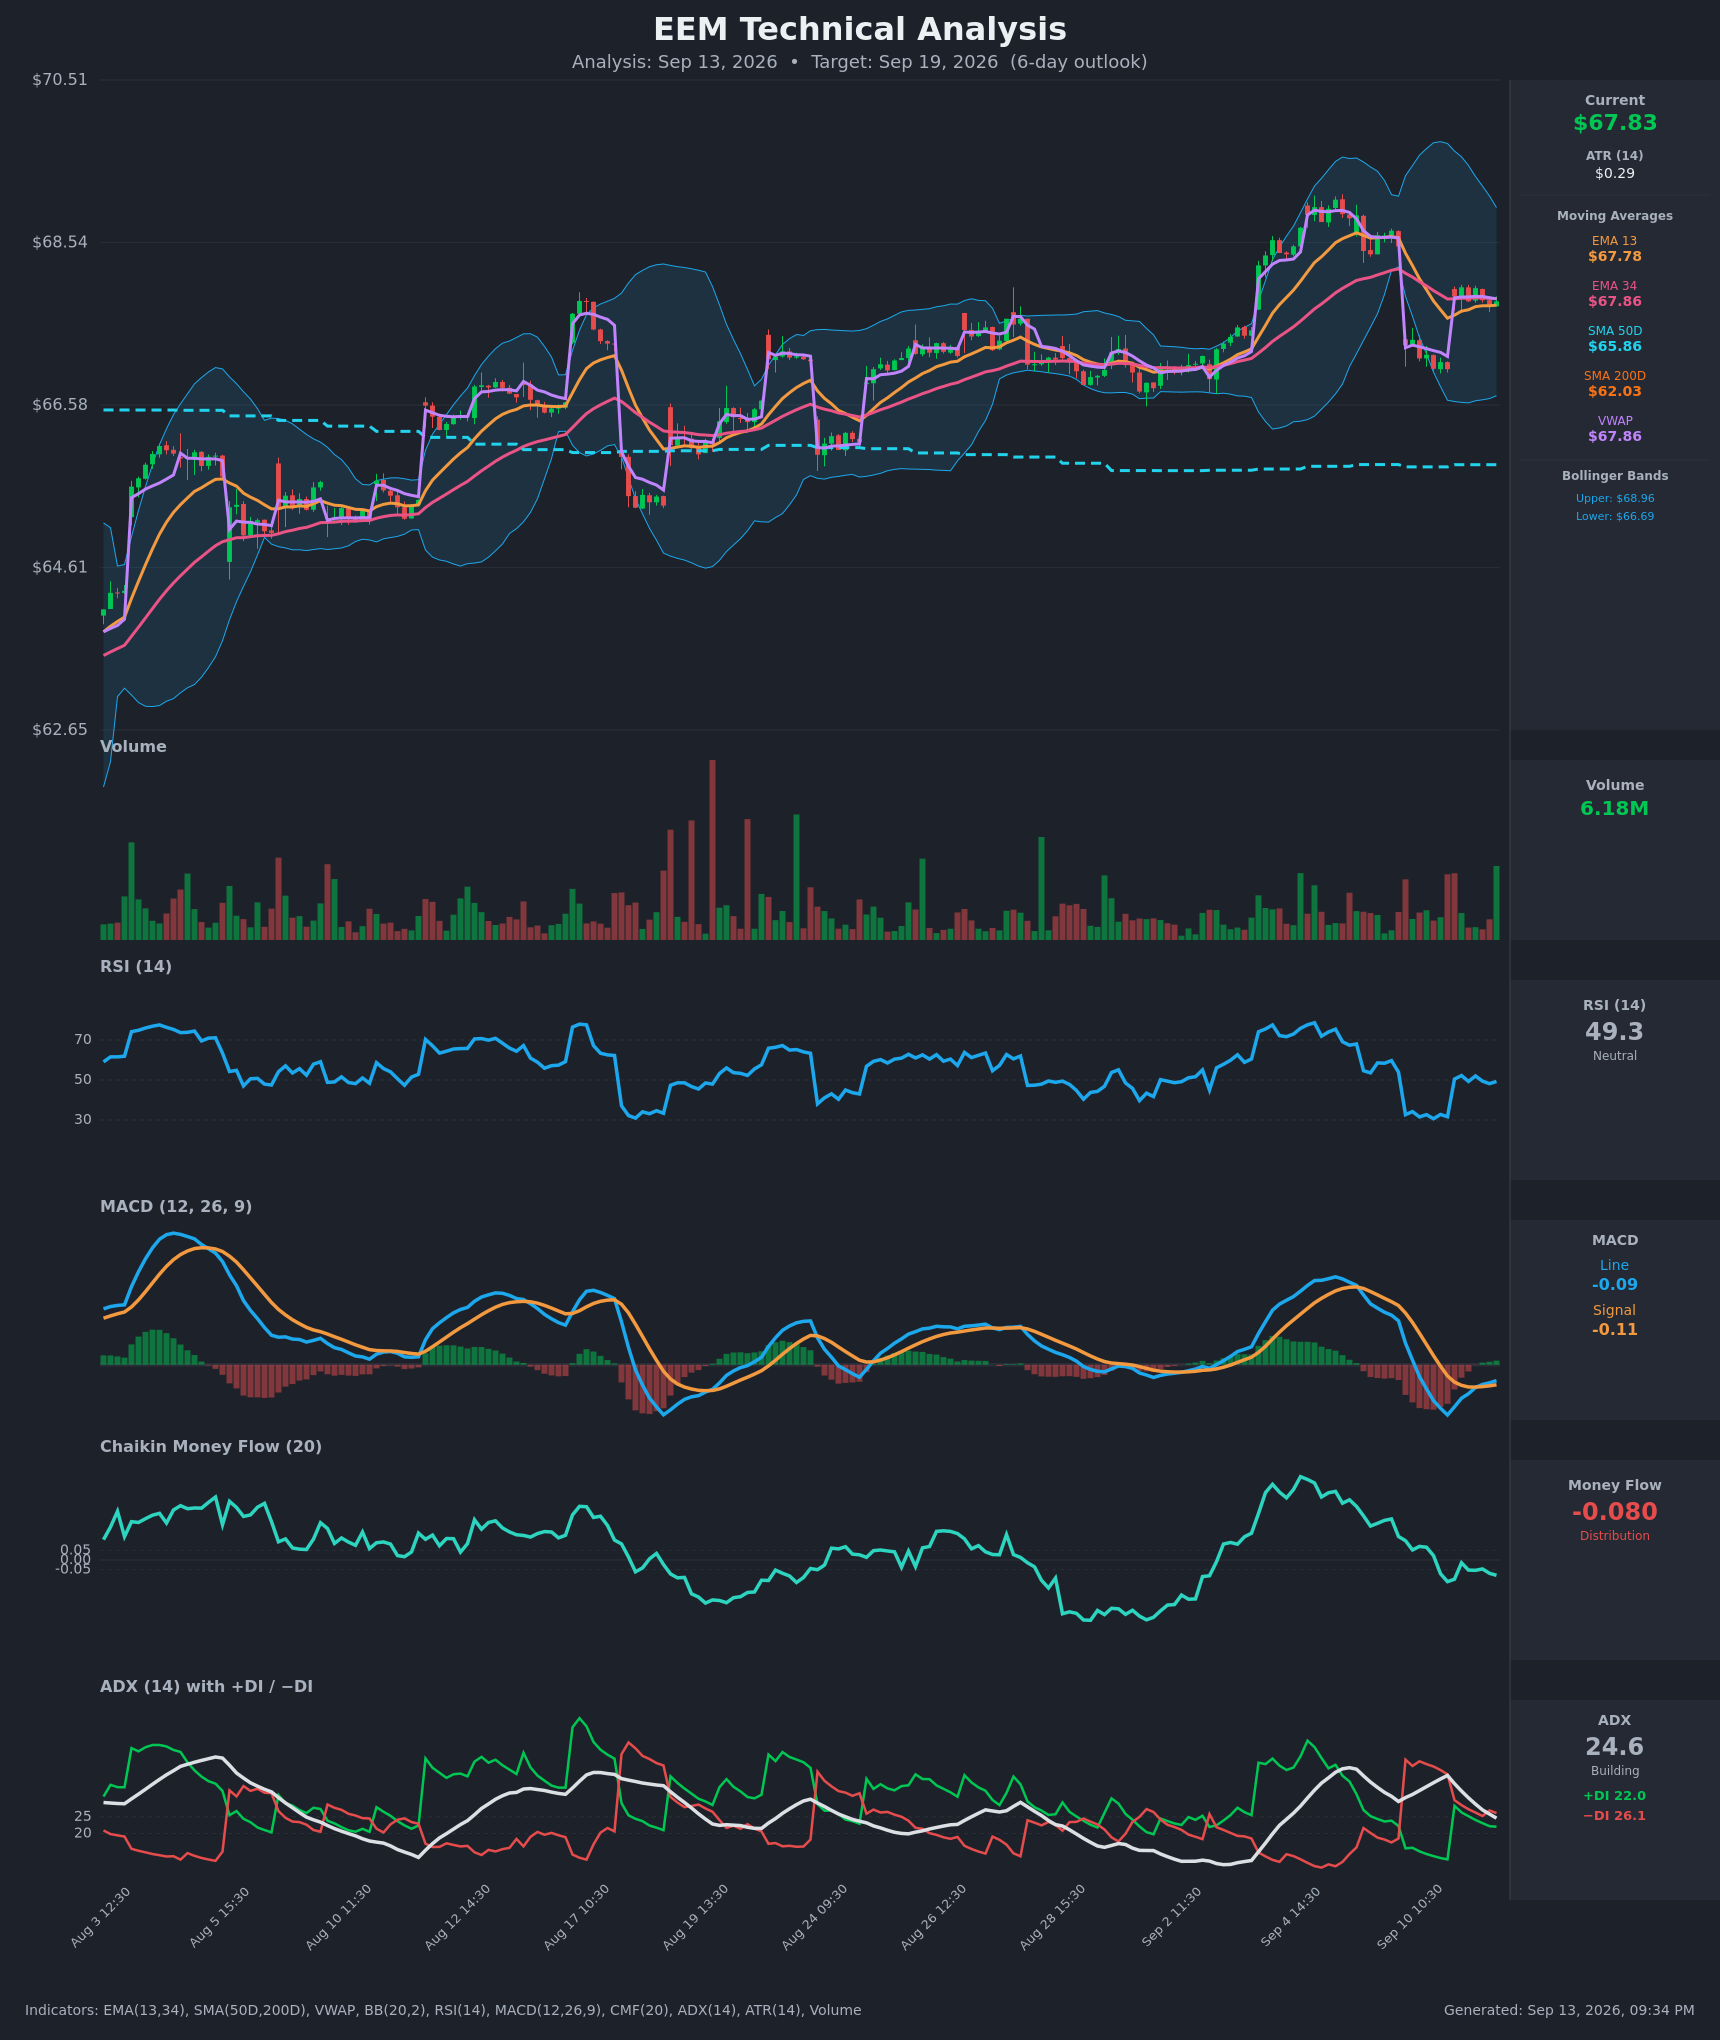
Full technical write-ups: 3-day report → · 5-day report →
4 · Three ways the next five days can go
If EEM pushes above $68.64: the next real obstacle is the call open interest shelf at $69.00 (27,374 contracts open at that strike for September 18, 42,846 chain-wide) and then $70.00. Heavy call open interest overhead tends to slow rallies as the dealers hedging it sell into strength; a clean close through $68.64 would also invalidate the dominant technical scenario and leave the implied ceiling at $69.96 as the week's realistic stretch target.
If EEM drifts between $66.00 and $68.64: this is the base case that the positioning supports. The estimated dealer gamma regime for the September 18 expiration is positive, which tends to compress rather than extend daily ranges, and the expiration's entire wall structure sits at $66.00 with max pain at $65.00 — a gentle downward tug into Friday. Expirations sometimes gravitate toward max pain, but with that level $2.84 below spot, the more realistic version of this branch is a slow bleed toward the $67 area rather than a trip to $65.
If EEM breaks below $67.00: that is the gamma flip estimate, and below it one rough estimate suggests market-maker hedging amplifies selling rather than cushioning it. Under that sits $66.19 swing support and then the $66.00 double wall, where 62,659 open puts and 75,114 open calls both reside. Losing $66.00 on a closing basis is where this article's read stops being valid, and the September 25 $64.5 put buyer from Friday is positioned for exactly that.
5 · Three defined-risk structures
Prices are end-of-day midpoints as of September 11, 2026. All structures are hypothetical. Verify live prices before trading — these will be stale by the open.
If you lean bullish: Sep 18 $66/$65 put credit spread
- Trade: Sell the September 18 $66 put, buy the September 18 $65 put. You collect a credit up front and keep it if EEM stays above $66 at expiration.
- Credit: $0.135 · Max profit: $13.50 per one-lot · Max loss: $86.50 · Break-even: $65.87
- Why it fits: The short strike sits exactly on the expiration's put wall ($66.00, 62,659 contracts open) and the long strike sits on max pain ($65.00). The premium being sold is rich by this ETF's own standards — about 2.7 vol points above delivered movement, richer than 86% of its recent readings — and the short $66 put carries a delta of just −0.20, roughly $1.84 below the close.
- Makes sense only if: you accept a small credit against a much larger defined loss in exchange for a high-probability outcome, and you believe the $66 wall holds.
- Invalidated if: EEM closes below $66.00.
- Managing it: close at roughly 50% of max credit (about $0.07); exit regardless on Wednesday, September 16 if EEM has closed below $67.00 — that is the gamma flip estimate, and the short-term trend reads are flat enough that there is nothing to ride. If EEM closes through $66.00, close rather than hope.
- Liquidity note: the $66 puts quoted $0.24/$0.30 (6¢ wide) and the $65 puts $0.12/$0.15 (3¢ wide) on 15,513 contracts traded. Absolute spreads are small but large as a percentage of a cheap option — use limit orders and expect to give up a cent or two.
- Analyze this position →
If you expect the range to hold: Sep 18 $65/$66/$69/$70 iron condor
- Trade: Sell the $66 put / buy the $65 put and sell the $69 call / buy the $70 call, all September 18. You collect a credit and keep all of it if EEM finishes between $66 and $69.
- Credit: $0.35 · Max profit: $35 per one-lot · Max loss: $65 · Break-evens: $65.65 and $69.35
- Why it fits: The short strikes bracket the positioning map rather than the price: $66 is the expiration's wall on both sides, $69 is the first meaningful call shelf overhead. Both break-evens sit inside the ±$2.12 implied move, and the estimated positive dealer gamma regime for this expiration is the condition that historically keeps ranges compressed. The premium being sold is at the 86th percentile of its own recent richness.
- Makes sense only if: you expect chop, which is precisely what the flat multi-horizon trend read and the technical models' third scenario both describe.
- Invalidated if: EEM closes below $66.00 or above $68.64 — the second is a warning, not a stop, but it is where the untested side starts costing money.
- Managing it: close the whole structure at about 50% of credit ($0.18); roll or close the tested side rather than defending both. Take profits early rather than holding into Friday morning — with the short-term and longer-term trend reads both flat, there is no trend premium to wait for.
- Liquidity note: the $69 calls quoted $0.35/$0.42 (7¢ wide) on 1,592 contracts; the $70 calls are the weak leg at $0.13/$0.21 — 8¢ wide on a 17¢ mid. That single leg can eat a meaningful slice of the credit, so work the call spread as a unit.
- Analyze this position →
If you lean bearish: Sep 18 $68.50/$69.50 call credit spread
- Trade: Sell the September 18 $68.50 call, buy the September 18 $69.50 call. You collect a credit and keep it if EEM finishes below $68.50.
- Credit: $0.305 · Max profit: $30.50 per one-lot · Max loss: $69.50 · Break-even: $68.81
- Why it fits: This is the structure that expresses the technical divergence without buying expensive premium. Both chart models target $67.55–$67.60 and mark resistance at $68.55; the short strike sits just under that at $68.50, with the break-even at $68.81 — comfortably below the $69.96 implied ceiling. Selling rather than buying respects the rich volatility premium.
- Makes sense only if: you weight the money-flow and directional-indicator evidence above the call-side open interest build, and you accept that this fights the options positioning read.
- Invalidated if: EEM closes above $68.64.
- Managing it: close at roughly 50% of credit (about $0.15); the short strike is only $0.66 above the close with a delta near 0.39, so this is the most gamma-sensitive of the three — do not hold it into Friday morning if EEM is trading above $68.
- Liquidity note: the $68.50 calls quoted $0.51/$0.58 (7¢ wide) on 2,045 contracts traded; the $69.50 calls quoted $0.20/$0.28 (8¢ wide on a 24¢ mid). Leg risk is real here — trade it as a spread.
- Analyze this position →
If none of these: no trade
Premium is genuinely rich here — an 86th-percentile gap over delivered movement with no scheduled catalyst distorting it — so standing aside has to clear a real bar. Two things clear it. First, the risk-to-reward on a one-dollar-wide credit spread in a $67 ETF is brutal in absolute terms: the bullish structure risks $86.50 to collect $13.50, which means a single bad week erases six good ones, and position sizing is doing more work than the edge is. Second, the September 18 corridor is structurally odd: the call wall and put wall are the same strike, sitting $1.84 below the price, with max pain nearly three dollars below. That is a chain with no clear pin above spot and a gentle downward tug into expiration, at the same time as two independent technical models lean lower and our own positioning read leans higher. When the premium is rich but the map is contradictory, the honest answer is a smaller position or none at all.
6 · Quick FAQ
What is EEM's expected move this week? ±$2.12 (±3.12%) into the September 18 expiration — a $65.72 to $69.96 range — per the options market's straddle pricing as of the September 11 close.
Is EEM expected to go up or down over the next five days? Options positioning as of September 11 leans slightly bullish — call open interest built by more than 80,000 contracts on the day, and downside protection is 1.3 vol points cheaper than this ETF's own norm — but that is a read of what traders have already done, not a forecast. Both technical models point modestly lower, toward $67.55–$67.60. The actionable map is the $65.72–$69.96 range and the $66.00 / $68.64 levels.
Are EEM options expensive right now? Two lenses. IV rank of 43/100 says option prices are lower than 57% of the past year's readings. But they are running about 2.7 vol points above the movement EEM has actually delivered over the past 20 days — richer than 86% of this ETF's own recent readings. The verdict: not expensive versus history, but expensive versus reality, which favors selling premium over buying it.
Where is EEM's biggest options support and resistance? For the September 18 expiration, both the put wall and the call wall sit at $66.00 (62,659 puts and 75,114 calls open) — an unusual case where the same strike anchors both sides, below the current price. Overhead, the first real obstacle is structural resistance at $68.64, with a call open-interest shelf at $69.00.
What invalidates this week's read? A close below $66.00.
Methodology & disclosures. Data: end-of-day options-chain snapshot for EEM, 2026-09-11, generated 2026-09-13 21:34 UTC. Prices shown are midpoints and will differ from live markets. Momentum/positioning scores and volatility-premium comparisons are descriptive measurements of past option flow and past price movement — not investment advice, signals, forecasts, or guarantees. All trade structures are hypothetical. Every structure shown has a defined maximum loss; you can lose the entire max-loss amount. Options involve substantial risk and are not suitable for all investors.