F Options Are Pricing a ±$0.63 Move Into Friday — The Chart Model Sees $13.78
Ford's options market is pricing a $13.36–$14.62 range into the September 18 expiration, with max pain sitting right on top of the stock at $14.00. Here's what the positioning data actually says, where the walls are, and three defined-risk ways to trade a cheap-premium week.

The options market implies a $13.36–$14.62 range into the September 18 expiration; here's what's driving it and three defined-risk ways to trade it.
Published Sunday, September 13, 2026 · Data as of Friday, September 11 close
Explore the live F options data in the Detailed Options Analyzer →
Quick answer
| Item | Answer |
|---|---|
| Market bias | Neutral |
| Spot (chain snapshot) | $13.99 |
| Options-implied range (into September 18) | $13.36 – $14.62 (±4.48%, or ±$0.63) |
| Major support | $12.00 (September 18 put wall) |
| Major resistance | $15.00 (September 18 call wall) |
| Max pain (September 18) | $14.00 |
| Dealer gamma regime (estimate) | Positive — hedging tends to dampen moves; flip level ≈ $7.67 (estimate, far below spot) |
| Volatility condition | Neutral-to-easing — IV rank 34.6/100 · premium thin: options priced about 8.5 vol points below the movement F has actually delivered |
| Technical check | Mixed (bearish, 2-day and 4-day chart models, both targeting inside the implied range) |
| Best-fitting strategy | Long call butterfly centered on $14.00 (conditional on the pin holding) |
| Analysis invalidated if | F closes below $13.36 |
1 · What matters today
Ford closed Friday, September 11 at $13.97, and the options market is priced for very little to change over the next four days. The September 18 contracts imply a move of about $0.63 up or down — the move the options market is pricing in, derived from what straddles cost — putting the band at $13.36 to $14.62. Max pain for that expiration, the price where the most option value would expire worthless, sits at $14.00, one cent above the snapshot price. Our five-input read of flow, skew and positioning lands squarely neutral: front-week sentiment is call-tilted while longer-dated flow leans the other way, and price momentum over the past five sessions is negative. The one number that changes the picture is $13.36 — a close beneath the bottom of that implied band says the market underpriced this week. Both chart models lean mildly bearish but target prices inside the same band.
2 · What the options market is pricing
What changed this week
The shares did the work, not the volatility. F is down 2.78% over the trailing five sessions but still up 0.58% over twenty — a sharp early-September dip and a partial recovery that left price almost exactly where it started the month. At-the-money implied volatility (the market's estimate of how much F will move, baked into option prices) finished at 31.9%, down 6.25% on the day and up just 2.13% over five sessions; it sits essentially on its own 30-day average of 31.8% and well beneath its 90-day average of 37.9%. Positioning drifted defensive: put open interest relative to call open interest went from 0.89 to 0.99 over five sessions, meaning there are now almost exactly as many puts held open as calls, against a 14-day average of 0.89. Put volume ran at 0.77 contracts per call on Friday — heavier than the 0.62 fourteen-day average, though close to the 0.76 seven-day figure. Among still-live contracts, the biggest open-interest changes were closures: the October 16 $18 calls shed 1,083 contracts and the September 18 $16 puts shed 996, while the November 20 $14 puts added 554 and the September 18 $14.50 calls added 487. (Into Friday's now-settled expiry, the $14 calls added 3,508 contracts of open interest — settled history, not a live level.)
The multi-horizon read is worth one sentence: the short-term trend measure is bearish on the back of that 2.8% five-day slide, while the 20-day and 50-day reads are flat (+0.6% and +2.5% in price). Near-term flow is pointing down into a bigger picture that has gone nowhere — which argues for short-dated structures and quick profit-taking rather than anything that needs weeks to work.
Expected move
Into September 18, the chain prices a 1σ move of ±4.48%, or about $0.63 around the $13.99 snapshot price — $13.36 on the downside, $14.62 on the upside. Here is the ladder of live expirations:
| Expiration | Implied move | Range around $13.99 |
|---|---|---|
| September 18 (7 DTE) | ±4.48% | $13.36 – $14.62 |
| September 25 (14 DTE) | ±6.05% | $13.14 – $14.84 |
| October 2 (21 DTE) | ±7.68% | $12.92 – $15.06 |
| October 16 (35 DTE) | ±10.31% | $12.55 – $15.43 |
The rungs scale almost exactly with the square root of time — 32.3% at-the-money IV on the front rung versus 33.3% five weeks out — so there is no event hump anywhere in the near ladder. Nothing in the chain is being priced as a step-change.
Volatility
At-the-money IV of 31.9% carries an IV rank of 34.6/100 — where today's IV sits versus the past year, meaning option prices are cheaper than roughly 65% of the past year's readings — with an IV percentile of 40.9. The front-month read is unavailable in Friday's snapshot (it was an expiry day, so front-month IV can't be interpolated from a same-day-expiring contract), which also means no clean term-structure comparison today. Two observations stand out versus this stock's own recent history: 20-day realized volatility of 40.4% is running well above F's recent norm, and the ratio of 5-day to 20-day realized movement is 1.32 — movement has been accelerating relative to its own month. Neither of those says anything about direction; they say the stock has been moving more than usual.
Premium rich or cheap. The volatility risk premium — the gap between how much movement options are priced for and how much F has actually delivered — is negative 8.5 vol points: 31.9% implied against 40.4% delivered over the past twenty sessions. That reading sits at the 31st percentile of this stock's own recent history, meaning premium is thinner than roughly seven in ten of its recent readings. When the gap is positive, option sellers have been collecting more than realized movement cost them; right now it is the reverse. That combination — an IV rank of 34.6 and a 31st-percentile premium versus delivered movement — favors owning premium this week rather than collecting it. The gap has also widened steadily over the past week, from about −3.0 vol points on September 8 to −8.5 on Friday, as the early-September shock move fed into the realized-volatility window while implied volatility drifted back down. With no earnings until late October, that reading isn't distorted by a scheduled event.
Skew and sentiment
Skew — the fact that puts and calls the same distance from the stock price don't cost the same — is unusual here. The 25-delta put trades at 31.8% implied volatility against 32.1% for the 25-delta call, so puts are actually running 0.3 vol points cheaper than calls. Nobody is paying up for crash protection in Ford. But the norm for this name is a 0.9-point gap in the same direction, so relative put demand has firmed by about six tenths of a point versus its own 60-day median — a mild steepening, not a panic. Volume tells the same story with a defensive tint: 28,908 put contracts against 37,566 calls (a 0.77 ratio versus a 0.62 fourteen-day average), with total option volume at 0.88× its 20-day norm — a quiet session, slightly put-tilted for this name.
Sentiment across the curve is genuinely split, which is why the headline bias is neutral rather than tilted. Short-dated options (0–7 days) read firmly call-side at +41 on our scale, driven by call open interest building 4,600 contracts against puts falling 62. The 7–30 day bucket is dead flat at 0, the 30–60 day bucket at −1, and the 60–120 day bucket is the most bearish reading in the file at −38, where put-side flow dominates delta-weighted volume. The overall regime label: Mixed. Traders are positioned for a benign front week and are buying protection further out.
The key levels map
| Level | Price | Why it matters |
|---|---|---|
| Swing resistance | $15.48 | Heuristic swing-pivot cluster above the call wall |
| Call wall (September 18) | $15.00 | 48,711 calls held open — the heaviest call strike for the week; the whole chain's heaviest call strike is also $15.00 (80,301 contracts), so the two agree |
| Swing resistance | $14.94 | Heuristic level from recent pivots |
| Top of implied range | $14.62 | The upper 1σ rail into September 18 |
| Swing resistance | $14.56 | Early-September high zone |
| Swing resistance | $14.18 | First overhead pivot — the nearest real friction |
| 50-day moving average / chart-model resistance | $14.11 | Price is 0.96% below it; the 4-day chart report names it as resistance |
| 20-day moving average | $14.06 | Price is 0.61% below it |
| Max pain + largest gamma strike | $14.00 | September 18 max pain; the single biggest gamma pile in the chain (26,463 calls and 27,863 puts open for this week alone) |
| Spot / close | $13.99 / $13.97 | Chain-snapshot price and official close; the 100-day average sits at $13.97 |
| Swing support | $13.74 | First support from recent pivot clustering |
| Chart-model support (4-day) | $13.65 | Named support in the 4-day technical report |
| Bottom of implied range | $13.36 | The lower 1σ rail — and this article's kill switch |
| Swing support | $13.22 | Next pivot below the implied band |
| Whole-chain put wall | $13.00 | 68,784 puts open across all expirations; 26,393 of them expire September 18 |
| 200-day moving average | $13.52 | Price is 3.32% above it — the longer-term structure is still intact |
| Put wall (September 18) | $12.00 | 45,499 puts held open for this week — note this differs from the whole chain's $13.00 put wall, so the week's own heaviest put pile sits two dollars below spot |
| Gamma flip estimate | ≈ $7.67 | One rough estimate of where hedging flips from dampening to amplifying — spot sits about 45% above it, i.e. nowhere near it |
Positioning and unusual flow
One rough estimate of dealer positioning has the September 18 expiration in a positive gamma regime — market makers hedge the options they've sold, and in this regime their hedging tends to dampen moves rather than amplify them. That is the same regime the whole chain shows, and with spot sitting a dollar cent from max pain at $14.00 and the biggest gamma pile in the book at that exact strike, the mechanical bias into Friday is toward stickiness. Treat it as an estimate built on an assumed dealer sign convention, not observed inventory.
Three live flow items worth naming. First, the September 18 $14 calls traded 6,936 contracts against 26,463 open — about $166,000 of premium, the heaviest dollar flow in the week's expiration, and open interest barely moved (+189), so this looks like turnover at the pin strike rather than new conviction. Second, the December 18 $13 puts traded 6,328 contracts for roughly $402,000 of premium — the largest single dollar-premium print anywhere in the chain, with open interest essentially unchanged at 14,514. Someone is working a downside hedge three months out, not this week. Third, the October 30 $11.50 puts printed 1,329 contracts against zero prior open interest — a brand-new far-out-of-the-money position worth about $9,300, small in dollars but the kind of lottery-ticket protection that shows up when traders want cheap tail cover.
3 · Technical check (the 20%)
Both chart reports lean bearish, and both land inside the options-implied band — which makes this a mixed read rather than a clean divergence. The 2-day model targets $13.92 with a projected range of $13.82 to $14.05, describing a stock glued to its short-term moving averages with a fresh MACD crossover to the downside but an ADX of 14.1 — a weak, range-bound trend where sellers nominally hold control but can't press it. Its dominant scenario is invalidated by a sustained close above $14.05.
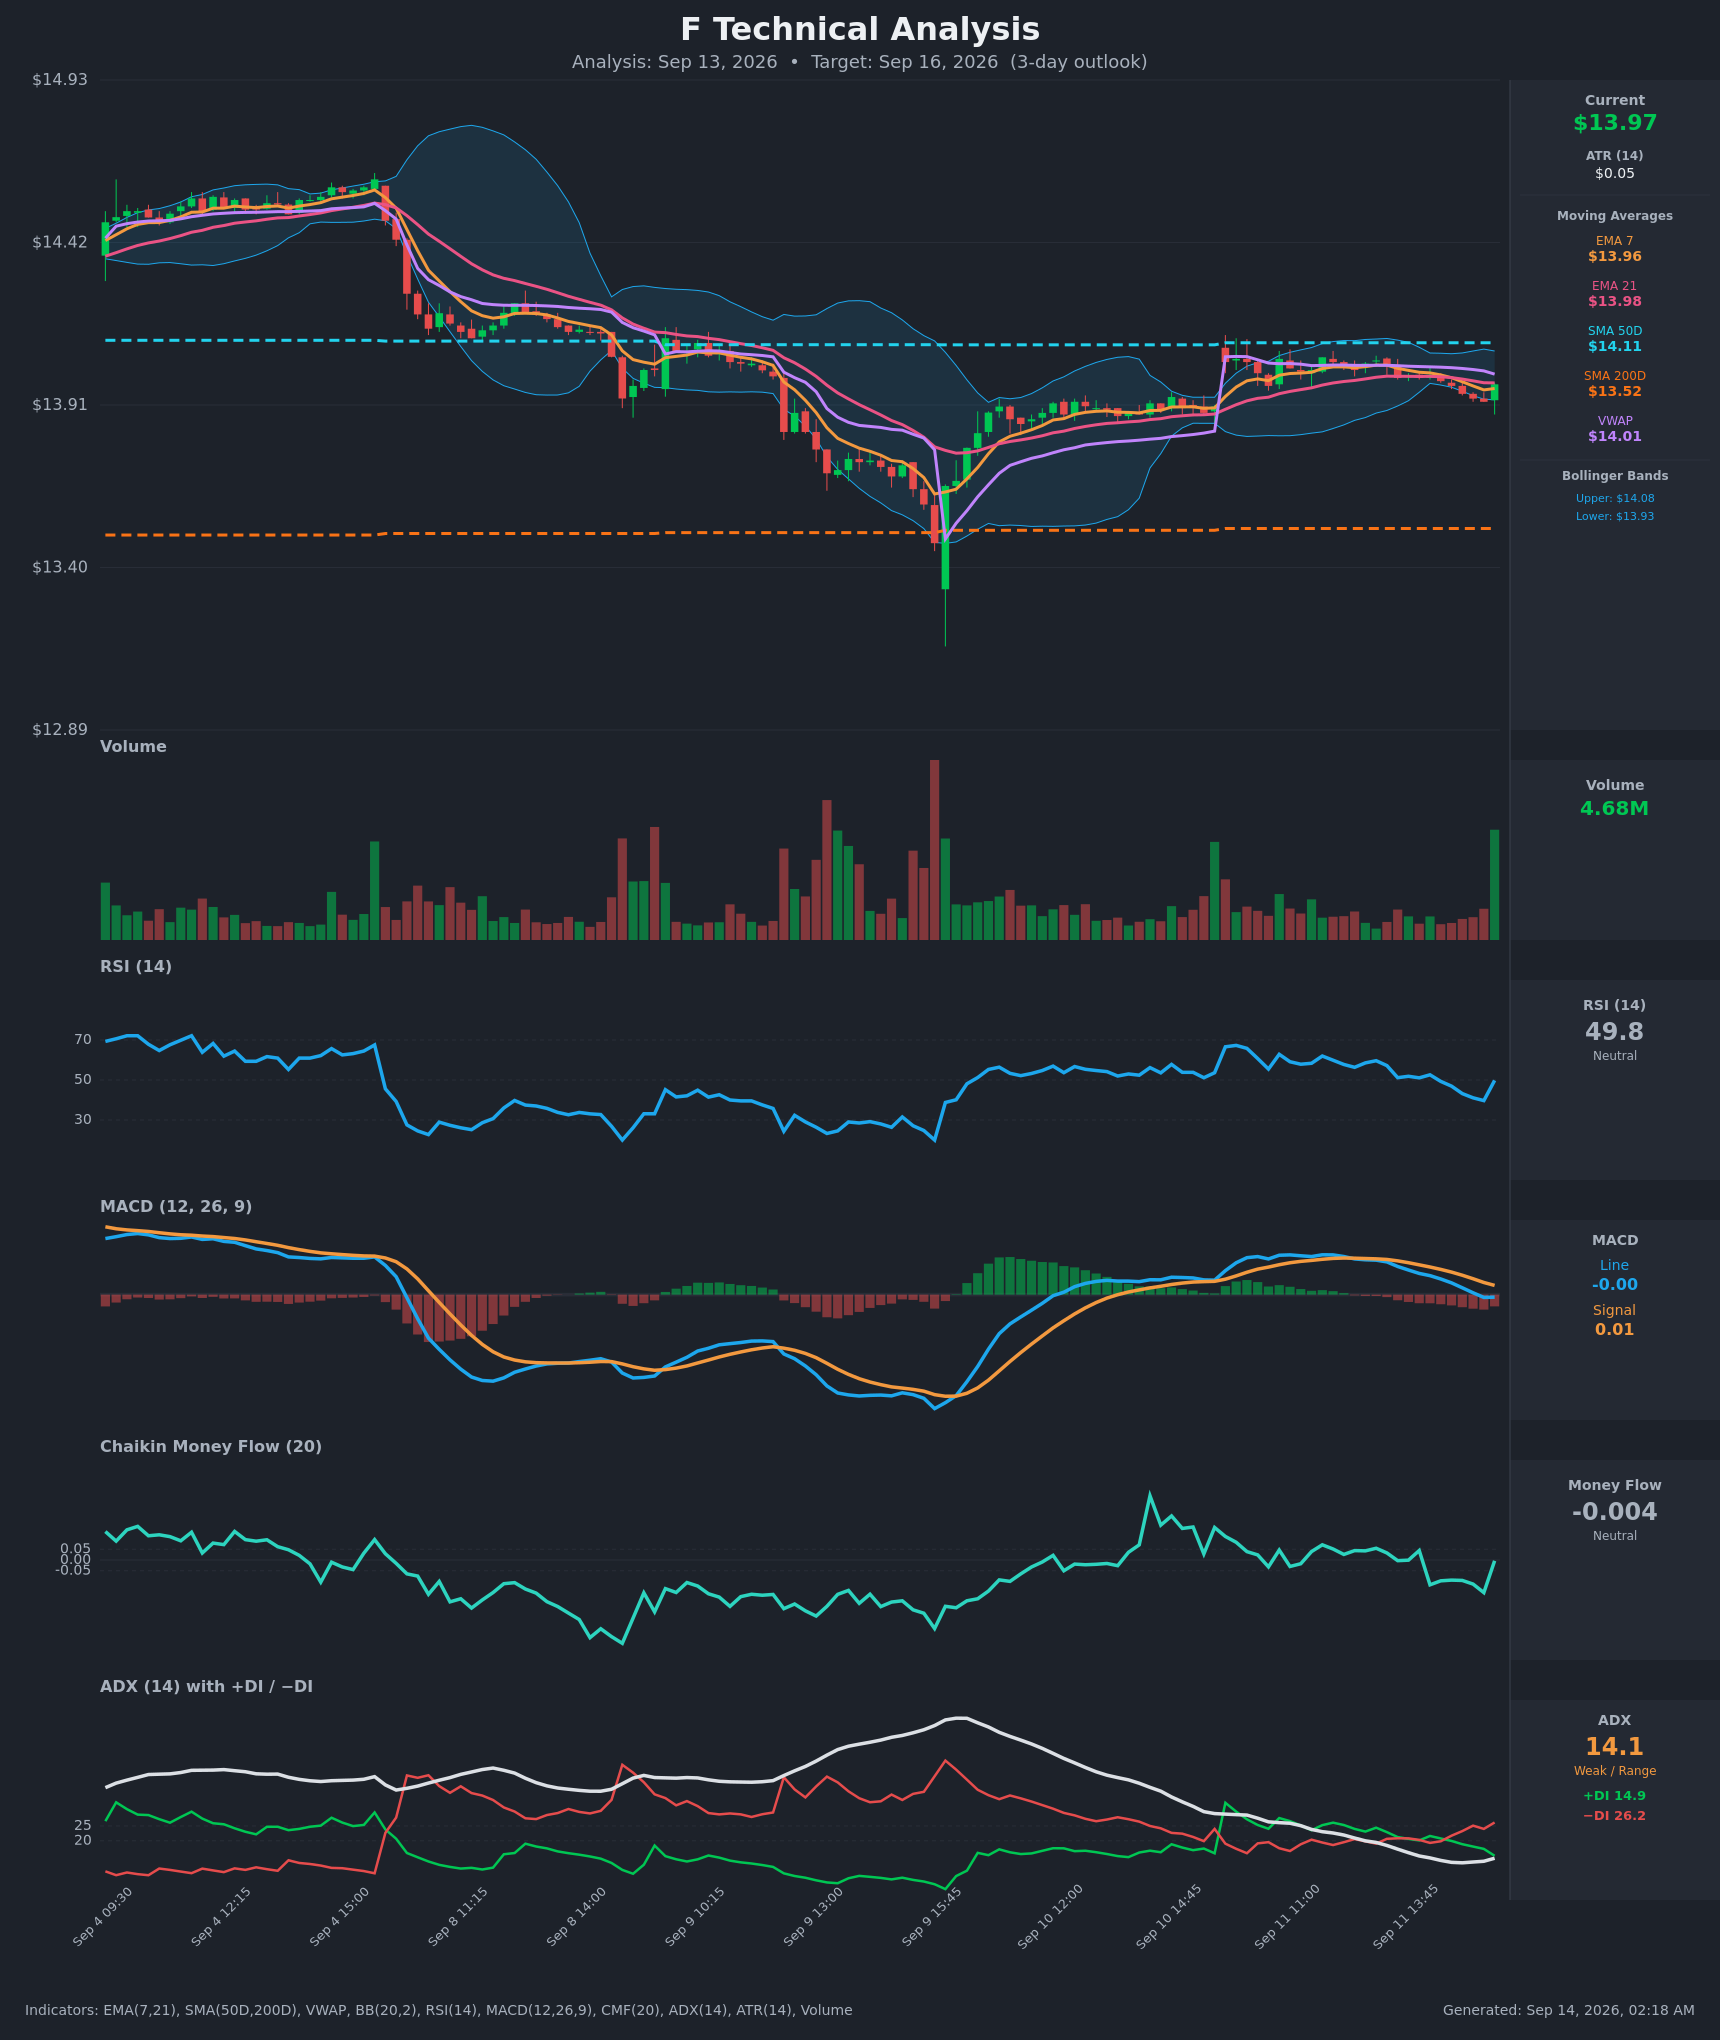
The 4-day model is the more assertive of the two: target $13.78, projected range $13.55 to $14.25, support at $13.65 and resistance at $14.11. Its most decisive reads are an ADX of 41.3 with the negative directional line well above the positive one, and a Chaikin Money Flow of −0.153 that stayed negative right through the bounce off the September 9 low — flow never confirmed the recovery. That scenario is invalidated on a sustained close above $14.15.
Model vs. Market: The options market implies $13.36–$14.62 into September 18; the 4-day technical model targets $13.78 inside it, with its own projected range of $13.55–$14.25. The chart is bearish but modestly so — it is asking for roughly a third of the move the options are priced for, which is another way of saying both lenses expect a quiet, slightly heavy week.
The practical effect on the structures below: it shades the short call strike down rather than up, and it is the reason the bearish idea is built as a debit spread into the $13.82 area instead of a wider swing.
Full technical write-ups: 2-day report → · 4-day report →
4 · Three ways the next four days can go
If F pushes above the call wall ($15.00): that would require a 7% move in four days — more than double what the options are pricing. The 48,711 calls held open at $15.00 for this expiration are the heaviest overhead pile in the week and tend to slow rallies as hedging flows meet them; the friction starts well before that, at $14.18 and the 50-day average at $14.11.
If F drifts between the walls: this is the mechanically favored path and the one the positioning describes. Spot at $13.99 sits a penny below max pain at $14.00, the biggest gamma concentration in the chain is at that same strike, and one rough estimate has dealer hedging in a move-dampening regime for this expiration. Expiring open interest and hedging flows both tug toward $14.00 into Friday.
If F breaks below the implied band ($13.36): the week's own put wall is far below at $12.00, so there is no heavy expiring put pile to catch price between $13.36 and $12.00 — the swing supports at $13.22 and the whole-chain $13.00 put strike are the next structural markers. The gamma flip estimate sits around $7.67, so this is not a regime-change scenario; it is simply a move into thinner positioning, and the negative money-flow reading in the 4-day chart report is the argument that it can happen.
5 · Three defined-risk structures
Prices are end-of-day midpoints as of 2026-09-11. All structures are hypothetical. Verify live prices before trading — these will be stale by the open.
Premium is thin here, so the debit structures lead. All three expire September 18, more than five weeks before the October 26 earnings report, so none of them carries earnings-gap risk.
If you expect the range to hold: long $13.50/$14.00/$14.50 call butterfly
- Trade: Buy one September 18 $13.50 call, sell two September 18 $14.00 calls, buy one September 18 $14.50 call. (A debit structure: you pay up front and want price to finish near the middle strike.)
- Debit: $0.15 · Max profit: $35 per butterfly (at $14.00 on expiry) · Max loss: $15 · Break-evens: $13.65 and $14.35
- Why it fits: Max pain for this expiration is $14.00, the largest gamma pile in the entire chain is at $14.00, and spot is one cent below it. With premium running about 8.5 vol points below delivered movement, paying $0.15 to own a structure that peaks at the pin beats collecting thin credit for the same view.
- Makes sense only if: you believe the dampening-hedging estimate and expect a quiet drift into Friday rather than a directional resolution.
- Invalidated if: F closes below $13.65 or above $14.35 — outside the break-evens, this is dead money.
- Managing it: Butterflies pay late. Take profit at roughly 2× the debit if price parks on $14.00 by Wednesday, September 16; otherwise let it run to Friday's expiry and accept the defined loss. Don't add to it.
- Liquidity note: The $13.50 calls trade 4¢ wide ($0.54/$0.58) and the $14.00 calls 2¢ wide ($0.23/$0.25) on $166,000 of premium traded. The $14.50 wing is 2¢ wide but that's about 29% of its 7¢ mark — leg into it patiently or accept the slippage on a four-leg fill.
- Analyze this position →
If you lean bullish: $14.00/$14.50 call debit spread
- Trade: Buy September 18 $14.00 call, sell September 18 $14.50 call.
- Debit: $0.17 · Max profit: $33 · Max loss: $17 · Break-even: $14.17
- Why it fits: Short-dated sentiment is the most call-tilted reading in the file (+41 in the 0–7 day bucket, driven by 4,600 contracts of new call open interest), 25-delta calls are actually priced above puts, and the premium you're paying is thin versus what the stock has been delivering. The short $14.50 strike caps you beneath the week's call wall at $15.00.
- Makes sense only if: F reclaims the 20-day average at $14.06 early in the week.
- Invalidated if: F closes below $13.74 (first swing support).
- Managing it: Because the near-term trend read fights this side, take 50–60% of maximum value if it comes quickly and don't hold a losing spread into Friday afternoon hoping for gamma.
- Liquidity note: Both legs quote 2¢ wide; the $14.50 calls traded 5,275 contracts for about $37,000 of premium, so fills are available — just mind that 2¢ is a big fraction of a 7¢ option.
- Analyze this position →
If you lean bearish: $14.00/$13.50 put debit spread
- Trade: Buy September 18 $14.00 put, sell September 18 $13.50 put.
- Debit: $0.175 · Max profit: $32.50 · Max loss: $17.50 · Break-even: $13.825
- Why it fits: This is the structure that expresses both chart models — targets of $13.92 and $13.78 sit right on top of the profit zone — alongside the put open interest that has been building all week (put/call open interest 0.89 → 0.99 over five sessions). With premium thin, buying the move is cheaper than usual relative to what the stock has delivered.
- Makes sense only if: F fails at the $14.06–$14.11 moving-average zone early in the week.
- Invalidated if: F closes above $14.18.
- Managing it: The short-term trend is bearish but the 20- and 50-day reads are flat, which argues for taking profits fast rather than pressing — bank it near $13.80 rather than waiting for the full $13.50.
- Liquidity note: The $14.00 puts trade 2¢ wide ($0.25/$0.27) on about $70,000 of premium; the $13.50 puts are 3¢ wide ($0.07/$0.10), roughly a third of their mark, so use limit orders on the spread rather than legging the short side.
- Analyze this position →
If none of these: no trade
There is a clean case for standing aside. The obvious "neutral week" reflex — selling an iron condor around the walls — is exactly what this data argues against: a September 18 $13.50/$13.00 put spread and $14.50/$15.00 call spread collect roughly $0.11 of credit against $0.39 of risk, and you'd be selling premium that has been running about 8.5 vol points below what Ford has actually delivered, at the 31st percentile of its own recent readings. Getting paid a tenth of a dollar to take four-tenths of risk in a stock whose realized movement is above its own norm is a bad trade dressed as an income trade. And the debit structures above are all penny-priced options where a 2–3¢ spread is a meaningful share of the mark. If you can't get filled near the mid, skipping the week costs you nothing.
6 · Quick FAQ
What is F's expected move this week? About ±$0.63, or ±4.48%, into the September 18 expiration — a $13.36 to $14.62 band around the $13.99 snapshot price, per the options market's straddle pricing as of September 11.
Is F expected to go up or down over the next four days? Options positioning as of September 11 reads neutral — front-week flow is call-tilted while longer-dated flow leans put-side, and the two cancel out — but that's a read of what traders have done, not a forecast. The actionable map is the $13.36–$14.62 range, the $14.00 pin, and the $12.00/$15.00 walls.
Are F options expensive right now? Two lenses, same answer. An IV rank of 34.6/100 says option prices are lower than about 65% of the past year's readings; on top of that, they're running roughly 8.5 vol points below the movement F has actually delivered over the past twenty sessions — thinner than about 69% of this stock's own recent readings. That favors buying premium over selling it this week.
Where is F's biggest options support and resistance? For the September 18 expiration, the put wall is $12.00 (45,499 contracts held open) and the call wall is $15.00 (48,711 contracts). Note that across the whole chain the heaviest put strike is $13.00, not $12.00 — the week's own positioning sits lower than the aggregate.
What invalidates this week's read? A close below $13.36, the bottom of the options-implied range. Above the band, a close through $14.62 would say the same thing in the other direction.
Methodology & disclosures. Data: end-of-day options-chain snapshot for F, 2026-09-11, generated 2026-09-14T02:18:31.809Z. Prices shown are midpoints and will differ from live markets. Momentum/positioning scores and volatility-premium comparisons are descriptive measurements of past option flow and past price movement — not investment advice, signals, forecasts, or guarantees. Earnings dates and reported results are from the data provider's earnings feed as of 2026-09-14T02:18:31.809Z; report dates can change. All trade structures are hypothetical. Every structure shown has a defined maximum loss; you can lose the entire max-loss amount. Options involve substantial risk and are not suitable for all investors.