F Options Are Pricing a $0.56 Move Into September 25 — The Chart Model Sees $12.90
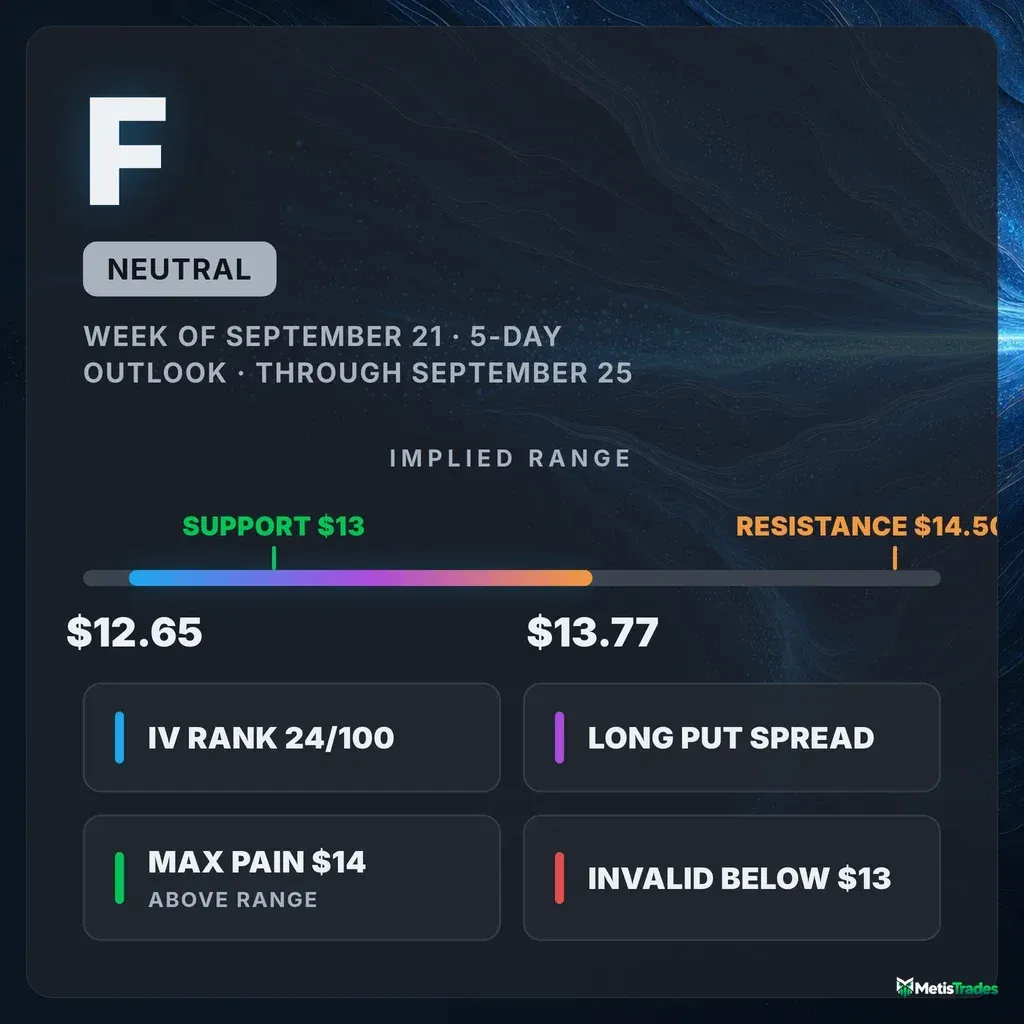
Ford's options market implies a $12.65–$13.77 range through the September 25 expiration, with the heaviest put open interest parked right at $13.00 and max pain up at $14.00. Here's what the positioning says, where the technical read disagrees, and three defined-risk ways to trade it.
Listen to this analysis — prefer audio? This F outlook is also available as a podcast episode:
The options market implies a $12.65–$13.77 range into the September 25 expiration; here's what's driving it, where the chart model disagrees, and three defined-risk ways to trade it.
Published Sunday, September 20, 2026 · Data as of Friday, September 18, 2026 close
Explore the live F options data in the Detailed Options Analyzer →
Quick answer
| Item | Answer |
|---|---|
| Market bias | Neutral |
| Options-implied range (into Sep 25) | $12.65 – $13.77 (±4.22%) |
| Major support | $13.00 (heaviest put open interest for Sep 25) |
| Major resistance | $14.50 (heaviest call open interest for Sep 25) |
| Max pain (Sep 25) | $14.00 |
| Dealer gamma regime (estimate) | Negative for the Sep 25 expiration — on this estimate, hedging around that expiry leans toward amplifying moves; the chain-wide flip estimate sits far below spot at ≈$4.85 |
| Volatility condition | Neutral — IV rank 23.8/100 · premium thin: options priced ~2.8 vol points below delivered movement |
| Next earnings | October 26, 2026 (after close) — five weeks after the Sep 25 expiration |
| Technical check | Diverges (bearish, 3-day and 5-day) |
| Best-fitting strategy | Long put spread (debit) if you want a lean — premium is too thin to favour selling it |
| Analysis invalidated if | F closes below $13.00 |
1 · What matters today
Ford closed Friday, September 18 at $13.21, down 5.4% over five sessions and below every major moving average. Yet the options data does not line up behind that slide: our five-input read of positioning lands squarely in neutral territory, because put-heavy hedging flow and weak price momentum are offset by where the stock sits inside its own options structure — spot is pressed right against the biggest pile of open put contracts at $13.00, with the biggest pile of calls for this expiration all the way up at $14.50.
The options market is pricing a move of about $0.56 up or down through the September 25 expiration — a $12.65 to $13.77 range. That number comes from what a straddle costs at the money. The one level that changes everything is $13.00: it is both the put wall and the nearest swing support, and a close through it hands the tape to the chart model, which sees $12.90. Both technical reports lean bearish, which is the main tension in this piece.
2 · What the options market is pricing
What changed this week
The week was a repricing of the underlying, not of volatility. F fell 5.44% over five trading days and 5.58% over twenty, closing below the 20-day ($13.89), 50-day ($14.10) and 200-day ($13.53) moving averages. At-the-money implied volatility — the market's estimate of how much F will move, baked into option prices — finished at 32.97%, up 3.1% over five days and 3.2% over thirty, so option prices firmed only modestly against a sharp price decline. That firming leaves IV sitting above its 30-day average (31.63%) but well under its 90-day average (38.38%).
Flow got busy. Total option volume ran 2.0× its 20-day average (85,974 calls against 60,190 puts), and the put/call volume ratio — how much put activity there is relative to calls — printed 0.70 versus a 7-day average of 0.62 and a 60-day median near 0.50. So puts picked up meaningfully relative to this name's own norm, while calls still carried the larger absolute share. Open interest told a calmer story: 0.98 puts held open for every call, essentially unchanged from the 14-day average of 0.95.
The biggest still-live builds in open contracts were upside-dated: the January 15, 2027 $15 calls added 1,142 contracts and the September 25 $14 calls added 772. On the downside, the October 16 $13 puts added 524. Into Friday's expiration, the $15 puts shed 1,424 contracts — settled history now, not a live level. The short- and long-term trend reads agree here: bearish over roughly the past week and the past month, flat over the past two months, which argues for keeping directional structures short-dated rather than reaching for time.
Expected move
Through the September 25 expiration, the chain prices a 1σ move of ±4.22%, or about ±$0.56 around the $13.21 spot — a $12.65 to $13.77 range. Here is the ladder:
| Expiration | Implied move | Range around $13.21 |
|---|---|---|
| Sep 25 (7 days) | ±4.22% | $12.65 – $13.77 |
| Oct 2 (14 days) | ±6.54% | $12.35 – $14.07 |
| Oct 16 (28 days) | ±9.11% | $12.01 – $14.41 |
| Oct 30 (42 days) | ±13.02% | $11.49 – $14.93 |
The first three rungs widen roughly with the square root of time, which is what a calm, event-free curve looks like. The October 30 rung is the exception — it widens faster than time alone explains.
Volatility
ATM IV at 32.97% carries an IV rank of 23.8/100, meaning today's reading is cheaper than about 76% of the past year's. The 52-week percentile is 42.9, so IV is nearer the bottom of its yearly range than the middle. Direction is mixed and mild: down 1.7% on the day, up 3.1% over five sessions, up 3.2% over thirty. The front-month read is unavailable today — Friday was an expiration day, so front-month ATM IV and the term-structure comparison can't be interpolated from a same-day-expiring contract.
Against this stock's own recent history, realized movement is the standout: 20-day realized volatility at 35.8% sits well above F's own norm, while the 5-day-versus-20-day ratio is about typical, so the stock has been moving hard but is not accelerating further right now.
Premium: thin, not rich. The volatility risk premium — the gap between how much movement options are priced for and how much F has actually delivered — is negative by about 2.8 vol points: option sellers have been collecting less than realized movement cost them. That gap sits at the 47th percentile versus this stock's own recent readings, so it is mid-pack rather than extreme. A week ago the gap was wider at roughly 8 vol points in the same direction; realized movement has cooled slightly while IV held, narrowing it. Combine IV rank 23.8 with a premium running below delivered movement and the verdict is clear: this is a week that favours owning defined-risk premium over selling it, not the other way round. The next earnings report is five weeks out, so none of that richness or cheapness is an earnings artefact.
Earnings on the calendar
Ford reports on October 26, 2026, after the close — after every rung in the ladder above except the last. That is exactly why the October 30 rung breaks the pattern: ATM IV steps from 32.89% at the October 16 expiration to 38.38% at October 30, and the implied move jumps from ±9.11% to ±13.02%. Options expiring after a scheduled report price in the extra jump risk of that report. The last four reports came in above expectations three times and below once — context only; nothing in this week's positioning depends on it.
Skew and sentiment
Puts and calls the same distance from the stock price don't cost the same. Today the 25-delta put runs at 33.29% implied volatility against 33.02% for the 25-delta call — puts richer by about 0.3 vol points, against a 60-day median where calls were the richer side by about 0.7 vol points. That is roughly a one-point swing toward downside protection versus this name's own baseline, and it's the single most bearish input in our read: traders are paying up for crash protection more than they normally do here, and that demand has been building steadily for about five sessions.
Sentiment across the curve is genuinely split. Our read of the shortest-dated options (0–7 days) is essentially flat at +2; the 7–30 day bucket leans slightly negative at −7, dragged there by richer-than-usual puts; and the 30–60 day bucket is the most constructive at +27, driven by call open interest building and call-side volume dominating. The one-phrase summary for the whole curve is mixed — no single regime dominates, and that disagreement is precisely why the composite bias lands at neutral rather than following the price action down.
The key levels map
| Level | Price | Why it matters |
|---|---|---|
| Chain-wide heaviest call strike | $15.00 | 85,429 calls held open across all expirations — the far upside ceiling, not this week's |
| Call wall (Sep 25) | $14.50 | 6,704 calls held open at this expiration — the strike that caps this week's upside |
| 50-day moving average | $14.10 | Price sits 6.3% below it |
| Max pain (Sep 25) | $14.00 | Where the most option value would expire worthless — note it sits above the top of the implied range |
| 20-day moving average | $13.89 | Price sits 4.9% below it |
| Top of implied range | $13.77 | 1σ upper rail through Sep 25 |
| Swing resistance | $13.74 | Nearest heuristic swing-pivot cluster above spot |
| 200-day moving average | $13.53 | Reclaimed and lost this month; the chart model's invalidation sits just under it at $13.49 |
| Spot / last close | $13.21 | Friday, September 18 close |
| Swing support | $13.18 | Nearest heuristic support cluster — effectively at spot |
| Put wall (Sep 25) / largest gamma strike | $13.00 | 6,591 puts at this expiration and the heaviest total gamma strike chain-wide; also the chain-wide put wall at 93,767 contracts |
| Technical support | $12.87 | Lower Bollinger band and recent swing low from both chart reports |
| Bottom of implied range | $12.65 | 1σ lower rail through Sep 25 |
| Deeper swing support | $12.72 | Second heuristic support cluster |
| 52-week range | $11.11 – $17.78 | Spot sits 31.5% up from the low, 25.7% below the high |
Note the disagreement worth naming: the put wall is $13.00 whether you look at the September 25 expiration alone or the whole chain, but the call wall is $14.50 for September 25 versus $15.00 for the chain as a whole. For this week, use $14.50.
Positioning and unusual flow
The dealer-gamma figure is an estimate, built on an assumed convention rather than observed dealer inventory — read it as one rough estimate, not fact. On that estimate, the September 25 expiration carries a negative reading, meaning market-maker hedging around that expiry would tend to amplify moves rather than cushion them. The chain-wide flip level estimate sits at roughly $4.85, far below spot, so the classic "price falls through the flip and hedging accelerates the selling" accelerant is not in play at these prices.
Three live flow items stood out on Friday. The September 25 $13 calls traded 18,910 contracts against just 774 held open — more than 24 times the existing position, and $652,000 of premium changing hands in a single strike. That is a fresh, large, short-dated bet placed essentially at the money. The September 25 $13 puts traded 9,311 against 6,591 open, adding 214 contracts of open interest — hedging that reinforces the put wall. Further out, the October 16 $13 puts traded 5,236 contracts and added 524 to open interest, making that strike the second-largest dollar-premium contract on the board. The message is consistent: $13.00 is where both sides are transacting.
3 · Technical check
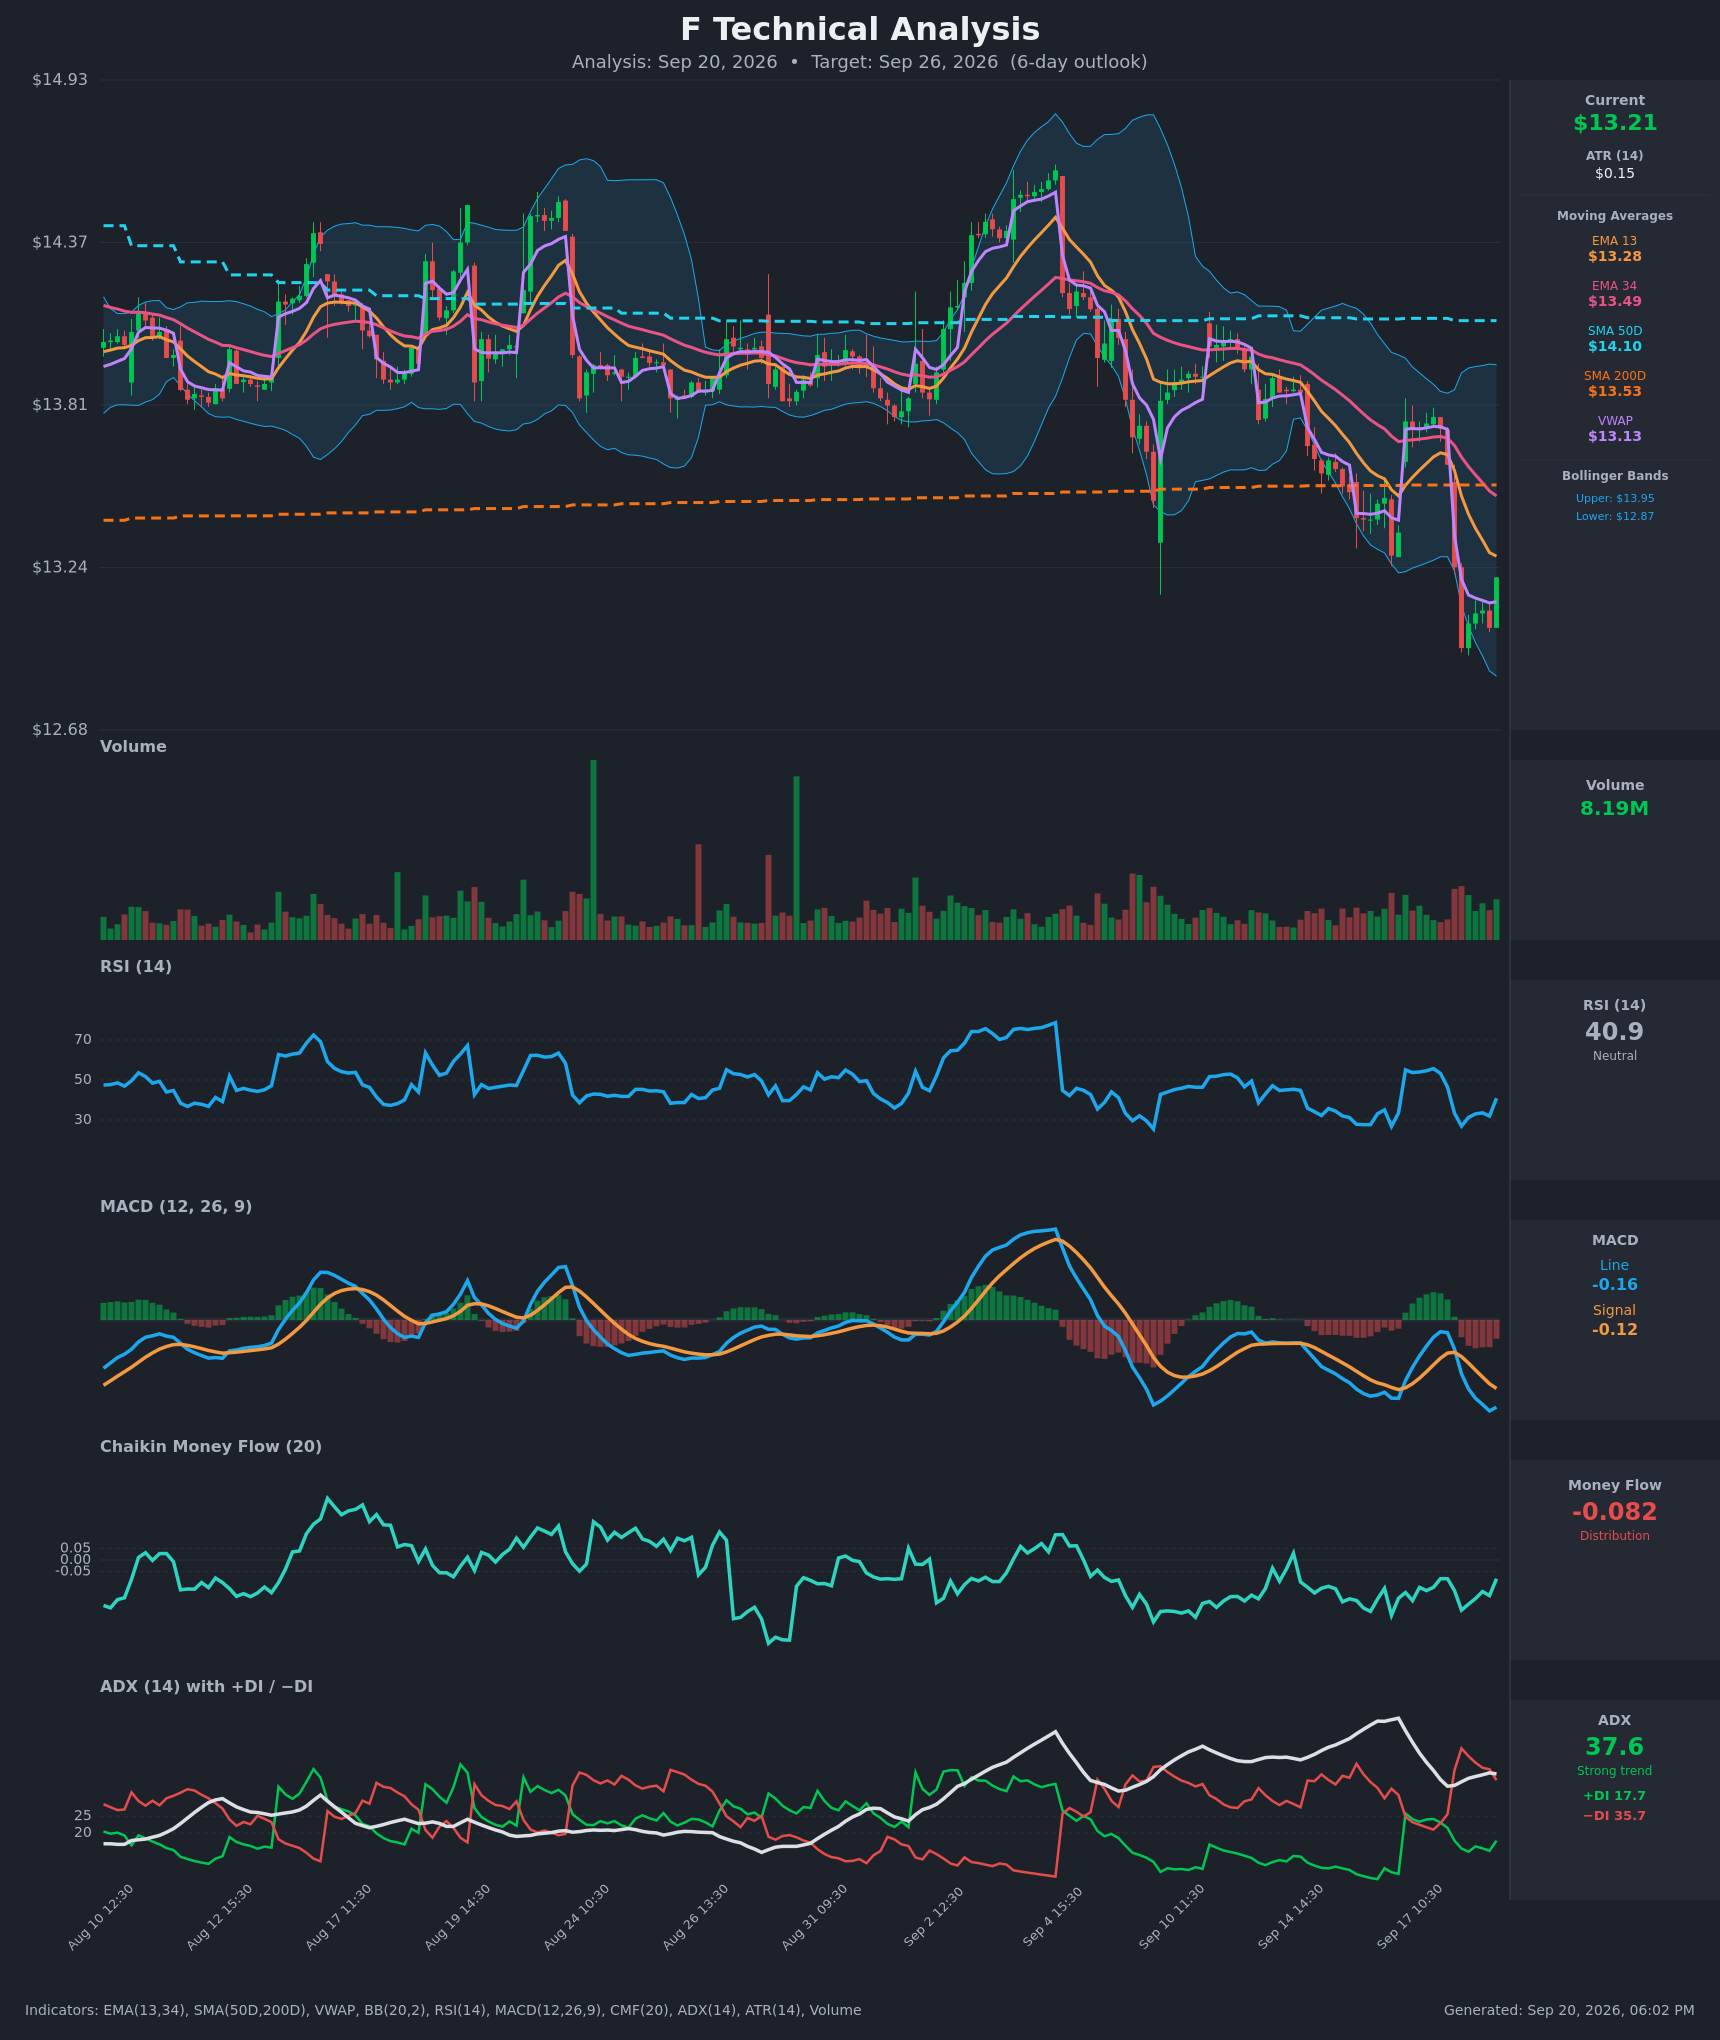
Both technical reports are bearish, and both are fresh — dated September 20 against a September 18 options snapshot, with a matching $13.21 reference price. The 3-day read targets $12.95 by September 23, with a projected range of $12.75 to $13.45 and key levels at $12.87 support and $13.28 resistance. The 5-day read targets $12.90 by September 25, projecting $12.55 to $13.45, with resistance at $13.49.
Classified against the options data, this diverges: the chart model picks a direction where the options read declines to. Its decisive inputs are trend strength (ADX at 37.6 with the negative directional line well above the positive one) and persistent money-flow distribution, with a mild RSI recovery off an oversold 27 read as the only counterweight. Its target does, however, sit comfortably inside the options-implied range — the two models disagree about direction, not about magnitude. Both reports name the same kill switch for their bearish case: a sustained close above $13.49.
Model vs. Market: The options market implies $12.65–$13.77 through September 25; the 5-day technical model targets $12.90. The market is pricing a range that contains the chart's target without endorsing it — which is why the structures below are built around levels, not around a forecast.
Practically, the technical read shaded strike selection rather than the bias: the short put strike in the credit structure below sits at the put wall rather than above it, and the bearish structure's short leg is parked at $12.50, beneath both chart targets.
Full technical write-ups: 3-day report → · 5-day report →
4 · Three ways the next five days can go
If F pushes above the top of the range ($13.77): the next structural obstacles are max pain at $14.00 — which also carries one of the two heaviest total-gamma clusters on the board — and then the September 25 call wall at $14.50. Heavy call open interest overhead tends to slow rallies as it is hedged into, and the path from $13.77 to $14.00 runs straight into the largest single accumulation of September 25 call contracts near the money.
If F drifts between the walls: this is the quietest and, on positioning alone, the most ordinary outcome. Max pain for September 25 sits at $14.00, which is above the top of the implied range — so the theoretical pin pull points up, but the volatility math says reaching it inside five sessions would be a stretch. What that combination usually produces is chop between the $13.00 put wall and the $13.50–$13.77 shelf, with expiring open interest at $13.00 and $13.50 acting as magnets.
If F breaks below the put wall ($13.00): the heaviest put open interest for this expiration is the level that currently anchors the downside; through it, the map thins quickly to $12.87, then the bottom of the implied range at $12.65 and the deeper swing cluster at $12.72. Both chart reports point into that zone. The per-expiration dealer-gamma estimate for September 25 is negative, which on that estimate means hedging around this expiry would lean toward amplifying rather than damping the move — though the chain-wide flip estimate at roughly $4.85 sits far below spot, so this is not the classic flip-level cascade setup.
5 · Three defined-risk structures
Prices are end-of-day midpoints as of 2026-09-18. All structures are hypothetical. Verify live prices before trading — these will be stale by the open.
Ordering note: because premium is running below delivered movement this week, the debit structure leads and both credit structures carry a health warning.
If you lean bearish: September 25 $13.50/$12.50 long put spread
- Trade: Buy the Sep 25 $13.50 put, sell the Sep 25 $12.50 put
- Debit: $0.385 ($38.50 per spread) · Max profit: $61.50 · Max loss: $38.50 · Break-even: $13.115
- Why it fits: you pay for a defined-risk downside position at an IV rank of 23.8 and with implied volatility running about 2.8 vol points under what F has actually delivered — the conditions that favour buying premium rather than selling it. Both chart reports target $12.90–$12.95, below the break-even, and the short leg sits under both.
- Makes sense only if: you believe the momentum and trend reads over the neutral options read, and you want the loss capped at the debit.
- Invalidated if: F closes above $13.49 — the level both technical reports name as their own invalidation.
- Managing it: this is a seven-day structure in a stock whose two-month trend is flat; take profits early rather than holding for the last cent. Close at roughly 60–70% of max value, and exit by Wednesday, September 23 if F is still above $13.21.
- Liquidity note: the $13.50 puts quoted $0.37/$0.46 (9¢ wide) and the $12.50 puts $0.02/$0.04 on a $0.03 mid — penny-wide in absolute terms but a large percentage of mark. Use limit orders at the mid and be willing to walk away; slippage here can eat a third of the edge.
- Analyze this position →
If you expect the range to hold: September 25 $13.00/$12.50 put spread + $13.50/$14.00 call spread iron condor
- Trade: Sell the Sep 25 $13.00 put and buy the $12.50 put; sell the Sep 25 $13.50 call and buy the $14.00 call. You collect a credit up front and keep it if F finishes between the two short strikes.
- Credit: $0.175 ($17.50) · Max profit: $17.50 · Max loss: $32.50 · Break-evens: $12.825 and $13.675
- Why it fits: the short strikes bracket the two levels where positioning is densest — the $13.00 put wall and the $13.50 strike where 4,001 calls and 4,903 puts are held open. Both break-evens sit inside the $12.65–$13.77 implied range, so this is a bet that F chops tighter than the market is pricing.
- Health warning: you're selling premium that hasn't been rich lately — implied volatility is running below realized movement, so the odds are less generous than the credit makes them look.
- Makes sense only if: you specifically expect a post-selloff stall, not merely an absence of direction.
- Invalidated if: F closes below $13.00 or above $13.77.
- Managing it: close at roughly 50% of the credit; exit the whole position by Wednesday, September 23 regardless, because the last two sessions of a seven-day condor are all gamma and no theta. If F closes through either short strike, close rather than hope.
- Liquidity note: all four legs quote 1–2¢ wide ($13.00 put $0.12/$0.14, $12.50 put $0.02/$0.04, $13.50 call $0.10/$0.12, $14.00 call $0.03/$0.04). Absolute spreads are tiny, but on a $0.175 credit they are a meaningful share of the trade — leg in patiently or skip it.
- Analyze this position →
If you lean bullish: September 25 $13.00/$12.50 put credit spread
- Trade: Sell the Sep 25 $13.00 put, buy the Sep 25 $12.50 put. You collect the credit and keep it if F closes above $13.00.
- Credit: $0.10 ($10.00) · Max profit: $10.00 · Max loss: $40.00 · Break-even: $12.90
- Why it fits: the short strike sits exactly on the heaviest put open interest for this expiration, the level that has absorbed the most transacting all week, and 4.5% of downside room separates spot from the lower rail of the implied range. Skew is steeper than this name's norm, so the put side is the relatively better-paid side to sell.
- Health warning: you're selling premium that hasn't been rich lately, and the reward-to-risk here is 1:4 — this needs a high hit rate to work, and the break-even sits precisely on the 5-day chart target.
- Makes sense only if: you read the put building at $13.00 as hedging around a level that holds, not as conviction that it breaks.
- Invalidated if: F closes below $13.00.
- Managing it: close at roughly 50% of the credit, or immediately on a close through $13.00 — a 1:4 structure cannot afford a single full loss to be recovered by four wins.
- Liquidity note: the $13.00 puts traded 2¢ wide on a $0.13 mid with 9,311 contracts of volume — the most active put on the board and easy to fill; the $12.50 wing is thinner.
- Analyze this position →
If none of these: no trade
There is a strong case for standing aside. At a $13 share price, the September 25 chain simply doesn't pay enough for the credit structures: $10 to $17.50 of credit against $32.50 to $40 of risk, with bid-ask spreads that are one to two cents wide on options worth a dime. Those spreads are a tax you pay twice, and on these numbers they can consume a fifth of the credit before the stock moves at all. Selling premium would be the wrong instinct anyway — implied volatility is trading below what F has actually delivered, which means option sellers have recently been collecting less than realized movement cost them, and an IV rank of 23.8 gives no cushion if volatility expands. If you don't want the directional debit spread, the honest answer is to wait for either a decisive close below $13.00 or a reclaim of $13.49, and trade the resolution instead of the coin flip.
6 · Quick FAQ
What is F's expected move this week? About ±$0.56, or ±4.22%, into the September 25 expiration — a $12.65 to $13.77 range, per the options market's straddle pricing as of September 18.
Is F expected to go up or down over the next five days? Options positioning as of September 18 reads neutral — put-heavy hedging and weak price momentum are offset by spot sitting at the put wall with open upside room to the $14.50 call wall — but that is a read of what traders have done, not a forecast. The actionable map is the $12.65–$13.77 range and the $13.00 / $14.50 levels. Note that both technical reports disagree and lean bearish, targeting $12.90–$12.95.
Are F options expensive right now? IV rank 23.8/100 says option prices are lower than about 76% of the past year's readings; on top of that, they're running roughly 2.8 vol points below the movement F has actually delivered — a gap that sits mid-pack, at the 47th percentile, versus this stock's own recent readings. The verdict: cheap enough to favour buying defined-risk premium over selling it, with no earnings distortion in the number.
When is F's next earnings report? October 26, 2026, after the close — after the October 16 expiration but before October 30, which is why the implied move steps from ±9.11% to ±13.02% between those two rungs.
Where is F's biggest options support and resistance? Put wall $13.00, call wall $14.50 for the September 25 expiration. Max pain for that expiration is $14.00.
What invalidates this read? A close below $13.00.
Methodology & disclosures. Data: end-of-day options-chain snapshot for F, 2026-09-18, generated 2026-09-20T18:02:00.644Z. Prices shown are midpoints and will differ from live markets. Momentum/positioning scores and volatility-premium comparisons are descriptive measurements of past option flow and past price movement — not investment advice, signals, forecasts, or guarantees. Earnings dates and reported results are from the data provider's earnings feed as of 2026-09-20T18:02:00.644Z; report dates can change. All trade structures are hypothetical. Every structure shown has a defined maximum loss; you can lose the entire max-loss amount. Options involve substantial risk and are not suitable for all investors.