GLD Options Are Pricing a $13 Move Into September 18 — And the Chart Model Disagrees
The options market implies a $385.57–$411.97 range for GLD through the September 18 expiration, with spot pinned right at the $400 put wall and max-pain strike. Here's what the positioning shows, why premium is unusually thin, and three defined-risk ways to trade it.

The options market implies a $385.57–$411.97 range into the September 18 expiration; here's what's driving it, where the real walls sit, and three defined-risk ways to trade it.
Published Sunday, September 13, 2026 · Data as of the 2026-09-11 close
Explore the live GLD options data in the Detailed Options Analyzer →
Quick answer
| Item | Answer |
|---|---|
| Market bias | Neutral with a bullish tilt |
| Options-implied range (into Sep 18) | $385.57 – $411.97 (±3.31%, about ±$13.20) |
| Major support | $400.00 (Sep 18 put wall) |
| Major resistance | $465.00 (Sep 18 call wall — deep out of the money; $410 is the live overhead) |
| Max pain (Sep 18) | $400.00 |
| Dealer gamma regime (estimate) | Positive for the Sep 18 expiration — hedging tends to dampen moves; chain-wide flip estimate ≈ $460 |
| Volatility condition | Falling — IV rank 30/100 · premium thin: options priced about 4.7 vol points below delivered movement |
| Technical check | Diverges (bearish, 3-day and 5-day chart models) |
| Best-fitting strategy | Long call vertical (defined-risk debit spread) |
| Analysis invalidated if | GLD closes below $395 |
1 · What matters today
GLD closed at $398.77, and the options market is pricing a move of roughly $13.20 in either direction over the next five days — a $385.57 to $411.97 band into the September 18 expiration. That figure comes from what at-the-money straddles cost, which is the market's own estimate of how far the fund travels before Friday.
The read is neutral with a bullish tilt, and the tilt has one main source: spot is sitting right on top of the heaviest put open interest for that expiration ($400) and right on its max-pain strike ($400), with no meaningful call pile until $410. That is the maximum-room end of the corridor. Working against it, short-dated flow has turned put-heavy — put volume ran at 1.85 contracts for every call, versus a two-week average of 0.85.
Both chart models lean bearish, which is the most interesting tension in this article. The level that settles it: a close below $395.
2 · What the options market is pricing
What changed over the past week
GLD gave back 2.79% over the trailing five sessions while going essentially nowhere over twenty (−0.04%). Hedging demand arrived with the slide: put open interest relative to call open interest moved from 0.43 to 0.99 over five days — for every call contract held open there is now essentially one put, against a 14-day average of 0.66. Put volume did the same thing more violently, printing 1.85 versus a 60-day median near 0.69.
Volatility moved the other way. At-the-money implied volatility — the market's estimate of how much GLD will move, baked into option prices — fell 9.96% in a single session to 23.2%, and is down 5.44% on the week. Traders paid up for protection in contract terms while the price of that protection fell.
The biggest genuine open-interest build at the target expiration was the September 18 $390 put, which added 5,942 contracts to reach 19,120 held open on 3,657 contracts traded. Into Friday's now-settled expiration, the $390 puts had added 21,287 contracts on 32,471 of volume — that flow is history, not a live level.
One more thing worth sitting with: the short- and long-term trend reads disagree. The past week's 2.8% slide runs against a market still up 7.8% over the past fifty sessions, with the twenty-day read flat in between. Near-term flow and the bigger trend are pointing in different directions, which argues for keeping directional structures short-dated rather than stretching them out.
Expected move
Into September 18, the options market is pricing roughly ±3.31%, or about ±$13.20 around the $398.77 spot — a $385.57 to $411.97 range.
| Expiration | Implied move | Range around $398.77 |
|---|---|---|
| Wednesday, September 16 | ±2.53% | $388.68 – $408.86 |
| Friday, September 18 (our window) | ±3.31% | $385.57 – $411.97 |
| Friday, September 25 | ±4.51% | $380.79 – $416.75 |
| Friday, October 16 | ±7.23% | $369.94 – $427.60 |
The rungs climb smoothly with time — there is no step-up or kink between them, which is what a calendar with no scheduled event risk inside the window looks like. The jump from ±2.53% to ±3.31% between Wednesday and Friday is simply two more days of drift, not a catalyst being priced.
Volatility
At-the-money implied volatility sits at 23.2%, with an IV rank of 30/100 — meaning option prices are cheaper than roughly 70% of the past year's readings for this fund. That is below its own 3-day, 7-day and 14-day averages (all near 34–35), and below both the 30-day (23.6%) and 90-day (23.4%) moving averages of implied volatility. The front-month read is unavailable in this snapshot — the data date was itself an expiration day, which makes that particular comparison uncomputable rather than missing.
Meanwhile the fund has actually been moving. Twenty-day realized volatility is 27.9%, which sits above this symbol's own recent norm. But the very-short-term pace has cooled: the five-day-versus-twenty-day realized-volatility ratio is 0.72, unusually depressed for GLD — movement is decelerating relative to its own month even as the monthly number stays elevated.
Premium rich or cheap. The gap between what options are priced for and what GLD has actually delivered — the volatility risk premium — is about negative 4.7 vol points. Option prices are running well below the fund's delivered movement, and that reading is thinner than roughly 79% of this stock's own recent readings (21st percentile). When this gap is positive, option sellers collect more than realized movement costs them; right now it is inverted. That combination — IV rank 30 and a 21st-percentile premium versus delivered movement — favors owning optionality rather than selling it this week. The path matters too: the gap sat near −2.4 vol points as recently as Thursday and widened to −4.7 on Friday, almost entirely because implied volatility dropped 10% in one session while the realized-volatility window stayed full of early-September's 1.5%-to-2.5% gaps.
Skew and sentiment
Skew measures whether puts and calls the same distance from the stock price cost the same. Normally for GLD, puts are the richer side: the 60-day median sits at about +1.0 vol points of put-over-call. Today it is inverted — 25-delta puts price at 23.2% against 24.5% for the equivalent calls, so puts run about 1.3 vol points under calls. That is roughly 2.3 vol points flatter than this fund's own norm, and it is the single most bullish-leaning input in the mix: nobody is paying up for crash protection at the margin, even while buying a lot of puts by contract count.
Those two facts sit oddly together, and both are real. Put volume at 1.85 is unusually put-tilted versus GLD's own recent history, and peer-relative unusual flow tipped to the put side (13 put contracts cleared the peer bar against 10 calls). But the pricing of that demand is complacent, not panicked.
Sentiment across the expiration curve reads "bullish recovery": the 0–7 day bucket scores +15, the 7–30 day bucket +4, and the 60–120 day bucket +46 — positioning is building further out on the curve rather than in the front week. Call open interest at the 0–7 day tenor grew by 32,587 contracts against 27,483 puts, while delta-weighted flow in that same bucket tilted slightly to the put side. It is a chain with mixed short-dated conviction and a clearly constructive long end.
The key levels map
| Level | Price | Why it matters |
|---|---|---|
| Call wall, Sep 18 | $465.00 | Heaviest call open interest for the expiration (47,573), but at a delta of 0.004 it is a bookkeeping wall, not a live magnet |
| Chain-wide heaviest call strike / gamma flip (estimate) | $460.00 | 115,439 calls held open across all expirations, mostly November; one rough estimate puts the dealer gamma flip here |
| 52-week context | $509.70 high / $332.97 low | Price sits 21.8% below the high, 37 on a 0–100 range scale |
| Swing resistance | $421.82 / $429.42 | Heuristic swing-pivot clusters — descriptive structure, not guaranteed reaction zones |
| 200-day moving average | $415.93 | Price is 4.13% below it — the long-term trend line is still overhead |
| Swing resistance | $413.54 | Late-August rejection zone |
| Top of implied range (Sep 18) | $411.97 | The 1σ ceiling the options market is pricing |
| Practical overhead resistance | $410.00 | 43,076 calls open at Sep 18 and the second-largest gamma strike on the whole chain — this is the level that actually caps the week |
| 20-day moving average | $409.43 | Price is 2.6% below it; reclaiming it would be the first real trend repair |
| Swing resistance | $407.18 | Prior support turned resistance after the early-September breakdown |
| Secondary call cluster | $405.00 | 22,254 calls and 22,214 puts open across the chain — a two-sided battleground |
| Put wall + max pain, Sep 18 | $400.00 | 27,140 puts and 43,320 calls open at this one strike; also the largest total-gamma strike chain-wide and where the most option value would expire worthless |
| Swing resistance | $398.79 | Sits within pennies of spot — the immediate pivot |
| Spot / last close | $398.77 | Where everything above is measured from |
| Secondary put shelf | $395.00 | 3,711 puts open at Sep 18, heavy volume Friday; our invalidation line |
| 50-day moving average | $391.22 | Price is 1.93% above it — the nearest trend support |
| Lower put cluster | $390.00 | 19,120 puts open at Sep 18 after the week's biggest genuine build |
| Bottom of implied range (Sep 18) | $385.57 | The 1σ floor the options market is pricing |
| Swing support | $383.60 / $380.04 | Next heuristic shelves below the implied range |
Note the disagreement between scopes: the September 18 expiration's own call wall is $465, while the whole chain's heaviest call strike is $460 — both are far-dated artifacts. Both walls agree on the downside: the put wall is $400 at the target expiration and $400 across the chain combined.
Positioning and unusual flow
Market makers hedge the options they have sold, and the direction of that hedging changes with positioning. The estimate for the September 18 expiration specifically reads positive — in that regime, hedging tends to dampen moves rather than amplify them, which fits a week whose max pain and put wall sit at the same $400 strike as spot. Read it as an estimate built on an assumed dealer sign convention, not observed inventory; the chain-wide flip marker at $460 sits far above spot, and the two readings do not sit comfortably together.
Three live flow items stood out:
- September 18 $400 put — 6,731 contracts traded against 27,140 open, roughly $3.9 million of premium. The single busiest live contract on the board, and it sits exactly on the put wall.
- October 30 $405 call — 2,015 contracts traded against just 12 open, about $2.4 million of premium. A brand-new position, well out beyond this article's window, positioned above spot.
- September 18 $396 put — 1,711 contracts on 205 open, roughly $663,000 of premium and an 85th-percentile volume print versus its peer contracts. Fresh short-dated downside insurance just under spot.
3 · Technical check
Both chart models run against the options read. The 3-day model (target date September 16) is bearish, projecting $396.20 with a range of $392.80 to $402.20. The 5-day model, which lands exactly on our September 18 target date, is also bearish: $394.50, with a projected range of $389.50 to $402.50. Its reference price of $398.60 is within pennies of the options snapshot's $398.77, so the two data sets are describing the same market.
The two indicators doing most of the work: Chaikin Money Flow at −0.211 has stayed firmly negative through every bounce attempt over the past three weeks, which the model reads as sustained distribution; and the directional index shows −DI at 31.8 above +DI at 23.4, with ADX cooling from a recent peak near 27.6 to 20.9. Translation: sellers still hold the directional edge, but the intensity behind the move is fading — consolidation inside a downtrend rather than a fresh breakdown. Both models classify as Diverges: the direction contradicts the options positioning read, even though both targets sit comfortably inside the options-implied band.
Model vs. Market: The options market implies $385.57–$411.97 into September 18; the 5-day technical model targets $394.50. The chart is calling for the lower half of a range the options market treats as symmetric. What resolves it is $395 — the chart's bearish scenarios all trigger on a close below $396, while the options structure has no downside magnet until $390.
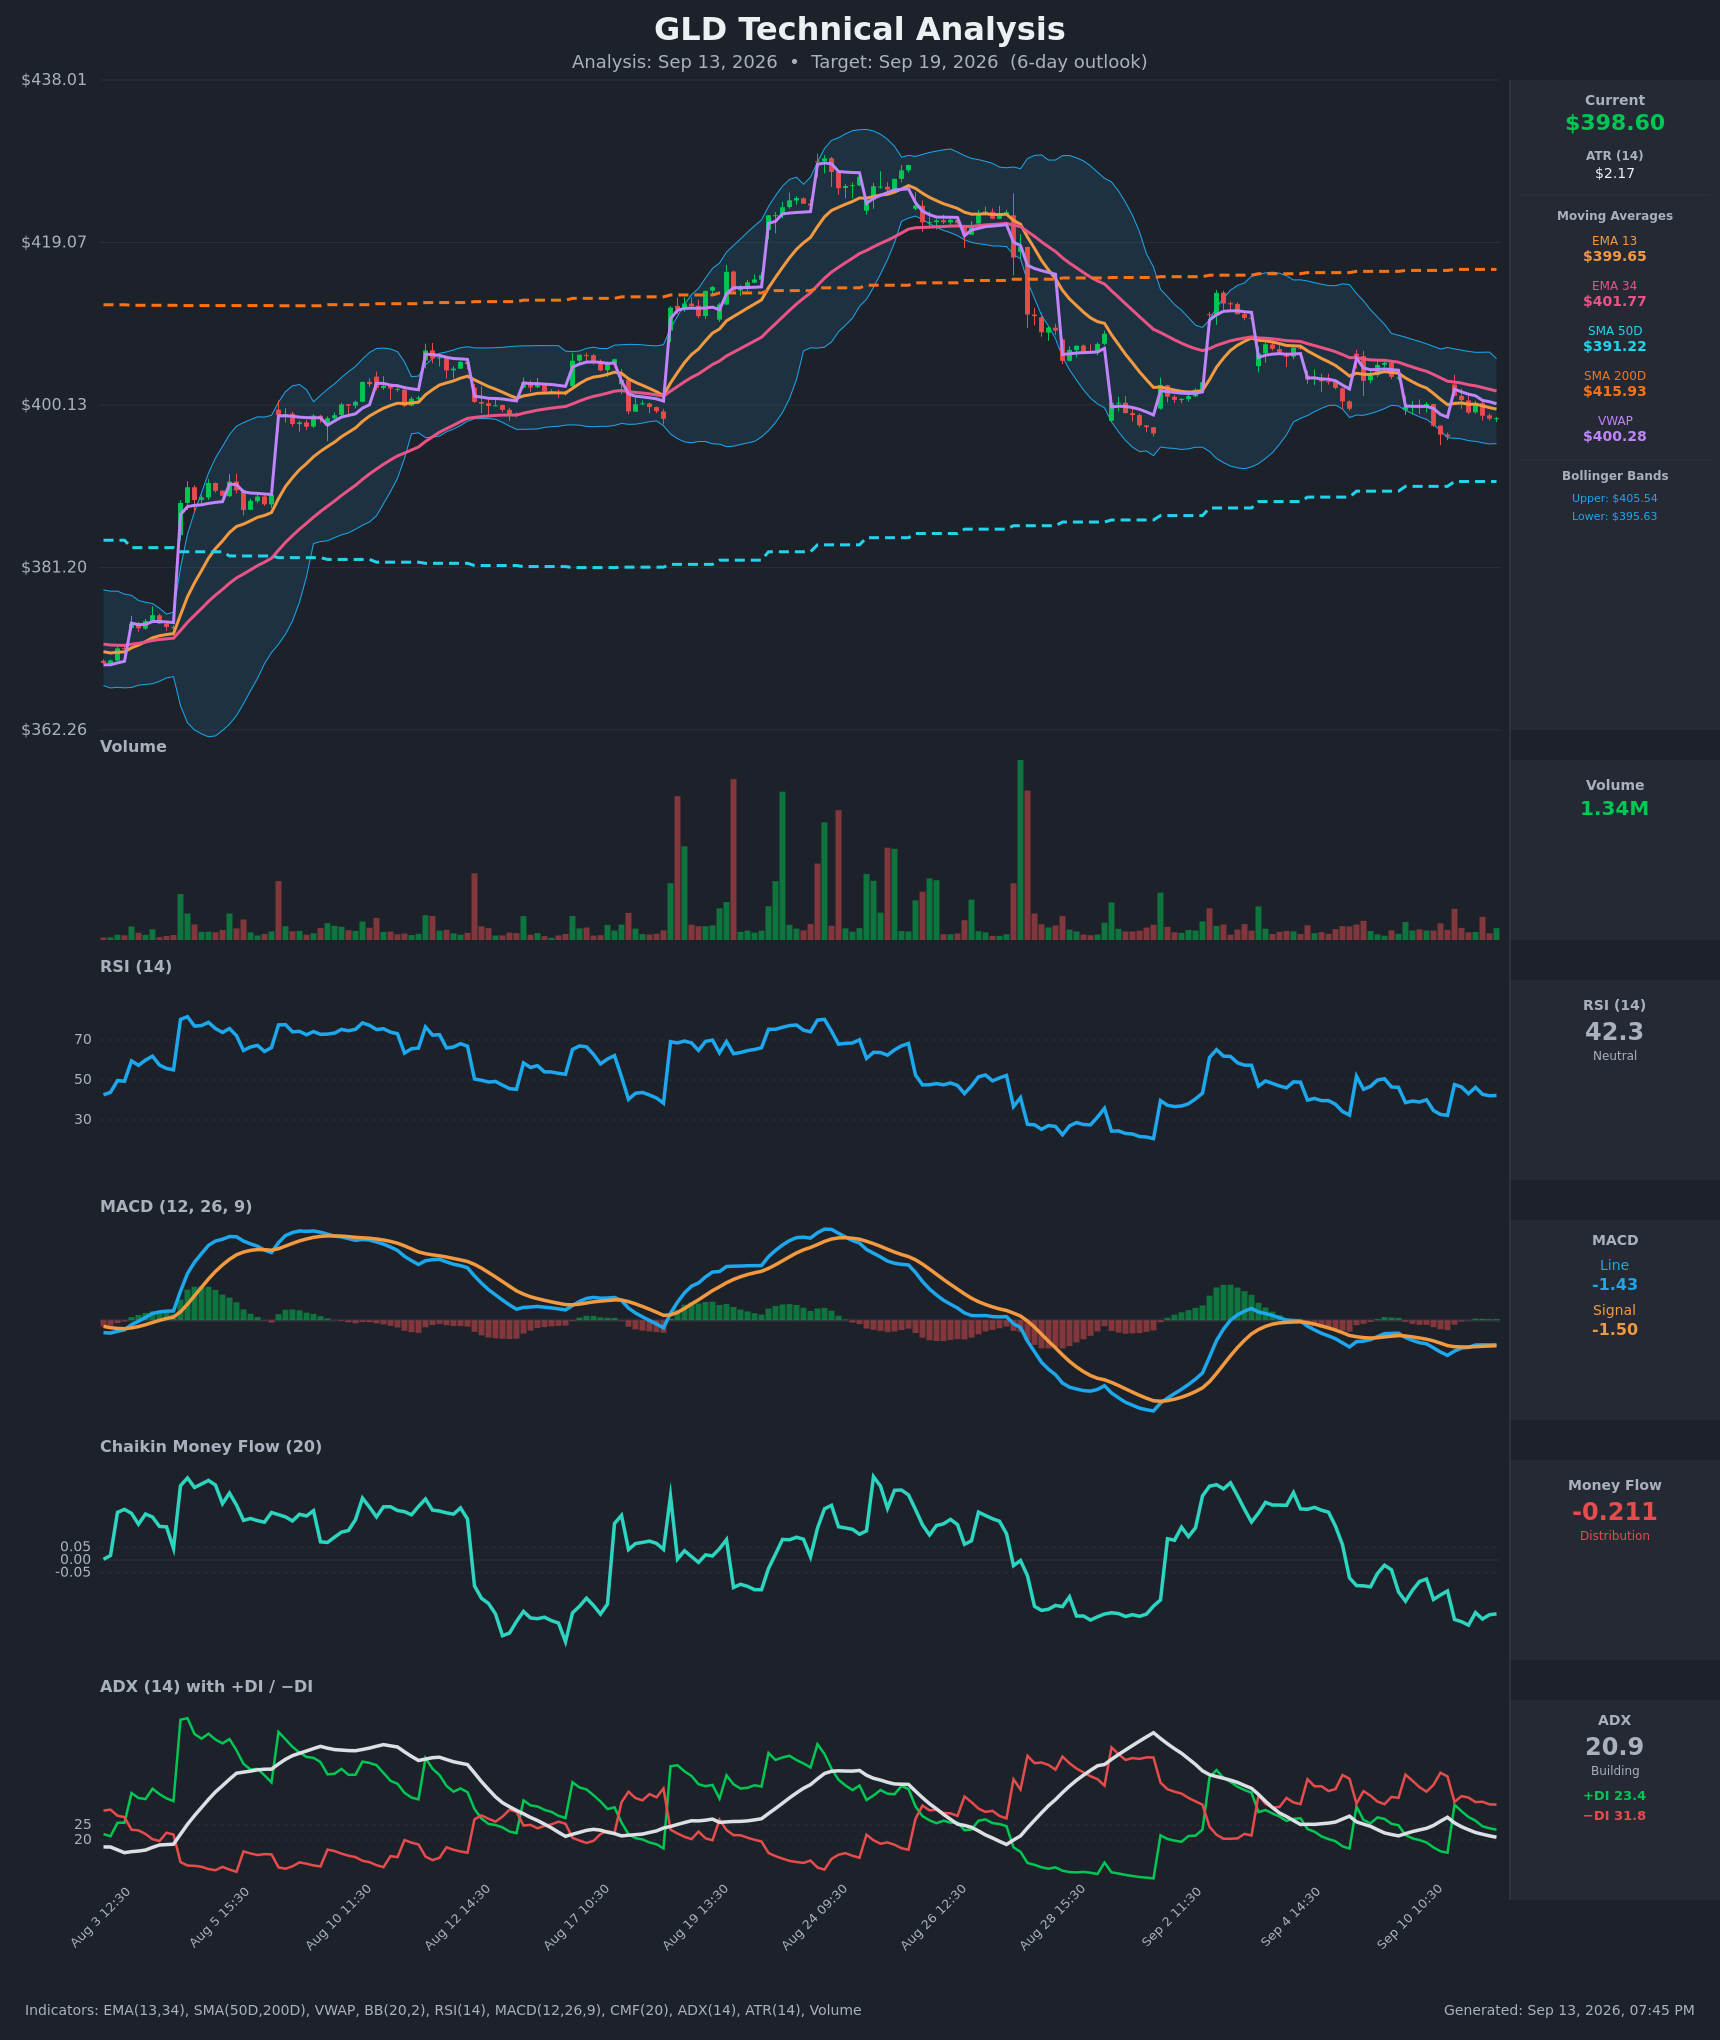
How that adjusted the trades below: it did not flip the bias, but it did pull the bearish structure's strikes toward the chart's own $391–$393 target zone, and it kept the bullish structure's short leg at $410 rather than reaching for anything higher.
Full technical write-ups: 3-day report → · 5-day report →
4 · Three ways the next five days can go
If GLD pushes above $410: that strike holds 43,076 calls open at this expiration and is the second-largest gamma concentration on the chain, so the heaviest overhead positioning tends to slow rallies there. Above it, positioning thins dramatically — the next real cluster is not until $420–$425, and the 20-day moving average at $409.43 sits in the same neighborhood, making $409–$411 a single congested shelf.
If GLD drifts between the walls: this is the pin case, and it is the one the positioning most obviously supports. Max pain for September 18 is $400 and the put wall is $400, which is 23 cents above Friday's close. Expirations sometimes gravitate toward the strike where the most option value expires worthless, and the expiration's own gamma estimate points the same way — hedging that dampens rather than amplifies. A week that ends within a dollar or two of $400 would surprise nobody looking at this chain.
If GLD breaks below $395: the next support in the options structure is $390, where 19,120 puts are held open after the week's largest genuine build. Below that, the implied range's floor at $385.57 and swing structure near $383.60 are the reference points. One rough estimate places the dealer gamma flip well above spot at $460 — a reading that, taken at face value, would put GLD on the fragile side of that estimate, where hedging amplifies selling rather than cushioning it. Treat that as the estimate it is; the flip figure is derived from raw gamma and open interest, not from observed dealer books.
5 · Three defined-risk structures
Prices are end-of-day midpoints as of 2026-09-11. All structures are hypothetical. Verify live prices before trading — these will be stale by the open.
If you lean bullish: September 18 $400/$410 call debit spread
- Trade: Buy the Sep 18 $400 call, sell the Sep 18 $410 call
- Debit: $3.11 · Max profit: $6.89 ($689 per spread) · Max loss: $3.11 ($311) · Break-even: $403.11
- Why it fits: Premium is thin — options are priced about 4.7 vol points below GLD's delivered movement, a 21st-percentile reading versus its own recent history — so this is a week to own optionality rather than sell it. The long leg sits exactly on the put wall and max-pain strike ($400), and the short leg sits on $410, the only meaningful call pile between spot and the implied ceiling. The friction to acknowledge: 25-delta calls run about 1.3 vol points over the equivalent puts, so you are buying the marginally pricier side of the chain — the short $410 leg recovers part of that.
- Makes sense only if: you think the $400 magnet holds and the fund works back toward its 20-day average near $409.43 rather than breaking lower.
- Invalidated if: GLD closes below $395.
- Managing it: With the short-term trend fighting the longer one, take profits early rather than holding for the full width — close at roughly 60–70% of max value if $409–$411 is reached, and exit by Thursday's close regardless, since a debit spread this close to expiration loses its remaining value quickly once the move fails to arrive.
- Liquidity note: The $400 calls traded 20¢ wide on 3,991 contracts; the $410 calls 8¢ wide on 3,901. Both are among the most active contracts on the board — fills should be easy near the mid.
- Analyze this position →
If you lean bearish: September 18 $395/$385 put debit spread
- Trade: Buy the Sep 18 $395 put, sell the Sep 18 $385 put
- Debit: $2.47 · Max profit: $7.53 ($753 per spread) · Max loss: $2.47 ($247) · Break-even: $392.53
- Why it fits: This is the structure that expresses the chart models rather than the options read — both target the $391–$394.50 zone, which sits between these two strikes. The same thin-premium condition that favors owning calls favors owning puts, and with skew inverted, puts are currently the cheaper side of the chain by about 1.3 vol points. The short $385 leg sits at the bottom of the implied range, so you are financing the position with the part of the distribution the market considers a stretch.
- Makes sense only if: you weight the technical picture — persistent negative money flow, price below both short-term averages — above the positioning read.
- Invalidated if: GLD closes above $402.50, the level the 5-day chart model names as its own kill switch.
- Managing it: Target the chart's own zone — take it off into $392–$391 rather than waiting for $385. Exit by Thursday if price is still chopping around $398.
- Liquidity note: The $395 puts traded 20¢ wide on 5,235 contracts (about 5.7% of mark); the $385 puts 6¢ wide on 3,845 (about 5.8%). Both are slightly wider than ideal relative to their marks — use limit orders at the mid rather than crossing.
- Analyze this position →
If you expect the range to hold: September 18 $387/$390/$408/$411 iron condor
- Trade: Sell the $390 put / buy the $387 put, and sell the $408 call / buy the $411 call, all Sep 18. You collect a credit up front and keep it if GLD finishes between the short strikes.
- Credit: $1.205 ($120.50 per condor) · Max profit: $120.50 · Max loss: $179.50 · Break-evens: $388.80 and $409.21
- Why it fits: The pin case has the most positioning behind it — max pain and the put wall are both $400, spot is 23 cents away, and the expiration's own dealer-gamma estimate reads positive (dampening). The short strikes sit just inside the $385.57–$411.97 implied rails.
- Health warning: you are selling premium that has not been rich lately. Implied volatility is running about 4.7 vol points below GLD's delivered movement, thinner than roughly 79% of this fund's own recent readings, and 20-day realized volatility of 27.9% is above the 23.9% the September 18 rung is charging. This is the least-favored of the three structures this week, and it is here because some readers will want the range trade regardless.
- Makes sense only if: you specifically believe realized movement is about to collapse toward the cooling five-day pace rather than the elevated twenty-day one.
- Invalidated if: GLD closes outside $390–$408 at any point before Friday — take the loss rather than rolling into a wider range.
- Managing it: Close at roughly 50% of max credit; exit regardless on Thursday, because a three-point-wide condor carries brutal gamma risk on expiration day.
- Liquidity note: All four legs quote between 7¢ and 9¢ wide — roughly 4.4% to 5.5% of their marks. Workable, but the four-leg round trip eats a meaningful share of a $120 credit; treat slippage as a real cost here.
- Analyze this position →
If none of these: no trade
There is a clean case for standing aside. The bias is neutral with only a mild tilt, and the two most reliable directional inputs — options positioning and the chart models — point opposite ways. Premium is cheap by this fund's own recent standard, which rules out the comfortable income trade and leaves only directional bets with a seven-day clock. If you have no independent view on gold and no reason to prefer the options read over the technical one, a week where the pin case is the highest-probability outcome and the pin strike is 23 cents from spot offers very little to be paid for. Waiting for a close outside $395–$410 costs nothing and removes the coin flip.
6 · Quick FAQ
What is GLD's expected move into September 18? About ±$13.20, or ±3.31%, giving a $385.57 to $411.97 range around the $398.77 close — per the options market's straddle pricing as of the 2026-09-11 snapshot.
Is GLD expected to go up or down over the next five days? Options positioning as of 2026-09-11 leans neutral with a slight bullish tilt — spot sits directly on the $400 put wall with no real call resistance until $410 — but that is a read of what traders have already done, not a forecast. The actionable map is the $385.57–$411.97 range plus the $400 support and $410 resistance levels. The chart models take the other side, targeting $394.50 into the same date.
Are GLD options expensive right now? No. IV rank of 30/100 says option prices are lower than roughly 70% of the past year's readings; on top of that, they are running about 4.7 vol points below the movement GLD has actually delivered over the past twenty sessions — thinner than about 79% of this fund's own recent readings. That combination favors buying defined-risk optionality over selling it.
Where is GLD's biggest options support and resistance? For the September 18 expiration, the put wall is $400.00 (27,140 contracts) and the stated call wall is $465.00 (47,573 contracts) — though at a delta of 0.004, the $465 strike is not a functional ceiling. The level that actually caps the week is $410, where 43,076 calls are held open.
What invalidates this week's read? A close below $395. That breaks the $400 pin structure and hands the week to the chart models' $391–$393 target zone.
Methodology & disclosures. Data: end-of-day options-chain snapshot for GLD, 2026-09-11, generated 2026-09-13T19:45:04.656Z. Prices shown are midpoints and will differ from live markets. Momentum/positioning scores and volatility-premium comparisons are descriptive measurements of past option flow and past price movement — not investment advice, signals, forecasts, or guarantees. All trade structures are hypothetical. Every structure shown has a defined maximum loss; you can lose the entire max-loss amount. Options involve substantial risk and are not suitable for all investors.