GLD Options Are Pricing an $11.53 Move Into September 25 — and the Chart Model Disagrees
The options market implies a $389.64–$412.70 range for GLD through the September 25 expiration, with max pain sitting a dollar under spot at $400. Short-dated flow turned defensive on Friday even as both chart models lean higher — here's the level map and three defined-risk ways to trade the standoff.
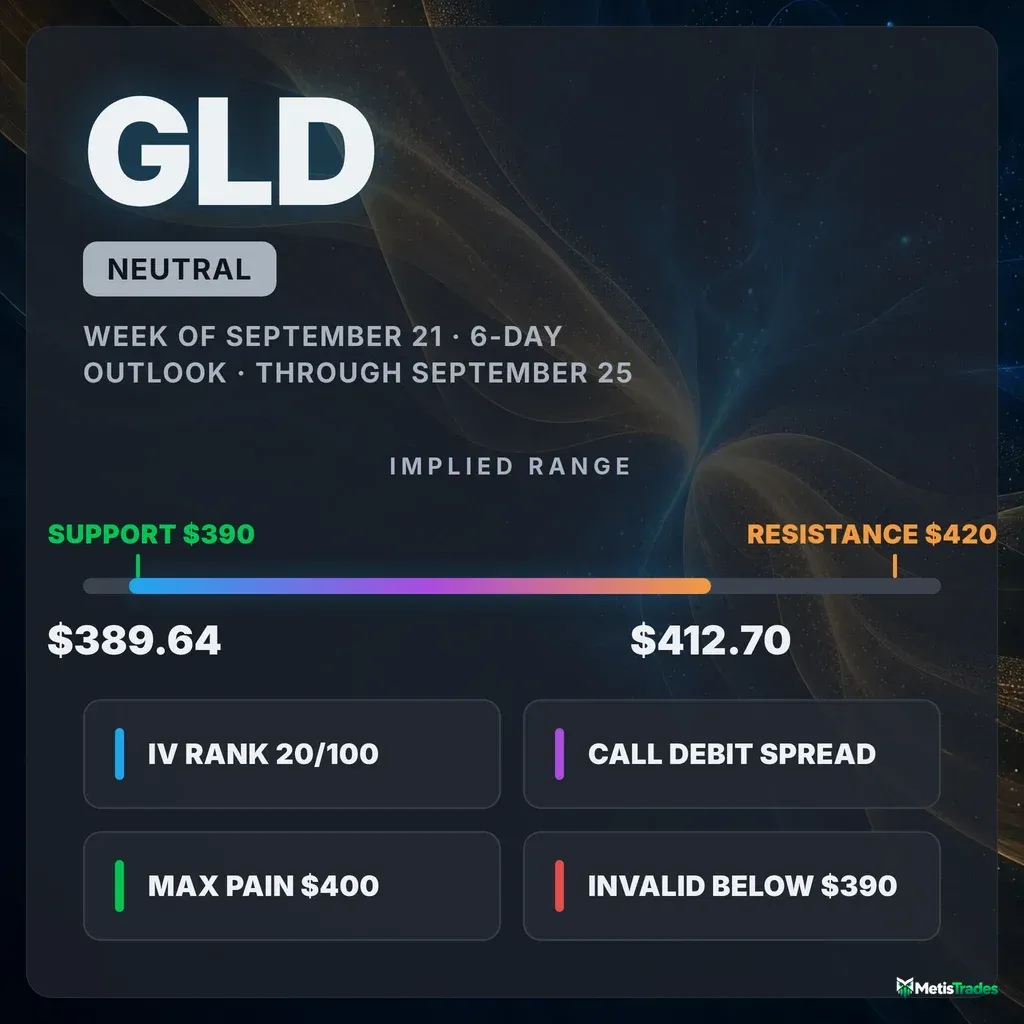
The options market implies a $389.64–$412.70 range into the September 25 expiration; here's what's driving it, where the walls sit, and three defined-risk ways to trade it.
Published Saturday, September 19, 2026 · Data as of Friday, September 18, 2026 close
Explore the live GLD options data in the Detailed Options Analyzer →
Quick answer
| Item | Answer |
|---|---|
| Market bias | Neutral |
| Options-implied range (into September 25) | $389.64 – $412.70 (±2.9%, about ±$11.53) |
| Major support | $390.00 (put wall, September 25 expiration) |
| Major resistance | $420.00 (call wall, September 25 expiration) |
| Max pain (September 25) | $400.00 |
| Dealer gamma regime (estimate) | Positive — hedging tends to dampen moves; flip level ≈ $353 (estimate) |
| Volatility condition | Falling — IV rank 20/100 · premium thin: options priced about 3.8 vol points below delivered movement |
| Technical check | Mixed (bullish, 3-day and 6-day chart models) |
| Best-fitting strategy | Debit spreads over credit — featured structure is the September 25 $400/$407 call debit spread |
| Analysis invalidated if | GLD closes below $390.00 |
1 · What matters today
The options market is pricing GLD between roughly $389.64 and $412.70 through the September 25 expiration — about ±$11.53, or ±2.9%, around Friday's $401.17 close. Our bias is Neutral, and it's earned. Short-dated flow turned defensive into the close: puts 25% out of the money ran 4.1 vol points richer than the equivalent calls, against a 0.1-point norm for this fund, meaning traders paid up sharply for downside protection. But both chart models point higher, the heaviest open interest in the target expiration brackets price at $390 below and $420 above, and max pain — the price where the most option value expires worthless — sits at $400, a dollar under spot. Options are also cheap: IV rank is 20/100, and premium is running about 3.8 vol points below what GLD has actually delivered. The level that changes the picture is $390.
2 · What the options market is pricing
What changed this week
The dominant move was in volatility, not direction. At-the-money implied volatility — the market's estimate of how much GLD will move, baked into option prices — closed at 20.76%, down 8.9% in a single session and 10.7% over five, leaving it 13.3% below its own 30-day average of 23.93% and below the 90-day average of 23.37%. IV rank fell to 20/100 against a 14-day average of 31.5. Positioning followed: the put/call open-interest ratio (how many puts are held open for every call) slid from 0.99 to 0.74 over five sessions, versus a 7-day average of 1.06 — puts were being closed, not added. Friday's put/call volume ratio of 0.63 was likewise call-tilted against a 7-day average of 1.08, on total option volume running at just 0.77× the 20-day norm.
The one thing that moved the other way was the price of protection. The 25-delta skew — how much more expensive puts are than equidistant calls — jumped to 4.07 vol points from a 60-day median of 0.15, after averaging negative 0.36 points over the prior seven sessions. That is a 5.3-point steepening in five sessions, and it is stretched unusually wide versus this ETF's own recent history. Underneath, the underlying is up 0.60% over five sessions but down 3.39% over twenty; the short- and medium-term trend reads are flat while the two-and-a-half-month read is up 6.1% — a bounce inside a wider chop rather than a fresh trend. For historical context only: into the September 18 expiration, the $410 puts shed 6,078 contracts of open interest and 22,262 of the $400 calls changed hands before settling.
Expected move
The expected move is the move the options market is pricing in, derived from what straddles cost. For the September 25 expiration, the call and put sides of the at-the-money strike disagreed too much for the chain to publish a blended reading — a quote-quality artifact that also nulled every rung between September 21 and October 16. Scaling the chain-wide ATM IV of 20.76% to seven days gives an implied move of about ±2.9%, or ±$11.53, around the $401.17 close.
| Expiration | Implied move | Range around $401.17 |
|---|---|---|
| September 25 (target) | ±2.9% | $389.64 – $412.70 |
| October 23 | ±6.55% | $374.89 – $427.45 |
| October 30 | ±7.39% | $371.52 – $430.82 |
The ladder steps up smoothly with time rather than jumping at any one rung — there is no event hump priced anywhere in the covered expirations, which is consistent with the chain's steady, undramatic term pricing further out.
Volatility
At 20.76%, ATM IV sits at an IV rank of 20/100 — cheaper than roughly 80% of the past year's readings — with an IV percentile of 15.5, meaning only about 16% of the last year's sessions closed with IV below today's. Direction is unambiguously down: −8.9% on the day, −10.7% over five sessions, −8.9% over thirty. The front-month read is unavailable today (Friday was an expiry day, so front-month ATM IV can't be interpolated from a same-day-expiring contract), which also leaves the term-structure comparison blank for this snapshot.
Realized movement is cooling faster than implied. GLD's 20-day realized volatility is 24.55% and its 30-day is 25.31%, but the 10-day is down at 19.48% — and the ratio of 5-day to 20-day realized movement sits at 0.79, well below this fund's own norm. Translation: the last week has been noticeably quieter than the month that preceded it.
Premium rich or cheap: the volatility risk premium — the gap between how much movement options are priced for and how much GLD has actually delivered — is negative 3.8 vol points. Option sellers have been collecting less than realized movement cost them. Against this ETF's own recent readings, that gap is richer than only about a quarter of them, i.e. cheaper than roughly three-quarters. The gap widened over the past week, from about 1.6 points below delivered movement on September 17 to 3.8 points on September 18, as IV dropped 8.9% in a session while the realized leg held. That combination — IV rank 20 and a 26th-percentile premium versus delivered movement — favors owning premium this week rather than collecting it, and it is the single biggest argument against reflexively selling a condor here.
Skew and sentiment
The one genuinely unusual reading in Friday's snapshot is the price of downside protection. The 25-delta put is marked at 23.54% implied volatility against 19.47% for the 25-delta call — a 4.07 vol-point gap against a 60-day median of 0.15 points, and a level stretched far beyond this fund's own recent history. Traders are paying up for crash protection at a pace that is abnormal for GLD specifically. Our read of short-dated options flow reflects it: the 0–7 day expiration bucket scored −40 and the 7–30 day bucket −29 on Friday, against 7-day averages of −2 and +5 respectively, with the risk-reversal component — how puts price relative to calls — doing nearly all the work. Further out the picture flips: the 30–60 day bucket reads +57 on call-side open-interest building. The overall regime label is "Mixed," and that is the honest summary.
Against that, the raw flow was not defensive at all. Put/call volume at 0.63 was 9% below its 60-day median, put open interest thinned by 5,944 contracts against a 650-contract drop on the call side, and the pace of IV compression itself is running well above this fund's norm. The bearish evidence is concentrated entirely in what protection costs; the bullish evidence is in what traders actually did with contracts.
The key levels map
| Level | Price | Why it matters |
|---|---|---|
| Call wall (September 25) | $420.00 | Heaviest call open interest (3,543) in the target expiration — the level that caps upside |
| 200-day moving average | $416.22 | Price sits 3.62% below it; the longer-term trend structure is still overhead |
| Swing resistance | $413.54 | Heuristic swing-pivot cluster from recent price structure |
| Options-implied ceiling | $412.70 | Top of the ±2.9% move priced into September 25 |
| Gamma cluster / call OI | $410.00 | Second-heaviest total gamma in the whole chain; 2,201 calls open at this strike for September 25 |
| Swing resistance | $407.18 | Nearest heuristic resistance shelf; the 6-day chart model's own resistance sits at $407.50 |
| 20-day moving average | $406.62 | Price is 1.34% below — the first mean-reversion test on any push higher |
| Spot (Friday close) | $401.17 | Chain-snapshot reference for every strike figure above and below |
| Max pain (September 25) · whole-chain heaviest strike | $400.00 | The strike where the most option value expires worthless; across all expirations it is simultaneously the heaviest call strike (81,320) and heaviest put strike (81,984), and the single largest gamma strike in the chain |
| Swing support | $398.79 | First heuristic support shelf; both chart models place their support at $397.00 |
| 50-day moving average | $392.97 | Price sits 2.09% above it — the structural floor under the recent bounce |
| Put wall (September 25) | $390.00 | Heaviest put open interest (7,897) in the target expiration — the level that supports downside |
| Options-implied floor | $389.64 | Bottom of the ±2.9% move priced into September 25 |
| Swing support | $383.60 | Next structural shelf below the put wall, outside the implied range |
| Gamma flip level (estimate) | ≈ $353.00 | One rough estimate of where market-maker hedging would start amplifying selling — far below spot |
One disagreement worth naming: the September 25 expiration's own walls sit wide, at $390 and $420, while the whole chain aggregated across all sixteen covered expirations piles its heaviest call and put open interest at the same $400 strike. The wide pair is the map for this week; the $400 cluster is why the pin case below has teeth.
Positioning and unusual flow
One rough estimate of dealer positioning puts the chain in a positive gamma regime, where market-maker hedging tends to dampen moves rather than amplify them, with the flip level estimated far below spot at about $353. The September 25 expiration's own estimate agrees — also positive. Treat both as estimates built on an assumed dealer sign convention, not observed inventory.
Three live flow items stood out, none of them expired:
- September 25 $410 calls — 2,685 contracts traded against 2,201 open, with open interest up 946 on the day and about $389,000 of premium changing hands. That is the largest premium print in the target expiration outside the at-the-money strikes, and it sits right on the chain's second-heaviest gamma strike.
- September 21 $395 puts — 4,573 contracts traded against just 161 open, a turnover ratio above 28×. Short-dated downside protection bought in size, three days before it expires.
- September 23 $390 puts — 2,665 contracts against 73 open. Same story, same level as the target expiration's put wall: someone wanted a floor at $390 and paid for it.
Those last two are the concrete expression of the skew number above. They are hedges with a short fuse, not a directional campaign.
3 · Technical check
Both chart models lean bullish, and both do so with explicit caveats. The near-term model (target September 22) puts GLD at $403.50 inside a projected $394.50–$408.50 band, citing a fresh MACD crossover, a bullish EMA13/EMA34 stack, and RSI recovering through 57 — while flagging a deeply negative Chaikin Money Flow reading of −0.25 as evidence the bounce is running on thin conviction. The 6-day model (target September 25) extends that to $405.50 within a $393.50–$410.50 band, with support at $397.00 and resistance at $407.50, and adds that price remains well below the 200-day average at $416.22, making this a corrective bounce inside a larger downtrend rather than a reversal.
Classified against the options read, that is Mixed. Direction runs against the defensive short-dated skew in the chain, but both targets and both projected bands sit comfortably inside the options-implied $389.64–$412.70 corridor — the two data sets disagree about direction while agreeing almost exactly about magnitude. The chart model's reference price of $401.23 is within a nickel of the options snapshot's $401.17, so there is no data-date mismatch to discount.
Model vs. Market: The options market implies $389.64–$412.70 into September 25; the 6-day technical model targets $405.50. The gap is not about how far GLD travels — it is about which half of the corridor it spends the week in, and the chain's own short-dated protection bid is the only thing arguing for the lower half.
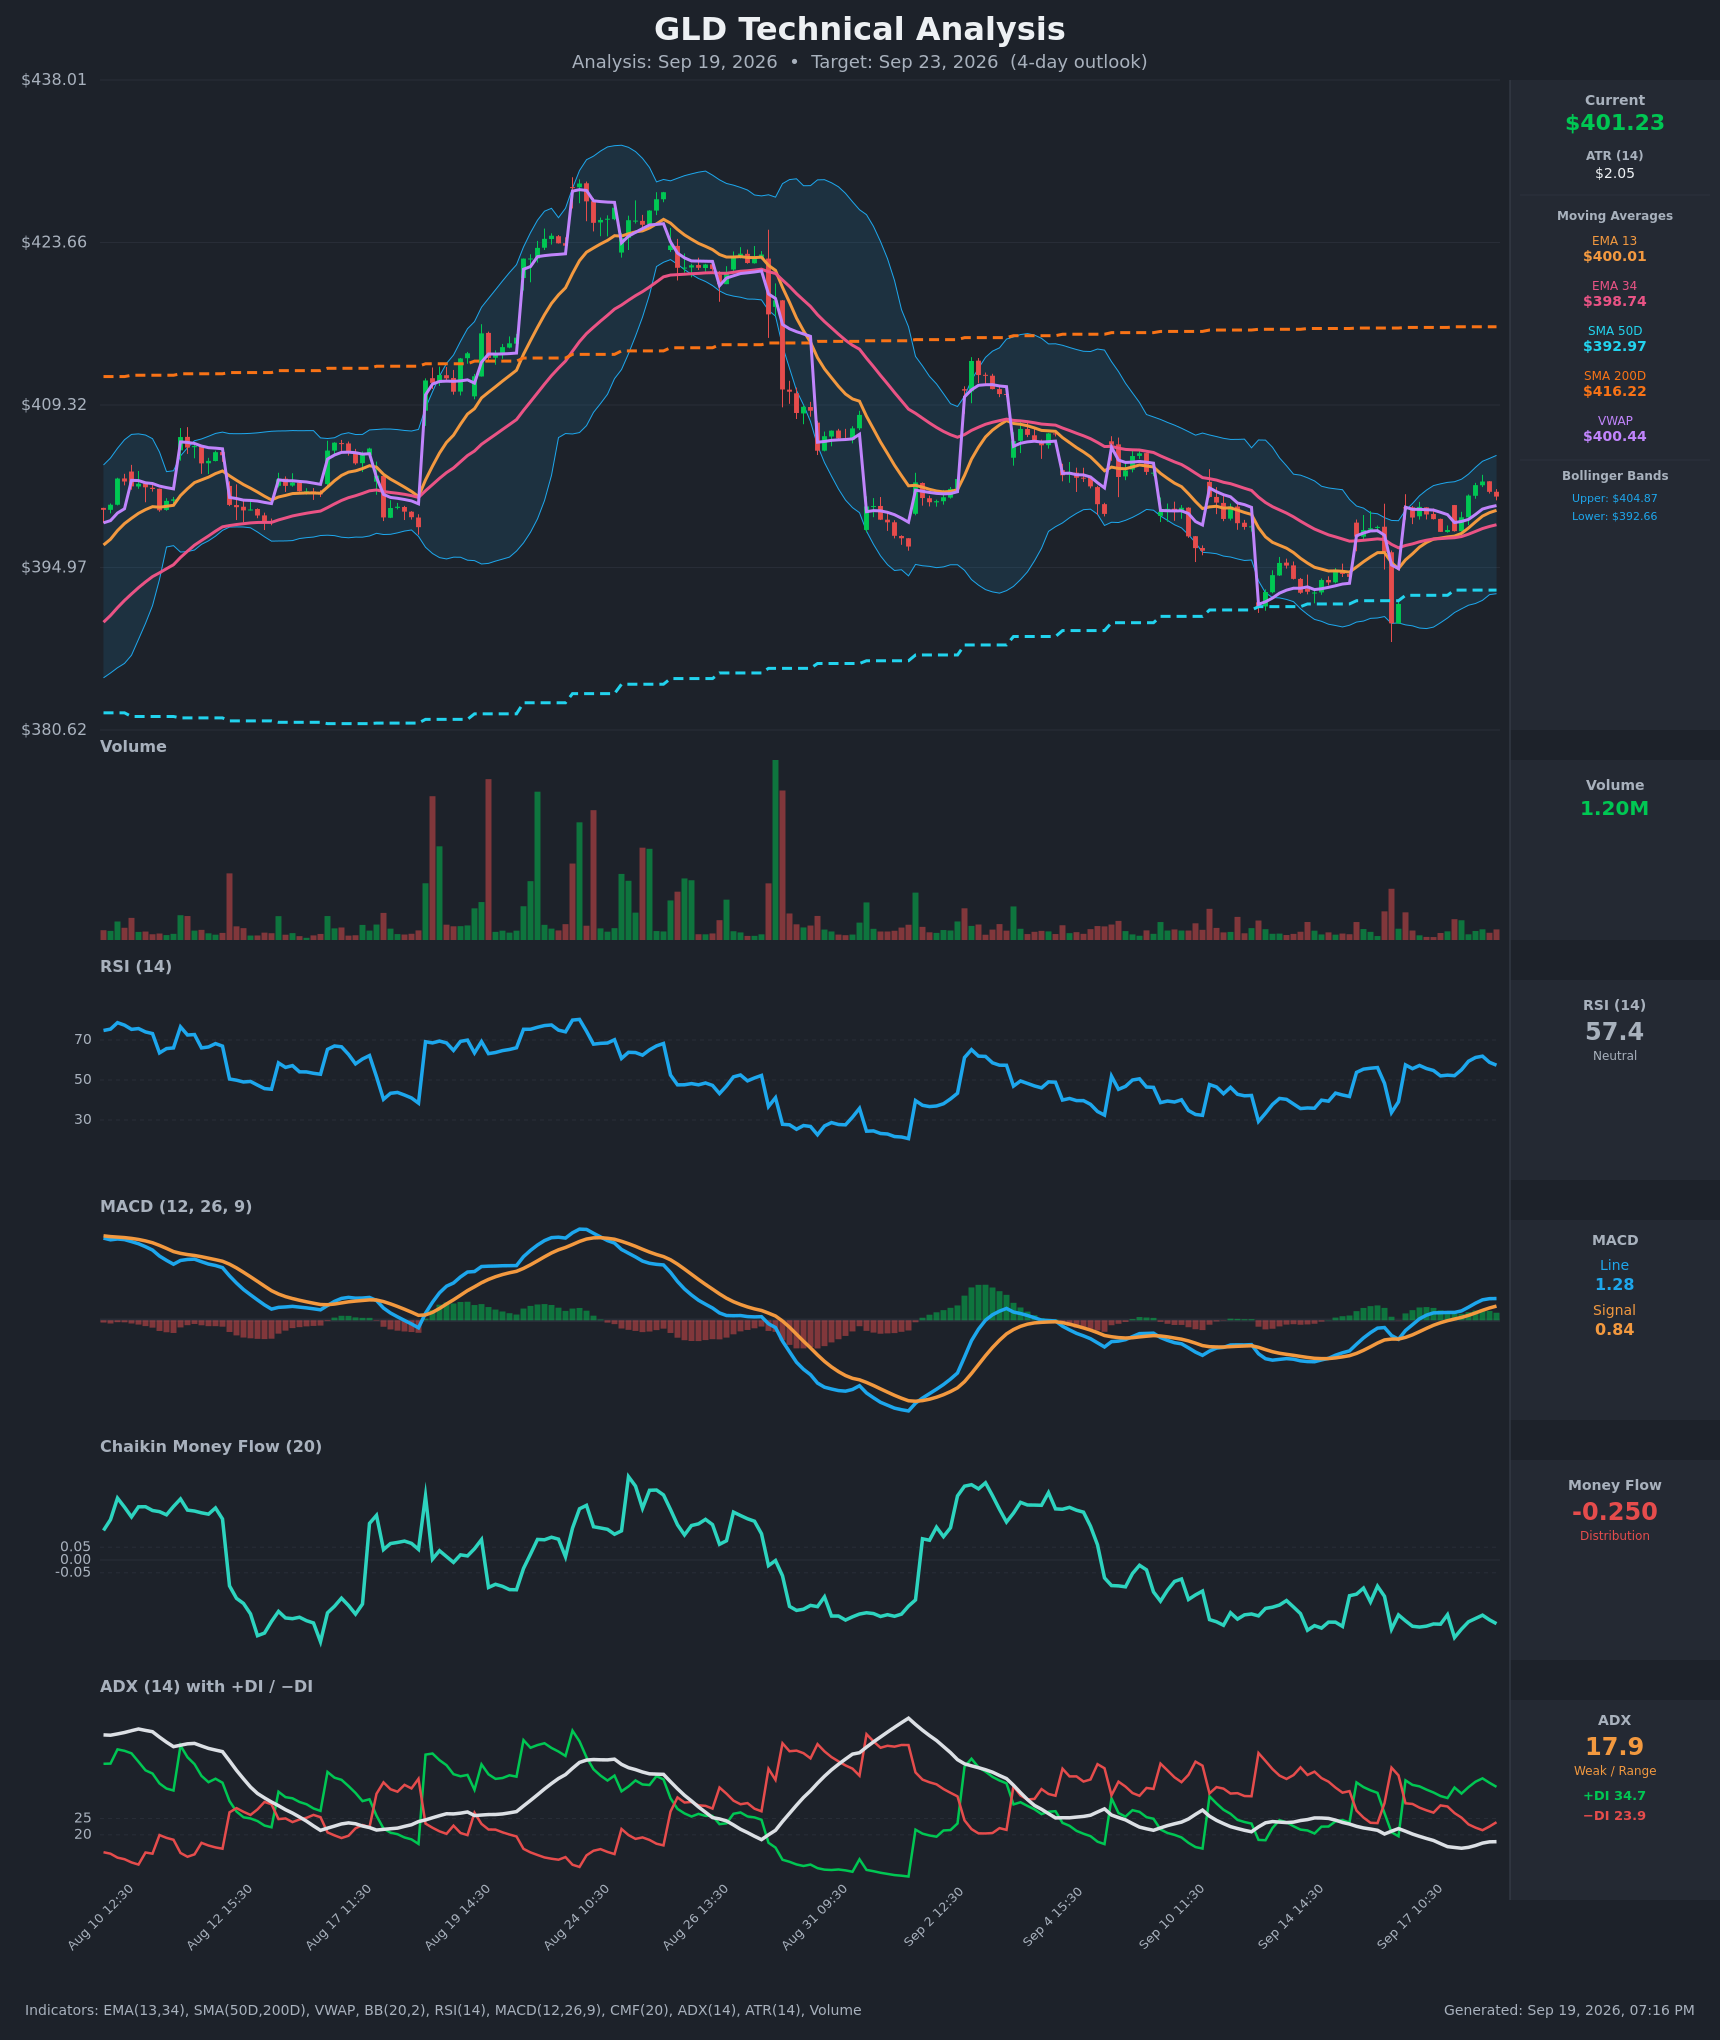
Practically, the technicals nudged strike selection rather than the bias: the featured bullish structure's short strike is shaded to $407, just under the 6-day model's $407.50 resistance and the $406.62 20-day average, rather than out at the $410 gamma cluster.
Full technical write-ups: 3-day report → · 6-day report →
4 · Three ways the next six days can go
If GLD pushes above the call wall ($420): that is a long way from here — it sits above the top of the options-implied range, so getting there would require the chain to be badly mispricing the week. The realistic version of this branch is a push through $412.70 and into the thin zone between the $410 gamma cluster and the $420 wall, where positioning thins out and rallies historically travel faster before the heaviest call open interest starts acting as a brake.
If GLD drifts between the walls: this is the base case the positioning supports. Max pain for September 25 is $400, a dollar below spot; the whole chain's single heaviest strike, on both calls and puts, is also $400; and that strike carries more total gamma than any other by a factor of more than two. With the dealer-gamma estimate in positive territory, hedging flows into expiration tend to lean against moves rather than extend them. A week that oscillates between roughly $397 and $407 and settles near $400 would surprise nobody looking at this chain.
If GLD breaks below the put wall ($390): that is the branch the skew steepening is paying for. Below $390 the next structural shelf is $383.60, and the options-implied floor at $389.64 is already behind you. Worth noting honestly: the file's own gamma-flip estimate sits near $353, far below spot, so this data does not place GLD near the fragile side where market-maker hedging would amplify selling — a break of $390 would be a price-structure event, not a positioning cascade.
5 · Three defined-risk structures
Prices are end-of-day midpoints as of 2026-09-18. All structures are hypothetical. Verify live prices before trading — these will be stale by the open.
Because premium is running below delivered movement, the two debit structures lead here and the credit structure comes last with a warning attached. Reminder on mechanics: with a debit spread you pay cash up front and need the move; with a credit spread you collect cash up front and need the move not to happen.
If you lean bullish: September 25 $400/$407 call debit spread
- Trade: Buy the September 25 $400 call, sell the September 25 $407 call
- Debit: $3.03 · Max profit: $397.50 · Max loss: $302.50 · Break-even: $403.03
- Why it fits: IV rank 20/100 and a premium running 3.8 vol points below delivered movement make this a week to buy optionality rather than sell it, and the $407 short strike sits just under the 6-day chart model's $407.50 resistance and the $406.62 20-day average. The break-even at $403.03 is below both chart targets ($403.50 and $405.50).
- Makes sense only if: you weight the chart models and the thinning put open interest over the one-day skew spike.
- Invalidated if: GLD closes below $398.79 (first swing support) — the structure still has time value, but the thesis is gone.
- Managing it: the short- and medium-term trend reads are flat while only the longest is up, which argues for shorter-dated risk and earlier profit-taking — take roughly 50–60% of max value if GLD tags $405–$406 early in the window rather than holding for expiration.
- Liquidity note: the $400 calls quoted 15¢ wide on $816,000 of premium traded; the $407 calls quoted 14¢ wide. Both fill easily.
- Analyze this position →
If you lean bearish: September 25 $400/$395 put debit spread
- Trade: Buy the September 25 $400 put, sell the September 25 $395 put
- Debit: $1.61 · Max profit: $339.00 · Max loss: $161.00 · Break-even: $398.39
- Why it fits: this is the cheap way to take the same side the skew spike took. Buying the spread rather than selling a call spread means you own the volatility the chain is currently underpricing, and the $395 short strike sits above the $390 put wall, so the structure pays out fully before it reaches the level where the heaviest put open interest would start providing support.
- Makes sense only if: you read the 5.3-point skew steepening as informed positioning rather than reflexive hedging.
- Invalidated if: GLD closes above $407.18 (swing resistance).
- Managing it: max pain at $400 and the chain's heaviest gamma strike at the same level mean this trade needs to work quickly; take profits on a move into the $394–$396 area and don't hold a losing version into the final two sessions.
- Liquidity note: the $400 puts quoted 10¢ wide (3.1% of mid) on $283,000 of premium; the $395 puts quoted 10¢ wide. Clean.
- Analyze this position →
If you expect the range to hold: September 25 $390/$395/$408/$413 iron condor
- Trade: Sell the $395 put, buy the $390 put, sell the $408 call, buy the $413 call — all September 25
- Credit: $1.83 · Max profit: $182.50 · Max loss: $317.50 · Break-evens: $393.18 and $409.83
- Why it fits: the short strikes sit inside the implied $389.64–$412.70 corridor but outside both chart models' targets, the long put leg sits exactly at the expiration's $390 put wall, and max pain at $400 is almost dead center between the two break-evens. In a positive-gamma estimate regime, pinning behavior into expiration is the most common outcome.
- Health warning: you're selling premium that hasn't been rich lately — the chain is pricing about 3.8 vol points less movement than GLD has actually delivered over the past twenty sessions, and IV rank is 20/100. That is the opposite of the condition this structure wants. Size it smaller than you otherwise would, or skip it.
- Makes sense only if: you believe the 10-day realized volatility reading of 19.48% — well below the 20-day's 24.55% — is the better forecast of the coming week than the 20-day figure the premium comparison uses.
- Invalidated if: GLD closes below $390.00 or above $410.00.
- Managing it: close at roughly 50% of max credit; exit regardless with two sessions to run, since gamma risk dominates theta at this duration. If either short strike closes in the money, close rather than hope.
- Liquidity note: the $395 puts quoted 10¢ wide and the $390 puts 6¢; the $408 calls are the widest leg at 14¢ and the $413 calls 7¢. Work the mid on entry — four legs at these spreads means slippage compounds.
- Analyze this position →
If none of these: no trade
Standing aside is a perfectly defensible read of this snapshot. The directional evidence genuinely cancels: a defensive skew reading versus call-tilted volume and thinning put open interest, chart models pointing up versus a fund still 3.62% below its 200-day average. And the premium condition removes the fallback that usually rescues a directionless week — with IV rank at 20/100 and options priced below delivered movement, selling premium is being paid below fair compensation for the movement this fund has actually produced, which is exactly why the condor above carries a warning rather than top billing. If you don't have a view on whether the skew spike is signal or reflex, there is no edge here worth $300 of defined risk. Waiting for a close outside $390 or $412.70 — where the map genuinely changes — costs nothing.
6 · Quick FAQ
What is GLD's expected move into September 25? About ±$11.53, or ±2.9%, around the $401.17 close — a $389.64–$412.70 range, derived from what at-the-money option premium costs as of September 18.
Is GLD expected to go up or down over the next six days? Options positioning as of September 18 reads Neutral — the price of downside protection jumped sharply while actual contract flow leaned the other way — but that's a read of what traders have done, not a forecast. The actionable map is the $389.64–$412.70 range and the $390/$420 levels.
Are GLD options expensive right now? No, on both lenses. IV rank of 20/100 says option prices are lower than roughly 80% of the past year's readings; on top of that they're running about 3.8 vol points below the movement GLD has actually delivered over the past twenty sessions — thinner than about three-quarters of this fund's own recent readings. That favors owning premium over collecting it.
Where is GLD's biggest options support and resistance? For the September 25 expiration, the put wall is $390.00 (7,897 contracts of put open interest) and the call wall is $420.00 (3,543 calls). Across all expirations combined, the heaviest single strike on both sides is $400.00.
What invalidates this week's read? A close below $390.00.
Methodology & disclosures. Data: end-of-day options-chain snapshot for GLD, 2026-09-18, generated 2026-09-19T19:16:02.424Z. Prices shown are midpoints and will differ from live markets. Momentum/positioning scores and volatility-premium comparisons are descriptive measurements of past option flow and past price movement — not investment advice, signals, forecasts, or guarantees. All trade structures are hypothetical. Every structure shown has a defined maximum loss; you can lose the entire max-loss amount. Options involve substantial risk and are not suitable for all investors.