GOOGL Options Are Pricing a $14 Move Through September 21 — The Stock Has Been Delivering Far Less
The options market implies a $324.18–$352.82 range for GOOGL into the September 21 expiration, but realized movement over the past month has been unusually quiet for this name. Here's what the positioning shows, the levels that matter, and three defined-risk ways to trade it.

The options market implies a $324.18–$352.82 range into the September 21 expiration; here's what's driving it and three defined-risk ways to trade it.
Published Monday, September 14, 2026 · Data as of Friday, September 11 close
Explore the live GOOGL options data in the Detailed Options Analyzer →
Quick answer
| Item | Answer |
|---|---|
| Market bias | Slightly bullish |
| Spot (Sept 11 close) | $338.50 |
| Options-implied range (into Sept 21) | $324.18 – $352.82 (±4.23%, or about ±$14.32) |
| Major support | $325.00 (put wall, Sept 21 expiration) |
| Major resistance | $360.00 (call wall, Sept 21 expiration) |
| Max pain (Sept 21) | $330.00 |
| Dealer gamma regime (estimate) | Positive on the whole-chain estimate — hedging tends to dampen moves; flip level ≈ $350 |
| Volatility condition | Falling — IV rank 12/100 · premium rich: options priced about 8.5 vol points above delivered movement |
| Technical check | Confirms (bullish, 4-day and 7-day chart models) |
| Best-fitting strategy | Sept 21 $330/$325 put credit spread |
| Analysis invalidated if | GOOGL closes below $330 |
1 · What matters today
GOOGL closed Friday, September 11 at $338.50 after a sharp one-day bounce, and the options chain leans gently in the bulls' favor: call open interest built hard across the middle of the curve while put open interest thinned, and our read of options flow tilts slightly bullish as a result. The options market is pricing a move of about ±$14.32 — roughly 4.2% — over the next seven days, putting the range at $324.18 to $352.82 into the September 21 expiration. That expiration's heaviest put open interest sits at $325 and its heaviest call open interest at $360, with max pain (the price where the most option value would expire worthless) at $330. Both short-dated chart models also read bullish, which supports the lean rather than driving it. A close below $330 kills this read.
2 · What the options market is pricing
What changed this week
The stock itself went nowhere pleasant: GOOGL is down 1.16% over the past five sessions and 2.26% over the past 20, and it gapped down 1.98% on September 9 before Friday's rally closed that gap. Underneath, positioning moved the other way. The put/call open-interest ratio — how many put contracts are held open for every call — fell from 0.66 to 0.58 over five days, against a 14-day average of 0.69: traders have been letting downside protection expire rather than replacing it. Friday's put/call volume ratio of 0.32 was the lightest put participation in weeks (the 7-day average is 0.37, the 14-day 0.41), on total option volume running 1.74× its 20-day norm.
The single biggest open-interest change in a live expiration was 39,111 contracts added to the September 18 $400 calls — but those trade at a 6-cent midpoint, so that build is lottery tickets and tail hedges, not conviction. The build that carries money behind it is the October 2 $355 calls, which added 14,363 contracts of open interest on 5,033 lots and about $1.7 million of premium traded. Into Friday's expiration, the settled $330 calls shed 6,695 contracts as they went out worthless — history, not a live level.
One counterweight worth naming: the short-, medium-, and long-horizon trend reads are all flat, with price down 6.3% over roughly the past 50 sessions even as flow has turned call-heavy. Momentum did cross back to the bullish side on September 8, but it is a fresh, low-strength crossover in a market that has been chopping for two months. That argues for short-dated structures and early profit-taking, not for pressing a trend.
Expected move
The expected move is the move the options market is pricing in — derived from what straddles cost. Into September 21, that is ±4.23% of spot, or about ±$14.32, giving a $324.18–$352.82 band around Friday's $338.50 close.
| Expiration | Implied move | Range around $338.50 |
|---|---|---|
| Friday, September 18 | ±3.84% | $325.50 – $351.50 |
| Monday, September 21 (our horizon) | ±4.23% | $324.18 – $352.82 |
| Friday, September 25 | ±5.17% | $321.00 – $356.00 |
| Friday, October 2 | ±6.63% | $316.06 – $360.94 |
The rungs step up smoothly with time — no kink, no event hump anywhere in the ladder. Nothing in the chain's pricing suggests a dated catalyst inside this window; the curve is just the ordinary square-root-of-time widening.
Volatility
At-the-money implied volatility — the market's estimate of how much GOOGL will move, baked into option prices — sits at 27.9%. IV rank is 12/100, meaning today's reading is cheaper than 88% of the past year's; the percentile read is even lower at 8. IV fell 5.1% on Friday alone and is down 11.1% over 30 days, running below both its 30-day average (29.1%) and its 90-day average (32.3%). The front-month read is unavailable today — Friday was an expiration day, and front-month volatility can't be interpolated from a contract expiring the same session — so there's no clean term-structure comparison to quote.
Against this stock's own recent history, realized movement has been unusually depressed: 20-day realized volatility of 19.4% is well below anything GOOGL has delivered lately. The last week has started to wake up, though — five-day realized movement is running about 29% hotter than the 20-day pace, above its own norm.
Premium: rich. The volatility risk premium — the gap between how much movement options are priced for and how much GOOGL has actually delivered — stands at about 8.5 vol points in the sellers' favor. When it's positive, option sellers have been collecting more than realized movement cost them. That gap is richer than roughly 97% of this stock's own recent readings, and it flipped from negative to positive in late August as realized volatility drained away. So the two lenses say different things and both are true: option prices are cheap versus the past year (IV rank 12), but generous versus what the stock has actually been doing. On balance that combination favors collecting premium over owning it this week — with the caveat that the recent pickup in realized movement is the thing that would close the gap fastest.
Skew and sentiment
Skew measures whether puts and calls the same distance from the stock price cost the same — when puts are pricier, traders are paying up for crash protection. Here they aren't. The 25-delta put is priced at 28.24% versus 28.36% for the equivalent call, so puts are running about 0.1 vol points below calls, against a 60-day norm of puts running roughly 0.25 points above. Downside protection is unusually cheap for this name — complacency, not fear.
Sentiment across the curve tells a consistent story. Our read of short-dated options positioning scores the 0–7 day bucket at just +10 (it averaged +38 over the past week, so the very front end cooled on Friday), while the 7–30 day bucket — the one covering our September 21 horizon — reads +52, its strongest in two weeks. The longer buckets sit at +42 and +47. The summary phrase for that shape is a bullish recovery: positioning is building further out on the curve rather than in the immediate front. Two "vs its own norm" readings back it up — Friday's call-side open-interest build (call OI +95,374 against put OI −23,288) was unusually large for this stock, and the call tilt in volume was unusually pronounced.
The key levels map
| Level | Price | Why it matters |
|---|---|---|
| 52-week high | $408.61 | 17.2% overhead; not in play this week |
| Whole-chain heaviest call strike | $400.00 | 97,319 calls open across all expirations, mostly far-dated tail bets — not the Sept 21 level |
| Swing resistance | $374.81 | Prior consolidation shelf |
| Call wall (Sept 21) | $360.00 | Heaviest call open interest for our expiration — the level that caps upside, though the OI behind it is thin |
| Swing resistance | $358.08 | Heuristic swing cluster |
| Top of implied range | $352.82 | Upper rail of the Sept 21 expected move |
| Gamma flip estimate / heavy call OI | $350.00 | One rough estimate puts the hedging pivot here; also the chain's second-largest gamma strike (49,267 calls open) |
| 50-day moving average | $347.18 | 2.5% above spot — the trend line the chart models want reclaimed |
| Swing resistance / heavy gamma | $345.52 | Cluster of swing highs plus a large gamma strike at $345 |
| Largest gamma strike (chain-wide) | $340.00 | Biggest single concentration of gamma across all expirations — a natural magnet |
| 20-day moving average | $341.06 | 0.75% above spot |
| Spot (Sept 11 close) | $338.50 | Reference for everything above and below |
| 200-day moving average | $336.81 | Reclaimed on Friday; 0.5% below spot |
| Swing support / gap zone | $331.51 | Sept 9 gap-down open was $331.65; that gap closed Friday |
| Max pain (Sept 21) / chain-wide put wall | $330.00 | Where the most option value expires worthless for our expiration, and the heaviest put strike across the whole chain (36,929 contracts) |
| Put wall (Sept 21) | $325.00 | Heaviest put open interest for our expiration — the level that supports downside |
| Bottom of implied range | $324.18 | Lower rail of the Sept 21 expected move |
| Swing support | $314.90 | Deeper structural shelf |
One honest caveat on the walls: September 21 is a light, non-standard expiration. Its own call wall at $360 carries 276 contracts and its put wall at $325 carries 180 — real levels for that expiration, but nothing like the magnets sitting at $330, $340, $345 and $350 when you sum the whole chain. Where the two disagree, the chain-wide clusters are the heavier gravity.
Positioning and unusual flow
Market makers hedge the options they've sold, and in a positive-gamma regime that hedging tends to dampen moves rather than amplify them. The whole-chain estimate reads positive, and the September 21 expiration's own estimate also reads positive — but at a magnitude near zero, meaning that expiration is too thin to steer anything on its own. The same estimate places the flip pivot near $350, above Friday's close, which on that reading leaves GOOGL on the side where hedging is less cushioning. Treat both as estimates built on an assumed dealer sign convention, not observed inventory; spot sits about 3.4% below that pivot, which is about typical distance for this stock.
Three flow items are worth naming. The September 16 $345 calls traded 7,808 contracts against 587 open — more than thirteen times the existing position, a fresh short-dated upside bet. The October 2 $355 calls saw about $1.7 million of premium change hands with open interest jumping to 15,263 from 900. And on our own expiration, the September 21 $355 calls printed 286 lots against 52 open and the $365 calls 122 against 19 — small in absolute terms, but the only genuinely unusual activity in that expiration, and it's on the call side.
3 · Technical check
Both chart models read bullish, and both land inside the options-implied band — so the technical read confirms the options lean rather than fighting it. The 4-day model targets $343.50 by September 18 with a projected range of $331.50 to $347.00, citing a MACD crossover, a trend-strength gauge that has pushed above its threshold with buyers in control, and persistent accumulation in its money-flow read. It calls support at $335.00 and resistance at $343.00, with its dominant scenario invalidated on a daily close back below $335.
The 7-day model, which lands exactly on our September 21 horizon, targets $344.50 inside a $330.00–$349.00 projected range, with support at $333.00 and resistance at $347.00 — the 50-day average being the line it wants reclaimed for a fuller trend reversal. Its reference price of $338.42 is within a rounding error of the options snapshot's $338.50, so the two data sets are describing the same market.
Model vs. Market: The options market implies $324.18–$352.82 into September 21; the 7-day technical model targets $344.50 inside a narrower $330.00–$349.00. The chart model expects less travel than the options are charging for — which is the same message the premium-richness read gives, from a different direction.
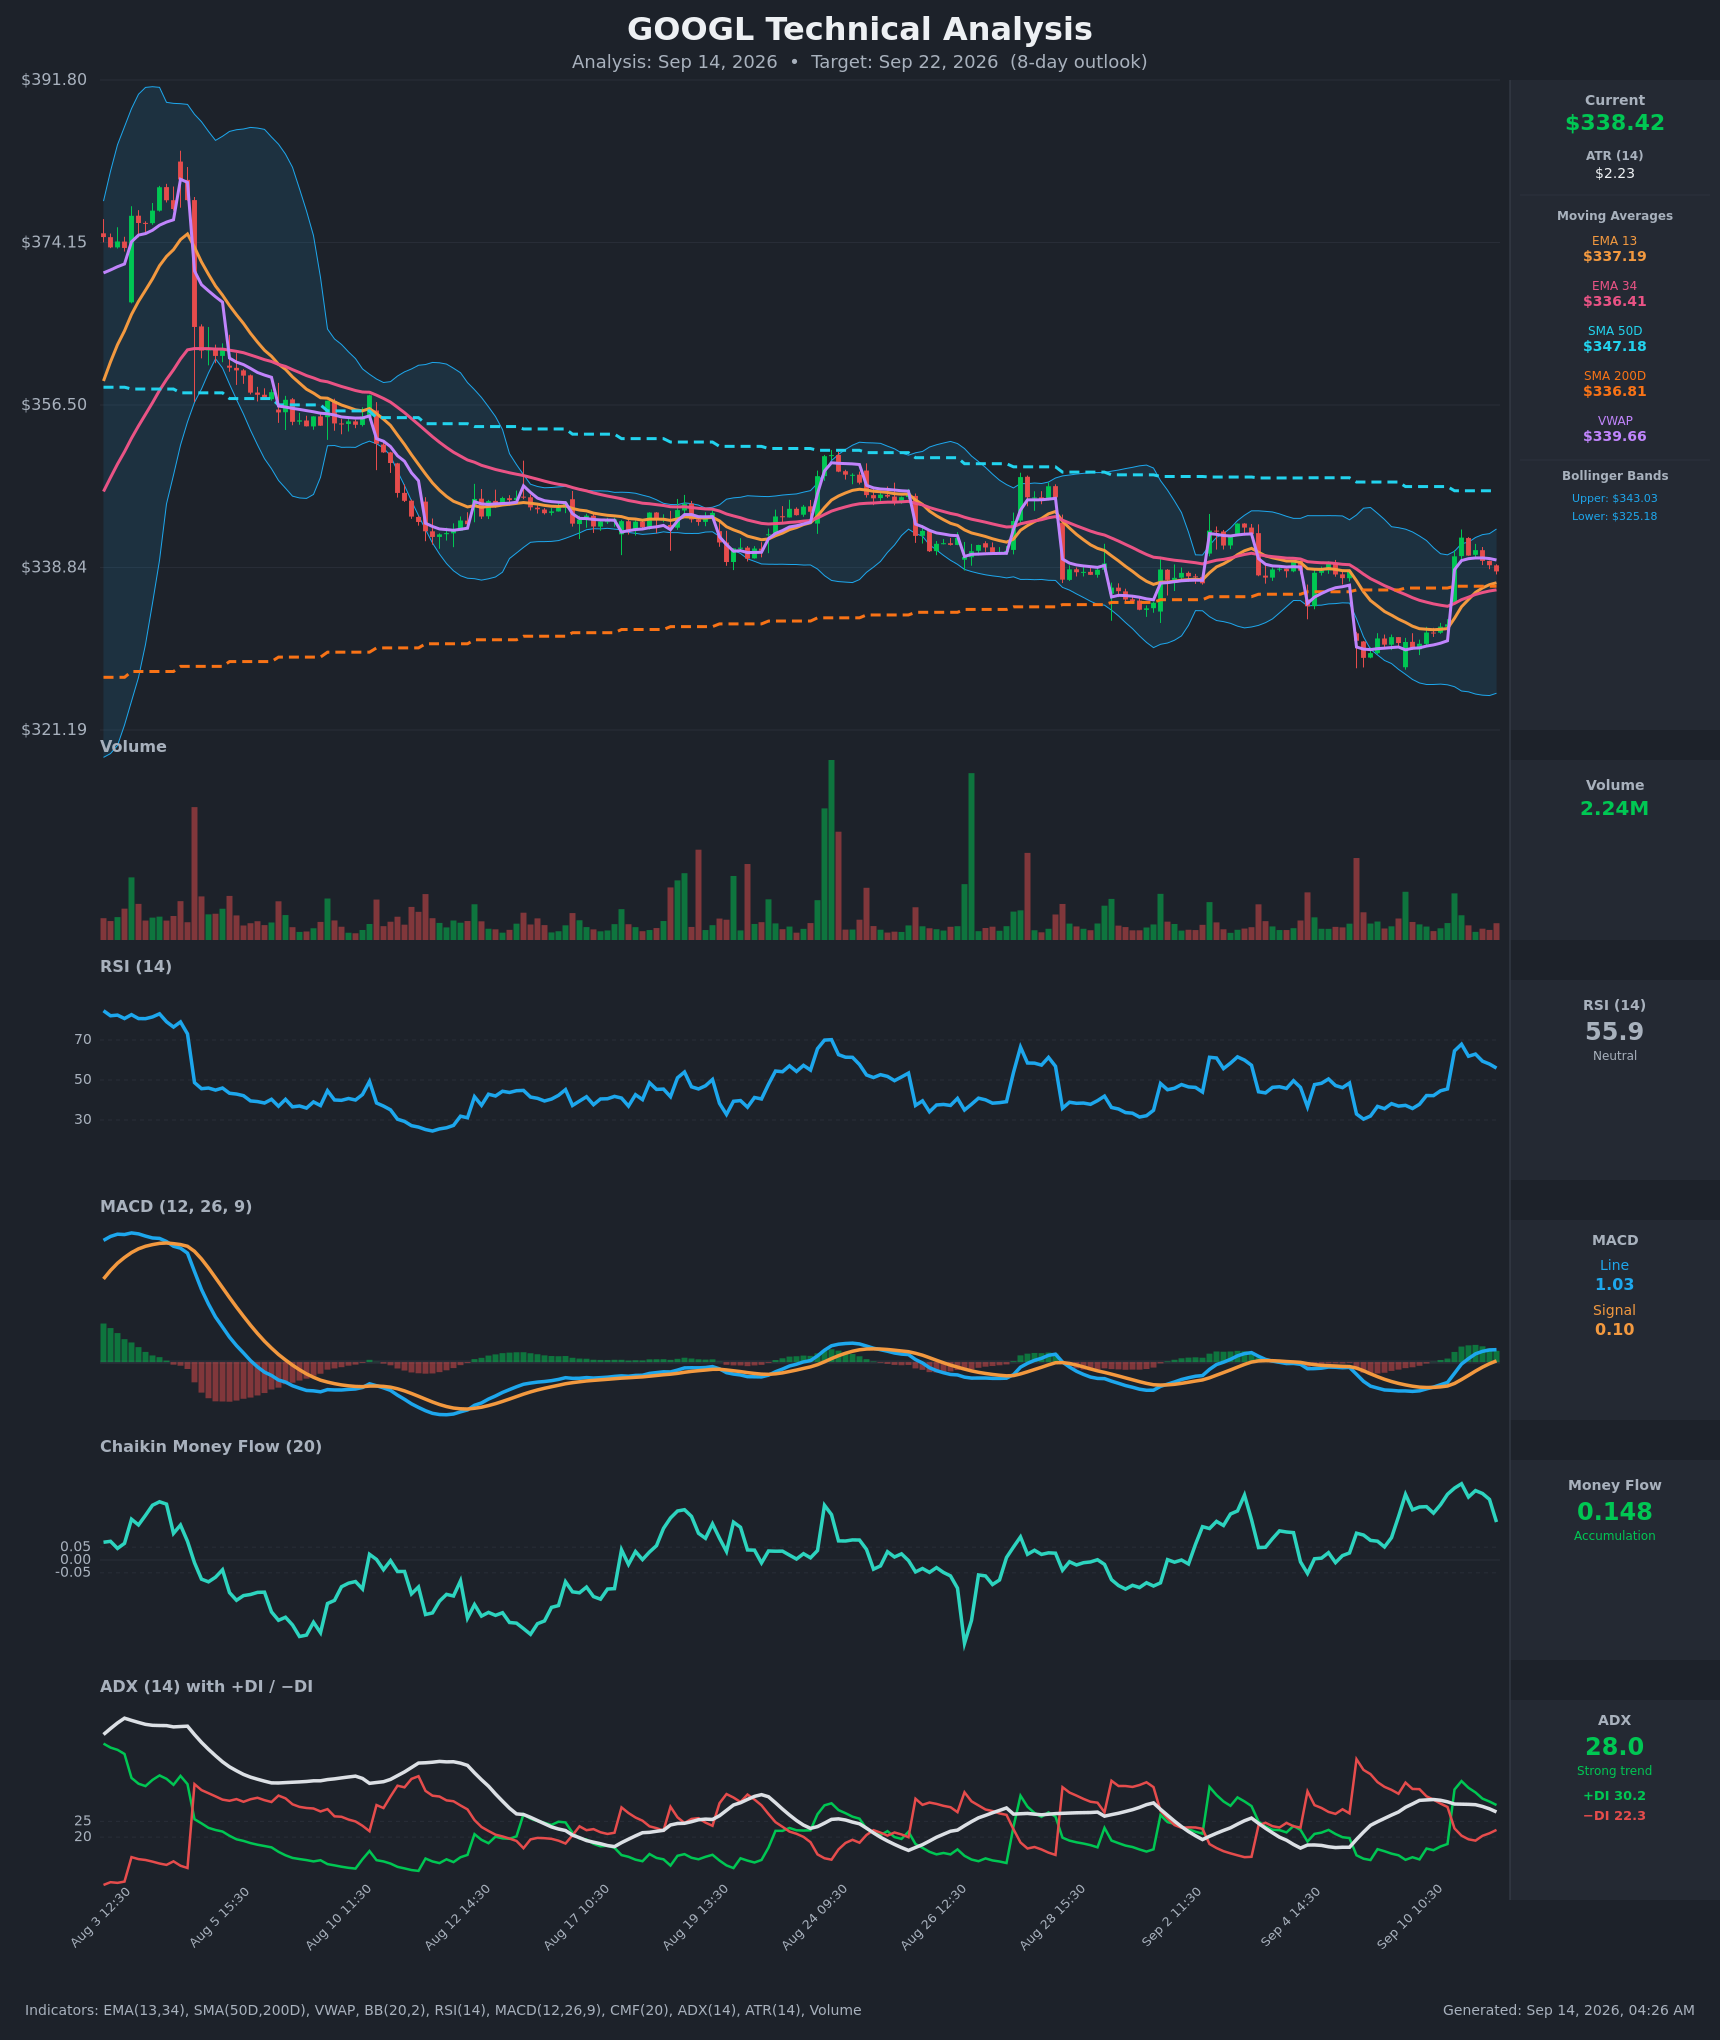
The practical effect on strikes below: the technical support cluster at $333–$335 sits just above our short put strike at $330, and the technical resistance at $347 sits just below the $350 gamma pivot — so the chart work nudged both short strikes outward rather than inward.
Full technical write-ups: 4-day report → · 7-day report →
4 · Three ways the next seven days can go
If GOOGL pushes above the call wall ($360): that is a 6.3% move and sits above the top of the implied range, so it would require something the options market is not currently pricing. The heavier friction arrives well before it — the $350 strike carries the chain's second-largest gamma concentration and the 50-day average at $347.18 sits right under it. Positioning suggests rallies get slower through $345–$350, not faster.
If GOOGL drifts between the walls: this is the path the positioning describes best. Max pain for September 21 is $330, the chain's heaviest gamma sits at $340, and the dealer-hedging estimate reads positive — a combination that historically produces chop rather than trend. A week spent oscillating between $330 and $347 would be entirely consistent with what the chain looks like today, and it is the outcome that pays every structure below.
If GOOGL breaks below the put wall ($325): that takes out the bottom of the implied range and the expiration's own put support in one move. Below $330 the put open interest across the whole chain gets heavy fast (36,929 contracts at that strike alone), and the fresh call-side builds described above become trapped positions that get unwound. Spot is already below the $350 flip estimate, so on that rough estimate there's no positive-gamma cushion waiting on the way down.
5 · Three defined-risk structures
Prices are end-of-day midpoints as of Friday, September 11. All structures are hypothetical. Verify live prices before trading — these will be stale by the open.
Premium is rich relative to what GOOGL has actually delivered, so all three structures below collect credit rather than pay it. A credit spread means you take money in up front and keep it if the stock stays on your side of the short strike; your loss is capped at the distance between strikes minus that credit.
If you lean bullish: put credit spread
- Trade: Sell the September 21 $330 put, buy the September 21 $325 put
- Credit: ~$0.95 ($2.24 − $1.29 midpoints) · Max profit: $95 · Max loss: $405 · Break-even: $329.05
- Why it fits: The short strike sits exactly at max pain for this expiration and just above the put wall at $325, with the chain's heaviest put concentration also at $330. You're selling premium that is running about 8.5 vol points above delivered movement — the richest that gap has been versus this stock's own recent readings.
- Makes sense only if: you believe the September 8 momentum turn and the call-side open-interest build hold for another seven sessions.
- Invalidated if: GOOGL closes below $330.
- Managing it: Close at roughly 50% of max credit; exit regardless by Friday, September 18 rather than carrying the last three days of gamma risk into expiration. With the longer-horizon trend flat to down, take the profit early rather than holding for the last nickel. If GOOGL closes through $330, close it — don't hope.
- Liquidity note: The $330 put is quoted $1.96/$2.52 (56¢ wide, about 25% of mid) and the $325 put $0.93/$1.65. September 21 is a thin expiration — work a limit near the mid and expect to give up a few cents; the September 18 chain is dramatically tighter if fills won't come.
- Analyze this position →
If you expect the range to hold: iron condor
- Trade: Sell the September 21 $325 put / buy the $320 put, and sell the September 21 $355 call / buy the $360 call
- Credit: ~$0.90 ($0.575 put side + $0.325 call side) · Max profit: $90 · Max loss: $410 · Break-evens: $324.10 and $355.90
- Why it fits: The short strikes sit on the expiration's own put wall ($325) and just above the top of the implied range ($352.82), with the long call at the $360 call wall. The dealer-hedging estimate reads positive chain-wide, which is the regime where price tends to get pinned rather than trend, and both chart models project a range narrower than what options are charging.
- Makes sense only if: you want the premium-richness edge without taking a directional view — this is the structure that best matches a rich volatility risk premium and a flat multi-horizon trend.
- Invalidated if: GOOGL closes below $325 or above $355.
- Managing it: Close at ~50% of max credit, or close the threatened side alone if one wing goes to work; exit both sides by September 18.
- Liquidity note: All four legs are wide — the $355 calls are quoted $0.76/$1.12 and the $320 puts $0.55/$0.88. Enter as a single four-leg order at a limit, never leg by leg, and be prepared to walk away if the fill isn't near the mid.
- Analyze this position →
If you lean bearish: call credit spread
- Trade: Sell the September 21 $350 call, buy the September 21 $355 call
- Credit: ~$0.80 ($1.735 − $0.94 midpoints) · Max profit: $80 · Max loss: $420 · Break-even: $350.80
- Why it fits: $350 is the estimated hedging pivot and the chain's second-heaviest gamma strike, with the 50-day average at $347.18 sitting just underneath as an additional brake. It also expresses the one genuinely bearish fact in this file: price is down 6.3% over roughly the past 50 sessions while flow has turned call-heavy, and that divergence has to resolve somewhere.
- Makes sense only if: you think Friday's bounce was a gap-fill and the stock stalls into the 50-day average.
- Invalidated if: GOOGL closes above $350.
- Managing it: Close at ~50% of max credit; exit by September 18. This one fights the slight bullish lean in the positioning data, so size it smaller and don't argue with it if the stock reclaims $347.
- Liquidity note: The $350 calls are quoted $1.50/$1.97 and the $355 calls $0.76/$1.12 — again wide for this expiration; a limit order near the mid is mandatory.
- Analyze this position →
If none of these: no trade
There is a real case for standing aside even with premium this rich. The September 21 expiration is thin — every leg above quotes 10% to 50% wide, and on a $90 max-profit condor, two bad fills eat a third of the edge before the trade has a chance. The richness is also partly an artifact of an unusually quiet month: 20-day realized volatility of 19.4% is depressed for this name, and the last five sessions have already started running about 29% hotter than that. If realized movement keeps normalizing, the gap you're selling closes against you rather than in your favor. If you want the premium-selling trade without the slippage tax, the September 18 chain is far more liquid for the same thesis minus one trading day — and if the spreads won't fill near the mid, no trade genuinely beats a bad fill.
6 · Quick FAQ
What is GOOGL's expected move over the next week? About ±$14.32, or ±4.23%, into the September 21 expiration — a $324.18–$352.82 range around Friday's $338.50 close, per the options market's straddle pricing as of September 11.
Is GOOGL expected to go up or down over the next week? Options positioning as of September 11 leans slightly bullish — call open interest built by more than 95,000 contracts while put open interest fell, and the 7–30 day sentiment read is at its strongest in two weeks — but that's a read of what traders have done, not a forecast. The actionable map is the $324.18–$352.82 range and the $325/$360 levels.
Are GOOGL options expensive right now? Two answers, both true. IV rank of 12/100 says option prices are lower than 88% of the past year's readings. But they're running about 8.5 vol points above the movement GOOGL has actually delivered over the past month — richer than roughly 97% of this stock's own recent readings. Cheap versus the year, rich versus reality, which on balance favors selling premium this week.
Where is GOOGL's biggest options support and resistance? For the September 21 expiration: the put wall is $325 and the call wall is $360. Across the whole chain, the heaviest put strike is $330 and the biggest gamma concentration is $340.
What invalidates this week's read? A close below $330.
Methodology & disclosures. Data: end-of-day options-chain snapshot for GOOGL, 2026-09-11, generated 2026-09-14T04:26:51.151Z. Prices shown are midpoints and will differ from live markets. Momentum/positioning scores and volatility-premium comparisons are descriptive measurements of past option flow and past price movement — not investment advice, signals, forecasts, or guarantees. All trade structures are hypothetical. Every structure shown has a defined maximum loss; you can lose the entire max-loss amount. Options involve substantial risk and are not suitable for all investors.