GOOGL Options Outlook: Spot Sits on the $350 Call Wall With ±$13.77 Priced In
Google's options market implies a $335.77–$363.31 range into the September 25 expiration, with spot parked exactly on that expiration's heaviest call strike and premium running about 6.8 vol points above what the stock has actually delivered. Here's the level map and three defined-risk ways to trade it.
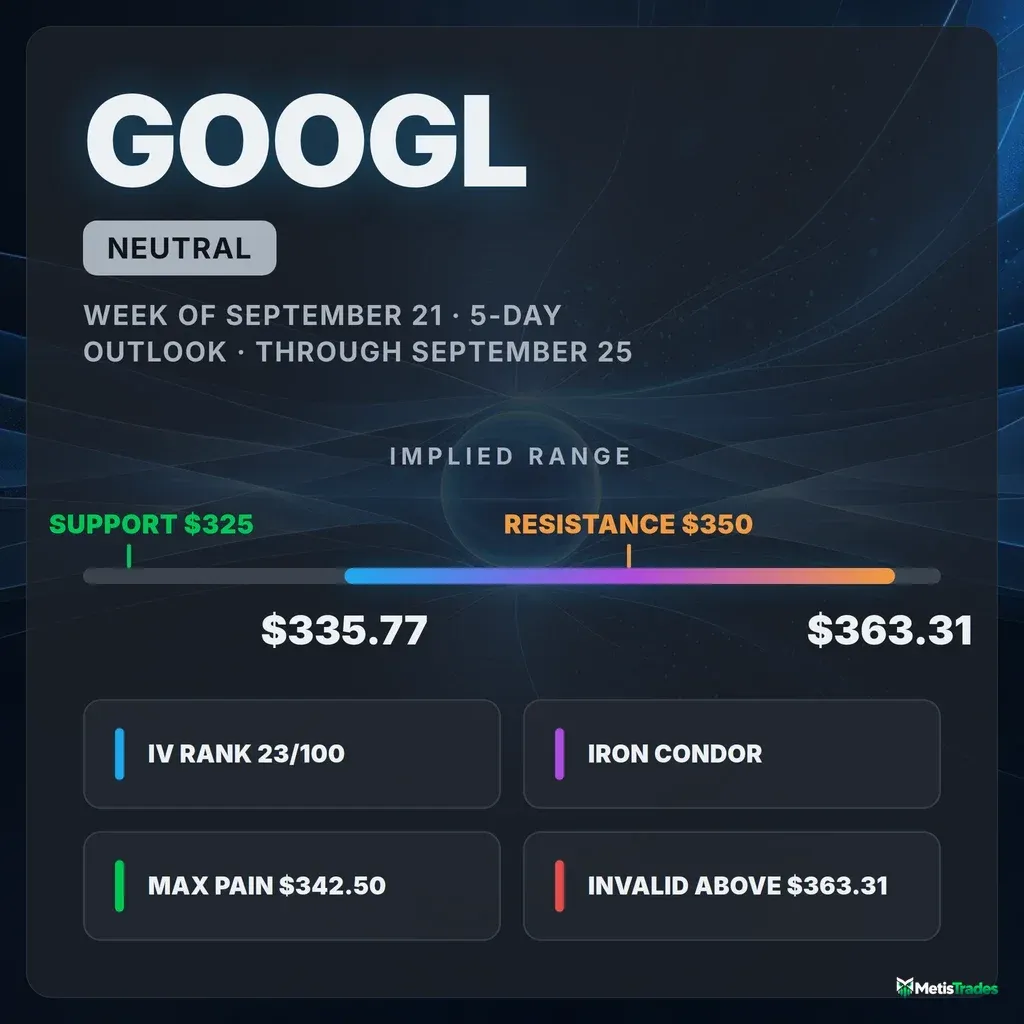
The options market implies a $335.77–$363.31 range into the September 25 expiration; here's what's driving it and three defined-risk ways to trade it.
Published Sunday, September 20, 2026 · Data as of Friday, September 18, 2026 close
Explore the live GOOGL options data in the Detailed Options Analyzer →
Quick answer
| Item | Answer |
|---|---|
| Market bias | Neutral |
| Options-implied range (into Sept 25) | $335.77 – $363.31 (±3.94%, or ±$13.77) |
| Major support | $325.00 — the heaviest put open interest at the Sept 25 expiration |
| Major resistance | $350.00 — the heaviest call open interest at the Sept 25 expiration |
| Max pain (Sept 25) | $342.50 |
| Dealer gamma regime (estimate) | Positive — hedging tends to dampen moves; flip level ≈ $355.00 |
| Volatility condition | Rising — IV rank 23/100 · premium rich: options priced ~6.8 vol points above delivered movement |
| Technical check | Mixed (bullish, 3-day and 5-day chart models) |
| Best-fitting strategy | Iron condor — sell the Sept 25 $335/$330 put spread and $360/$365 call spread, if you expect the range to hold |
| Analysis invalidated if | GOOGL closes above $363.31 |
1 · What matters today
GOOGL closed Friday, September 18 at $349.54 after a 3.3% run over five sessions — and it closed almost exactly on the strike with the most call contracts held open for the September 25 expiration, $350.00. Our read of options flow lands squarely neutral: buying pressure in calls is real, but short-dated sentiment cooled on Friday and traders paid up for downside protection at the same time. The options market is pricing a move of about $13.77 either way by Friday, September 25, which frames a $335.77–$363.31 range. Below spot, max pain — the price at which the most option value would expire worthless — sits at $342.50, and the heaviest put open interest for that expiration sits far below at $325.00. Both short-term chart models lean bullish but target $352.50–$353.00, comfortably inside that range. A close above $363.31 would break the read.
2 · What the options market is pricing
What changed this week
Price did the heavy lifting. GOOGL gapped up two sessions in a row — 1.69% on September 17 and 2.87% on September 18 — and finished the week up 3.26% over five trading days on 47.5 million shares, 1.87 times its 20-day average volume. Total option volume ran 2.3 times its own 20-day average. Positioning followed: put open interest relative to calls sits at 0.53 (for every call contract held open there are now 0.53 puts), against a 14-day average of 0.64 — puts have been thinning out for two weeks straight. Call open interest grew by 72,436 contracts on Friday alone while put open interest shed 4,196, a one-day call build that is well above this stock's own recent norm.
The single biggest forward-looking open-interest change was at the target expiration itself: the September 25 $357.50 calls added 4,893 contracts on 3,988 traded, and the $350 calls added 3,716 to become that expiration's call wall at 6,140 contracts. (Into Friday's expiration, by contrast, the settled $342.50 calls shed 5,135 contracts — history now, not a live level.) Implied volatility firmed with the rally rather than collapsing: at-the-money IV is 29.95%, up 3.38% on the day and 7.31% over five sessions, though still down 4.49% over 30. One tension worth naming: the past week's pop runs against a stock that is still down 2.6% over roughly the last 50 sessions and 14.5% below its 52-week high. The short-term trend read is bullish; the medium- and longer-term reads are flat.
Expected move
Into Friday, September 25, the options market is pricing a move of about ±3.94%, or ±$13.77 around $349.54 — that's the move derived from what at-the-money straddles cost, not a forecast. That frames a $335.77 to $363.31 range.
| Expiration | Implied move | Range around $349.54 |
|---|---|---|
| Sept 23 | ±3.11% | $338.67 – $360.41 |
| Sept 25 (our horizon) | ±3.94% | $335.77 – $363.31 |
| Sept 30 | ±5.06% | $331.85 – $367.23 |
| Oct 16 | ±8.29% | $320.56 – $378.52 |
The ladder scales smoothly — each rung steps up roughly in line with the square root of time, with no abrupt jump that would signal the market bracing for a specific dated event inside this window. Quote quality on the September 21 expiration was too poor to price that rung, so it is left out.
Volatility
At-the-money implied volatility — the market's estimate of how much GOOGL will move, baked into option prices — is 29.95%. IV rank is 23/100, meaning today's IV is cheaper than roughly 77% of the past year's readings, and the percentile read agrees at 22/100. But direction matters as much as level: current IV sits above its 30-day average of 28.5% while remaining below its 90-day average of 32.2%. It is rising off a low base, not sitting at one. The front-month read is unavailable today — Friday was a weekly expiration day, so a front-month versus 60-day comparison can't be interpolated.
Against the stock's own history, realized movement has been unusually quiet: 20-day realized volatility of 23.19% is well below this name's recent norm, even though the 5-day-versus-20-day ratio shows movement accelerating over the last week (the two gap-ups did that).
Premium rich or cheap. The volatility risk premium — the gap between how much movement options are priced for and how much GOOGL has actually delivered — is currently about 6.8 vol points positive. When that gap is positive, option sellers have been collecting more than realized movement cost them. Today's reading sits richer than about 88% of this stock's own readings over the past few months, and the gap has widened again over the past two sessions after drifting down from a mid-September peak. So the two lenses disagree in an interesting way: IV rank 23/100 says options are cheap versus the past year, while an 88th-percentile premium over delivered movement says they are rich versus what the stock has actually been doing lately. On balance that combination favors collecting premium this week rather than owning it — provided you size the structure for the fact that absolute IV is low, so a volatility expansion would hurt.
Skew and sentiment
Puts and calls the same distance from the stock price don't cost the same — when puts are pricier, traders are paying up for crash protection. Right now 25-delta puts carry 30.67% implied volatility against 29.77% for the equivalent calls: puts are running about 0.9 vol points over calls, against a 60-day median of 0.2 vol points for this name and a 7-day average of negative 0.4 (calls richer). In other words, the demand for downside protection flipped back on this week even as the stock rallied — traders bought the gap and hedged it at the same time.
Volume flow tilts the other way. Put volume relative to call volume is 0.36 — above 1 would mean puts dominate — against a 14-day average of 0.39, and that call-tilt is meaningfully stronger than this stock's own baseline. Ten call contracts versus eight put contracts cleared the peer-relative unusual-volume bar. Sentiment across expirations is best summarized as calm: the 0–7 day bucket reads mildly negative at −9, the 7–30 day bucket mildly positive at +7, and the 30–60 day bucket +14 — every reading inside ±20. That front bucket matters for the week, and it's a sharp cooldown: the same read was +48 on September 17 and averaged +25 over the past seven sessions.
The key levels map
| Level | Price | Why it matters |
|---|---|---|
| 52-week high | $408.61 | 14.5% overhead; the stock sits at the 66th percentile of its 52-week range |
| Top of 1-month implied range (Oct 16) | $378.52 | Outer rail of what the options market prices over a month |
| Swing resistance | $374.81 | Heuristic pivot cluster from recent price structure |
| Top of Sept 25 implied range | $363.31 | Upper rail for the week; a close above it kills this read |
| Sept 25 call open interest shelf | $360.00 | 3,274 calls held open; 11,933 traded Friday — active upside strike |
| 100-day moving average | $359.09 | 2.66% above spot — the one major average price is still below |
| Swing resistance | $358.08 | Next structural shelf above the call wall |
| Gamma flip level (estimate) | $355.00 | One rough estimate of where market-maker hedging behavior changes character |
| Swing resistance | $350.86 | Nearest chart resistance, essentially at spot |
| Call wall (Sept 25) | $350.00 | 6,140 calls held open — the heaviest call strike for this expiration; piles like this often act as a magnet or a brake |
| Spot (Sept 18 close) | $349.54 | Sitting directly on the call wall |
| 50-day MA / swing support | $345.58 / $345.52 | 1.15% below; the first real support shelf and the chart models' invalidation zone |
| Max pain (Sept 25) | $342.50 | Where the most option value would expire worthless — expirations sometimes gravitate toward it |
| 20-day moving average | $341.79 | 2.27% below; rising |
| Swing support | $340.27 | Pivot cluster; also the September 25 put strike with 2,389 contracts open |
| 200-day moving average | $337.50 | 3.57% below; the longer-term trend line |
| Bottom of Sept 25 implied range | $335.77 | Lower rail for the week |
| Whole-chain put wall | $330.00 | 42,689 puts across all expirations — the chain's heaviest put strike overall |
| Put wall (Sept 25) | $325.00 | 4,174 puts held open for this expiration specifically — the week's downside shelf |
Note the disagreement between scopes: across the whole chain, the heaviest call strike is $400.00 (112,618 contracts, mostly long-dated) and the heaviest put strike is $330.00. For the week that matters, the September 25 expiration's own walls are $350.00 and $325.00. Use the expiration-specific numbers for this week's map; the whole-chain figures describe where longer-dated positioning is parked.
Positioning and unusual flow
The dealer gamma estimate for the September 25 expiration reads positive, which under the model's stated assumption means market-maker hedging tends to dampen moves rather than amplify them — pinning behavior rather than acceleration. Treat that as an estimate, not observed inventory. The estimated flip level for the whole chain sits at $355.00, above spot, and GOOGL is currently about 1.6% below it — close enough that the distinction between the calm side and the fragile side is not academic this week.
Three live flow items stood out on Friday, all in the target expiration or just beyond it. The September 25 $357.50 calls added 4,893 contracts of open interest on 3,988 traded — a fresh position, not churn. The September 25 $350 calls traded 4,745 contracts for about $2.47 million in premium, the single largest dollar-premium line at that expiration, and built open interest to the 6,140 that now forms the call wall. And on the other side, the September 25 $327.50 and $325.00 puts added 1,986 and 1,316 contracts respectively — modest in size, but they are precisely what anchors the put wall down at $325.00 rather than closer to spot.
3 · Technical check (the 20%)
Both chart models run bullish, and both are fresh (generated September 20 against a $349.06 reference — within a rounding error of Friday's $349.54 close). The 3-day model targets $352.50 with a projected range of $343.00 to $357.00. The 5-day model, which lands on the same September 25 date as our options horizon, targets $353.00 with a projected range of $341.50 to $359.00. Both cite the same structure: ADX at 41.5 with +DI far above −DI, price above every major moving average, and a still-positive MACD crossover.
The most decisive dissent inside those reports is money flow. The 20-period Chaikin Money Flow reading swung to −0.302 even as price printed multi-day highs — the chart models both flag this as distribution into strength, and both name a close below $345.50 as the level that invalidates their bullish case. That's a real caution flag layered on top of an otherwise strong trend read.
Classification: mixed. The chart direction leans bullish while our options read is flat, but the magnitudes don't actually conflict — both TA targets and both TA ranges sit entirely inside the $335.77–$363.31 the options market is pricing. That is not a model-versus-market argument; it is the chart saying "drift up inside the range." It did shade strike selection below: the call side of the range structure is set at $360, above both chart targets and above the $358.08 swing resistance, rather than tucked in tighter at $355.
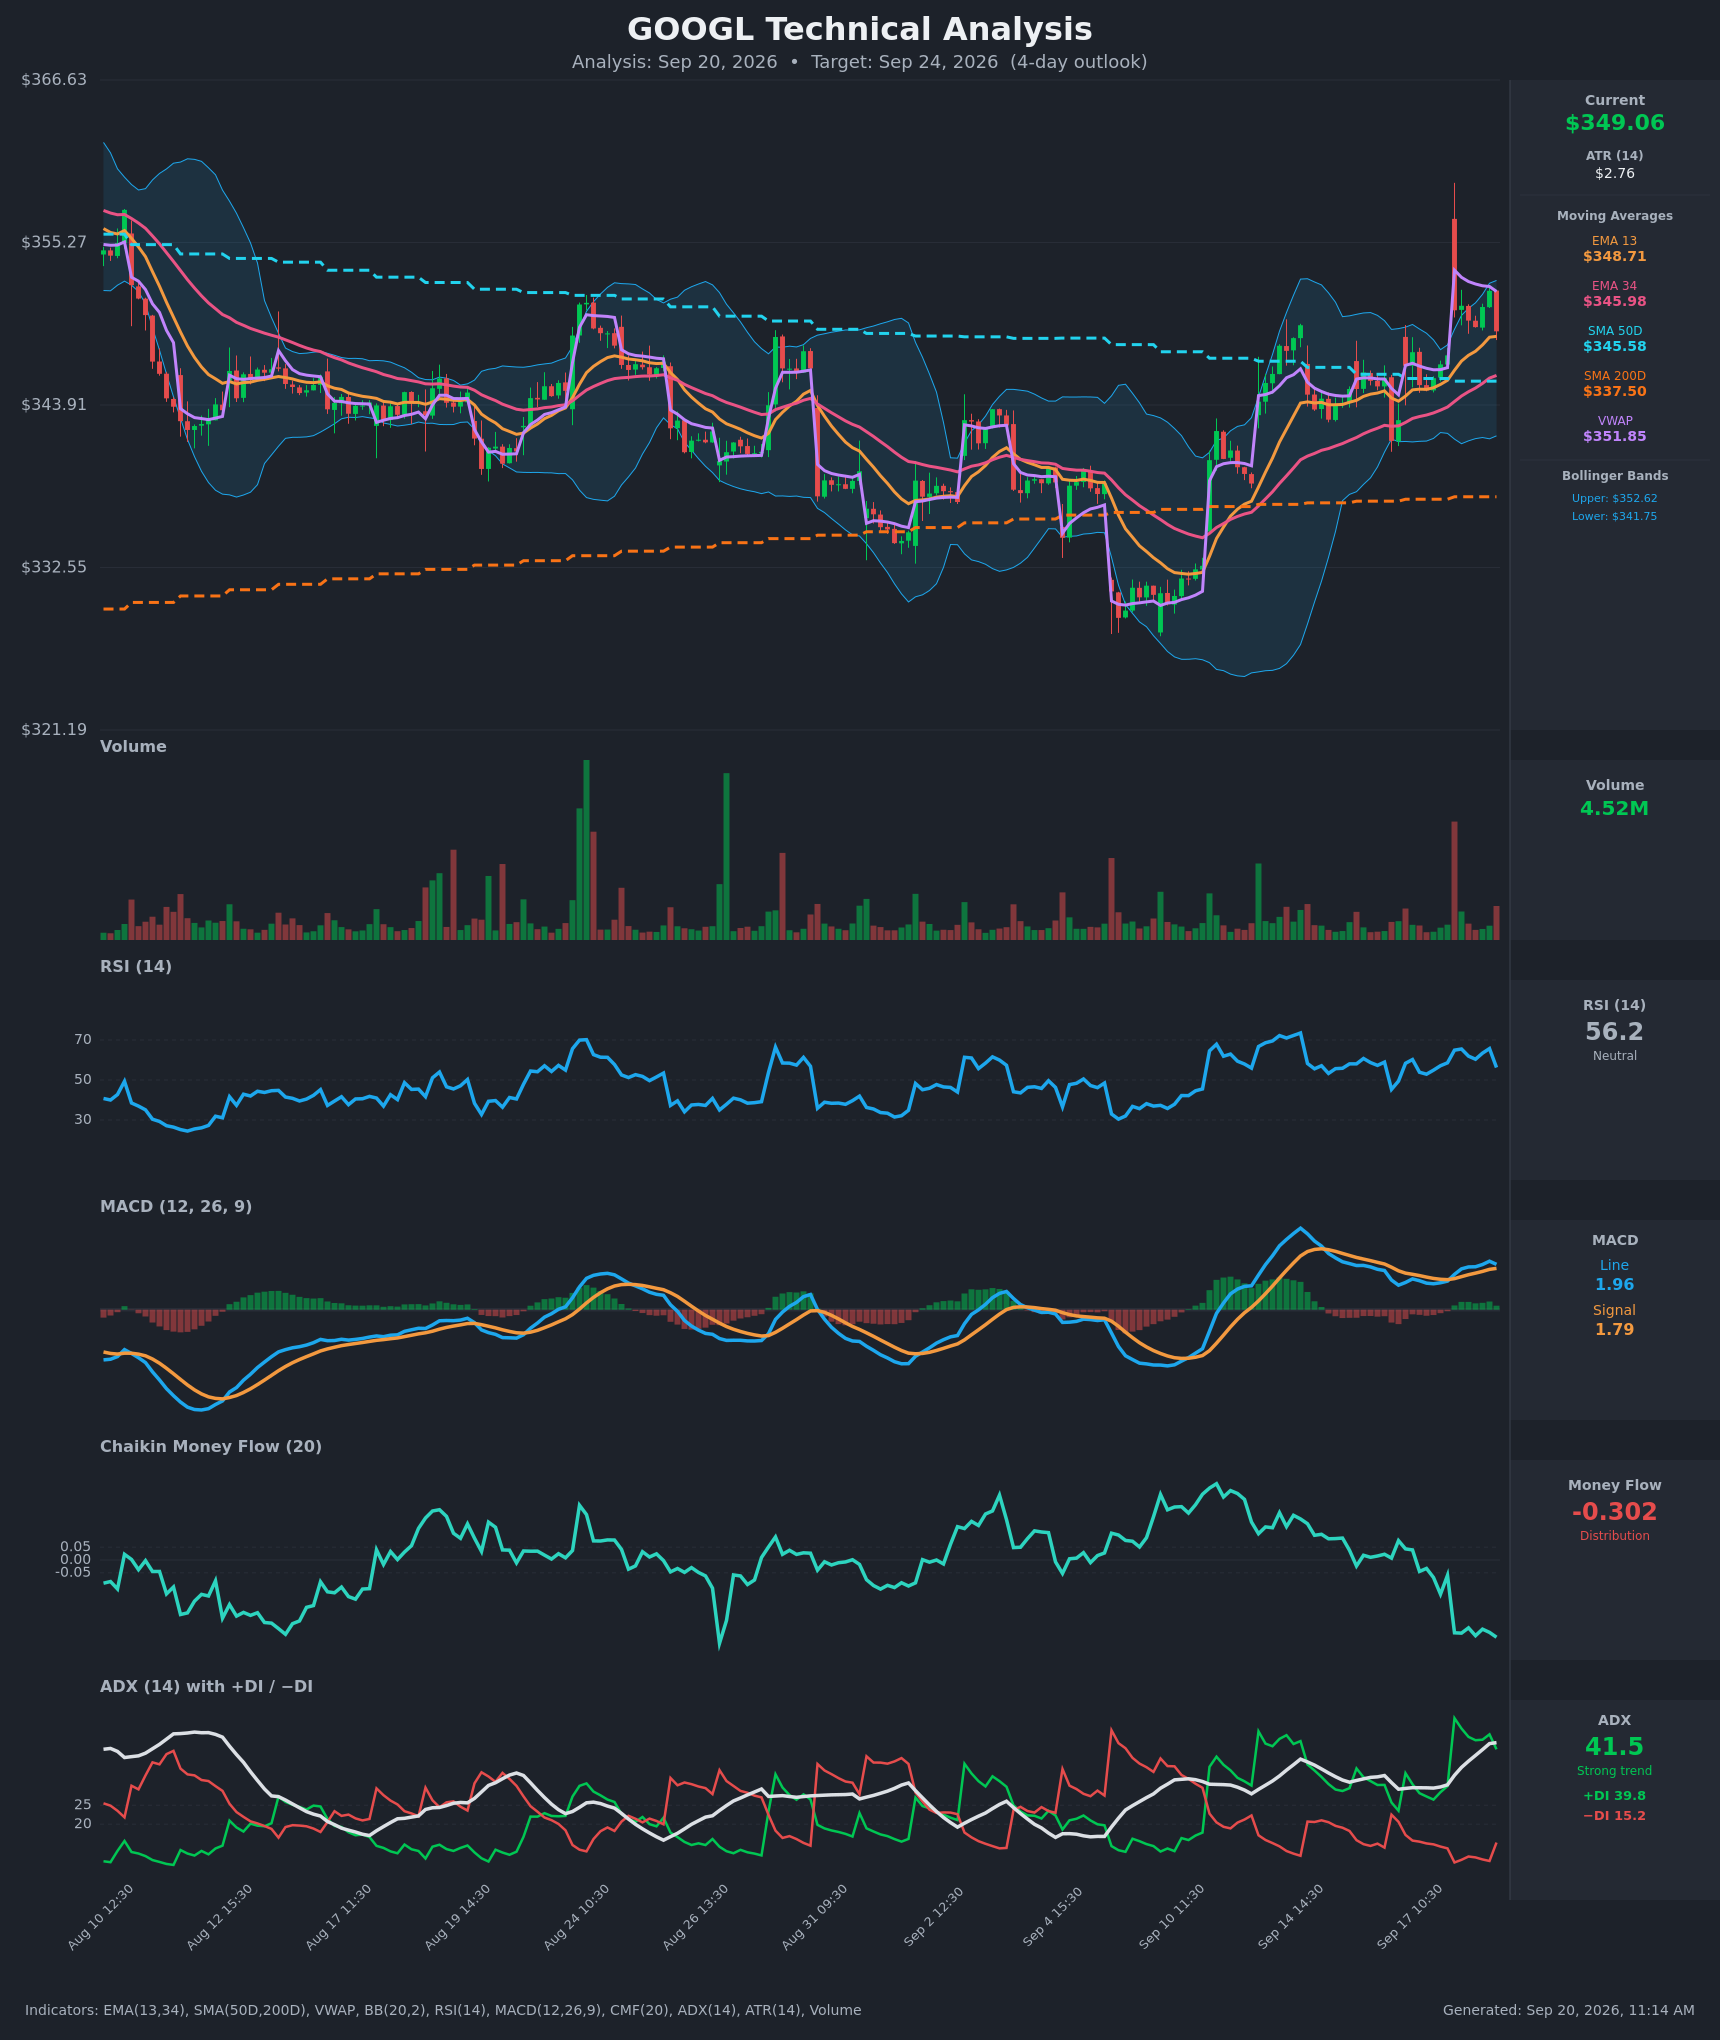
Model vs. Market: The options market implies $335.77–$363.31 into September 25; the 5-day technical model targets $353.00 within a $341.50–$359.00 band. The chart is asking for less movement than the options are charging for — which is the entire case for selling premium here rather than buying it.
Full technical write-ups: 3-day report → · 5-day report →
4 · Three ways the next five days can go
If GOOGL pushes above the call wall ($350.00): The stock is already sitting on it, so this is the live question. The heaviest call open interest overhead tends to slow rallies as the hedging that supports the strike unwinds into it. A clean push through leaves $350.86 and then $355.00 — the estimated gamma flip — as the next friction points, with thinner September 25 positioning until $357.50 and $360.00, both of which saw heavy fresh call buying Friday.
If GOOGL drifts between the walls: This is the base case the positioning supports. Max pain for September 25 sits at $342.50, seven dollars below spot, and the estimated dealer gamma regime for that expiration is positive — hedging flows that push back against moves in either direction. A drift down toward the $345.52 support shelf and the $342.50 max-pain strike, with expiring call open interest at $350 decaying, is exactly what a pinned week looks like.
If GOOGL breaks below the put wall ($325.00): That's a 7% drop, well beyond the implied range, so it would require something the current data has no footprint of. The more realistic downside path runs through $345.52 (where both chart models place their invalidation), then the 20-day average at $341.79 and swing support at $340.27. Note that spot sits about 1.6% below the estimated $355.00 flip level already — unusually close for this name — so the cushioning estimate is less reliable than the headline regime label suggests.
5 · Three defined-risk structures
Prices are end-of-day midpoints as of September 18, 2026. All structures are hypothetical. Verify live prices before trading — these will be stale by the open.
If you expect the range to hold: iron condor
- Trade: Sell the Sept 25 $335/$330 put spread and the Sept 25 $360/$365 call spread
- Credit: $1.30 · Max profit: $130 · Max loss: $370 · Break-evens: $333.70 and $361.30
- Why it fits: This is the structure the data actually argues for. Premium is running about 6.8 vol points above what GOOGL has delivered — richer than roughly 88% of its own recent readings — and the September 25 expiration is estimated to sit in a positive dealer-gamma regime where hedging dampens moves. The short put at $335 sits just below the bottom of the implied range and ten dollars above the $325 put wall; the short call at $360 sits above both chart-model targets and above the $358.08 swing resistance. Remember the mechanics: you collect the credit up front and keep all of it if GOOGL finishes between the short strikes.
- Makes sense only if: you accept that absolute IV is low (rank 23/100), so a genuine volatility expansion hurts this position before price even moves.
- Invalidated if: GOOGL closes above $363.31 (or below $333.70, the lower break-even).
- Managing it: Close at roughly 50% of max credit; exit regardless by Wednesday, September 23 if neither side has decayed, because the last two days carry the sharpest gamma risk. If GOOGL closes through either short strike, close rather than hope. The short-term trend is up while the 50-day picture is flat — that argues for taking profits early rather than pressing for the last dime.
- Liquidity note: the $335 puts quote 14¢ wide and the $330 puts 7¢; the $360 calls quote 15¢ wide on 11,933 contracts traded and the $365 calls 13¢. In percentage terms the wings are wider than 5% of mark, so work the order as a package rather than legging in.
- Analyze this position →
If you lean bullish: short put spread
- Trade: Sell the Sept 25 $340/$335 put credit spread
- Credit: $0.90 · Max profit: $90 · Max loss: $410 · Break-even: $339.10
- Why it fits: You collect a credit and keep it as long as GOOGL stays above $340 — you're betting against a drop, not for a rally. The $340 short strike sits below the $342.50 max-pain strike, below the $345.52 support shelf where both chart models place their invalidation, and above the 200-day average at $337.50. Skew is currently working in your favor: puts are 0.9 vol points richer than calls versus a 0.2-point norm, so you are selling the side traders are paying up for.
- Makes sense only if: you read the two gap-ups and the heavy call building as a genuine trend change rather than a one-week pop against a flat two-month tape.
- Invalidated if: GOOGL closes below $345.52.
- Managing it: Close at ~50% of max credit; exit regardless by Wednesday, September 23. If the stock closes below $345.52, close the spread — that's the level the chart models themselves treat as the trend break, and waiting for $340 to be tested costs you most of the remaining credit.
- Liquidity note: the $340 puts traded 1,099 contracts and quote 14¢ wide (about 7% of mark); the $335 puts quote 14¢ on 850 traded. Acceptable, but don't pay the ask.
- Analyze this position →
If you lean bearish: short call spread
- Trade: Sell the Sept 25 $355/$360 call credit spread
- Credit: $1.32 · Max profit: $132 · Max loss: $368 · Break-even: $356.33
- Why it fits: The $355 short strike sits above the $350 call wall and at the estimated gamma flip level — the two pieces of overhead friction the week has. You collect the credit and keep it if GOOGL fails to clear $355 by Friday. The 5-day chart model's own target of $353.00 sits below this strike, which is the cleanest expression of "the chart wants a drift, not a breakout."
- Makes sense only if: you read the negative money-flow divergence the chart models flagged as distribution into strength rather than noise, and you're willing to be short the side that just saw heavy fresh call buying.
- Invalidated if: GOOGL closes above $358.08.
- Managing it: Close at ~50% of max credit; exit regardless by Wednesday, September 23. This is the structure fighting the short-term trend, so take profits early and don't average into it.
- Liquidity note: the $355 calls are the best fill on the board for this expiration — 10¢ wide (3.1% of mark) on 6,463 contracts traded. The $360 calls quote 15¢ wide on 11,933 traded.
- Analyze this position →
If none of these: no trade
The premium-selling case is real but narrow, and it deserves an honest counterargument. IV rank at 23/100 means absolute option prices are cheap versus the past year — the 88th-percentile richness is relative to a period in which GOOGL barely moved, and 20-day realized volatility of 23.19% is itself well below this stock's own recent norm. Sell premium into that setup and you are collecting a thin absolute credit while carrying real exposure to volatility simply normalizing. Layer on the fact that the stock just gapped up twice in two sessions on 1.87 times average volume, that spot sits about 1.6% below the estimated gamma flip, and that the $130 max profit on the condor comes against $370 of risk, and standing aside is a defensible call. If you don't have a view on whether $350 caps this move or breaks, waiting for either a clean rejection at $350.86 or a close above $358.08 costs you nothing but a week of theta you were never going to collect much of anyway.
6 · Quick FAQ
What is GOOGL's expected move this week? About ±$13.77, or ±3.94%, into the September 25 expiration — a $335.77 to $363.31 range around Friday's $349.54 close, per the options market's straddle pricing as of September 18.
Is GOOGL expected to go up or down over the next five days? Options positioning as of September 18 reads neutral — call buying and thinning put open interest pull one way while a steeper put skew and a cooling short-dated sentiment read pull the other — but that's a description of what traders have done, not a forecast. The actionable map is the $335.77–$363.31 range plus the $325.00 and $350.00 levels.
Are GOOGL options expensive right now? Two lenses, two answers. IV rank 23/100 says option prices are lower than about 77% of the past year's readings; on top of that, they're running roughly 6.8 vol points above the movement GOOGL has actually delivered — richer than about 88% of this stock's own recent readings. Net: rich relative to recent realized movement, cheap in absolute terms, which favors defined-risk credit structures over naked short premium.
Where is GOOGL's biggest options support and resistance? For the September 25 expiration, the put wall is $325.00 and the call wall is $350.00. Across the whole chain those shift to $330.00 and $400.00 respectively — use the expiration-specific numbers for this week.
What invalidates this week's read? A close above $363.31.
Methodology & disclosures. Data: end-of-day options-chain snapshot for GOOGL, 2026-09-18, generated 2026-09-20T11:14:29.823Z. Prices shown are midpoints and will differ from live markets. Momentum/positioning scores and volatility-premium comparisons are descriptive measurements of past option flow and past price movement — not investment advice, signals, forecasts, or guarantees. All trade structures are hypothetical. Every structure shown has a defined maximum loss; you can lose the entire max-loss amount. Options involve substantial risk and are not suitable for all investors.