GOOGL Options Outlook: Will the $350 Call Wall Cap the Upside Into October 2?
GOOGL options price a $330.37–$357.47 range into the October 2 expiration. Positioning leans slightly bullish, but the heaviest call open interest sits at $350. Here is the level map and three defined-risk ways to trade it.
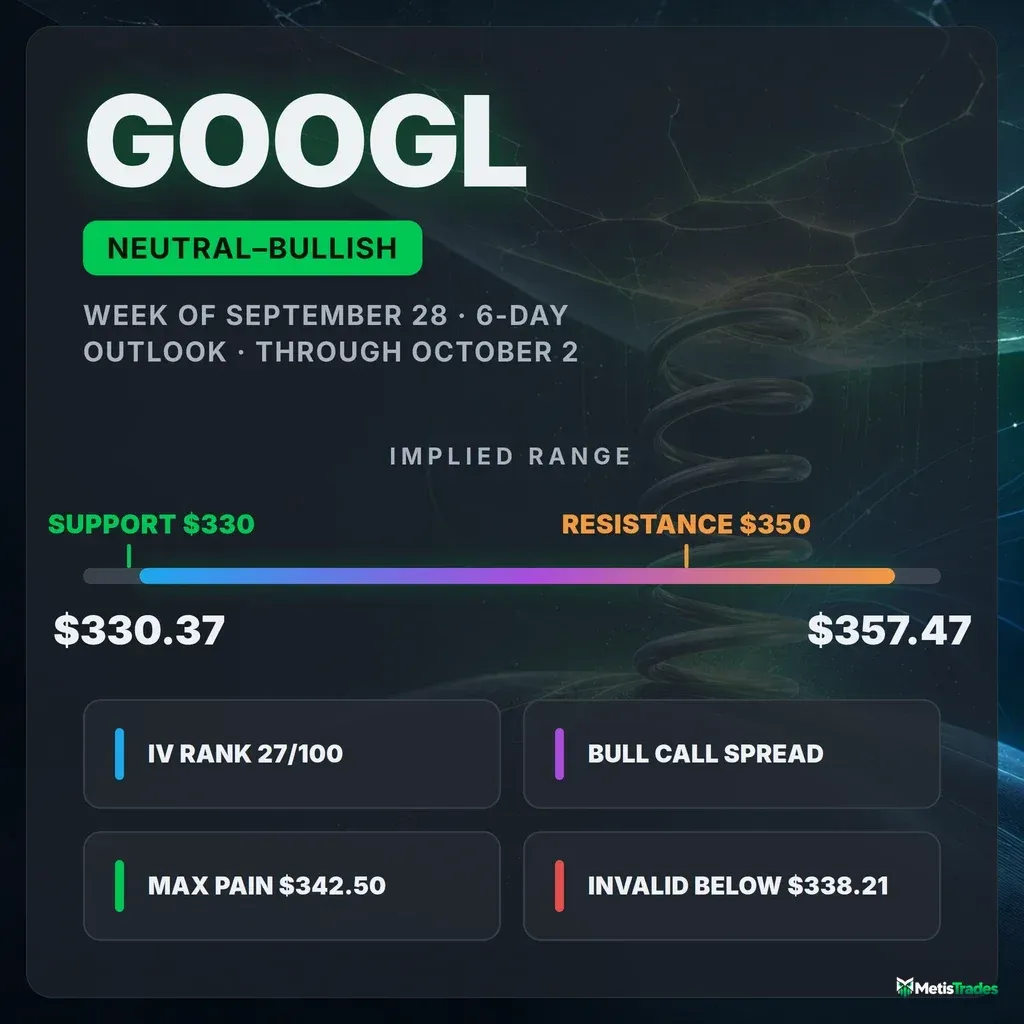
The options market implies a $330.37–$357.47 range into October 2. Here's what's driving it, where the walls sit, and three defined-risk ways to trade it.
Published Saturday, September 26, 2026 · Data as of Friday, September 25, 2026 close
Explore the live GOOGL options data in the Detailed Options Analyzer →
Quick answer
| Item | Answer |
|---|---|
| Market bias | Slightly bullish |
| Options-implied range (into October 2) | $330.37 – $357.47 (±3.94%, ±$13.55) |
| Major support | $330.00 (October 2 put wall) |
| Major resistance | $350.00 (October 2 call wall) |
| Max pain (October 2) | $342.50 |
| Dealer gamma regime (estimate) | Positive: hedging tends to dampen moves. The flip level is ≈ $360, and that estimate sits above spot, so treat the cushion as thin. |
| Volatility condition | Rising from low levels. IV rank 27.41/100. ATM IV 30.87%. Premium is fair: options are priced about 3.5 vol points above delivered movement. |
| Next earnings | October 28 (after close), well after the October 2 expiration |
| Technical check | Confirms. Both chart models are bullish: the 3-day targets $346.00 (model range $338.00–$350.00) and the 6-day targets $347.50 (model range $335.50–$351.50). |
| Best-fitting strategy | October 2 $345/$350 bull call spread (only while GOOGL holds above $338.21) |
| Analysis invalidated if | GOOGL closes below $338.21 |
1 · What matters today
GOOGL closed Friday at $343.92. Options positioning leans slightly bullish. Traders have been adding call contracts much faster than puts, and near-dated call options cost a little more than usual relative to puts.
The options market is pricing a move of about $13.55 either way by October 2. That is a range of roughly $330.37 to $357.47, derived from what at-the-money straddles cost.
The catch is that the biggest pile of open call contracts for that expiration sits at $350, only about $6 above the close. Upside room inside this window looks limited. Big call walls like that often act as a ceiling or a magnet.
The level that changes the picture is $338.21, the 200-day moving average and roughly where last Wednesday's selloff bottomed. A close below it undoes the bullish lean.
Both chart-based technical models also lean bullish, with targets below $350.
2 · What the options market is pricing
What changed this week
It was a round trip. GOOGL spiked to about $355 on September 21, slid to roughly $338 by September 23, and recovered to $343.92. That is a net 1.6% loss over five sessions.
Along the way, traders built downside protection. The put/call open-interest ratio compares puts held open to calls held open. It climbed from about 0.53 to 0.63 over five sessions, so there are now about 63 puts open for every 100 calls. The 7-day average is 0.59.
Friday flipped the flow back toward calls. The single biggest open-interest change in the chain was the October 2 $350 call, which added 10,813 contracts to reach 15,662. That strike, the one the week's ceiling is built on, drew about $3.8 million in premium in one session. One caution: a large-looking build in the October 16 $375 calls is a newly listed strike with no prior-day record, not fresh positioning.
Implied volatility, the market's estimate of how much GOOGL will move baked into option prices, rose about 3% over five days. IV rank averaged 23 over the past 14 sessions and now sits at 27.41.
For settled context: into Friday's September 25 expiration, the $345 calls traded more than 61,000 contracts as that expiry pinned near $342.50.
The short-, medium- and long-term trend reads all agree on one thing: there is no trend. GOOGL is down about 3% over roughly two months and up about 1% over the past month. A short-term momentum crossover turned bearish on September 24, one reason this setup favors short-dated structures and quick profit-taking.
Expected move
The expected move is the move the options market is pricing in, derived from what straddles cost. For the October 2 expiration, 7 days out, it is ±3.94%, or ±$13.55 around $343.92. That gives a range of $330.37 to $357.47.
| Expiration | Implied move | Range around $343.92 |
|---|---|---|
| October 2 (7 days) | ±3.94% | $330.37 – $357.47 |
| October 9 (14 days) | ±5.54% | $324.87 – $362.97 |
| October 23 (28 days) | ±8.03% | $316.30 – $371.54 |
| October 30 (35 days) | ±10.97% | $306.19 – $381.65 |
The first three rungs scale smoothly with time. The jump from ±8.03% to ±10.97% between October 23 and October 30 is not normal time decay; it is the earnings hump, explained below.
Volatility
At-the-money implied volatility is 30.87%. IV rank measures where today's IV sits versus the past year. At 27.41/100, options are cheaper than roughly 73% of the past year's readings, and the IV percentile of 29 tells the same story.
The direction is up but modest:
- IV rose 0.2% on Friday, 3.1% over five sessions, and 10.1% over 30 sessions.
- That puts it above its 30-day average of 28.7%.
- It is still below its 90-day average of 32.1%.
The front-month term-structure read, which compares option prices across expiration dates, is unavailable today (expiry day). The ~60-day IV of 34.9% sits well above the front of the curve, partly because that tenor spans the earnings date.
One observation against GOOGL's own recent history: movement is speeding up. Realized volatility over the past five days is running about 1.3 times the 20-day pace, which is on the high side of normal for this stock. The 20-day realized figure itself, 27.4%, is on the quiet side of GOOGL's norm.
Is premium rich or cheap? The volatility risk premium is the gap between how much movement options are priced for and how much GOOGL has actually delivered. When it is positive, option sellers have been collecting more than realized movement cost them.
- Right now options are priced about 3.5 vol points above what GOOGL has delivered over 20 days.
- That gap ranks around 66/100 against this stock's own recent readings, so it is richer than about two-thirds of them.
- It has shrunk sharply. The gap was about 7.5 points on September 22 and roughly 11 points earlier in the month. It narrowed because the September 23 slide pushed realized movement up, not because options got cheap.
So what: IV rank 27 plus a middle-of-the-pack premium over delivered movement is a "fair" reading. It gives no strong edge to selling premium, and it slightly favors paying for defined-risk debit spreads when you have a directional view.
Earnings on the calendar
GOOGL's next report is scheduled for October 28, after the close. That is 26 days after the October 2 expiration and between the October 23 and October 30 expirations.
Options expiring after a scheduled report price in the extra jump risk of that report. You can see it clearly here: ATM IV jumps from 29.0% at October 23 to 35.4% at October 30, and the expected move steps up from ±8.03% to ±10.97%.
Each of the last four reports came in above the consensus estimate, most recently $9.11 per share against $2.88 expected. None of that touches the October 2 window.
Skew and sentiment
Skew describes how puts and calls the same distance from the stock price don't cost the same. When puts are pricier, traders are paying up for crash protection. Today it runs the other way:
- 25-delta puts are priced at 31.0% IV and 25-delta calls at 31.9%, so calls cost about 0.8 vol points more.
- GOOGL's 60-day norm has puts about 0.2 points richer.
- That leaves skew roughly one point flatter than usual. Traders are paying a little extra for upside, not bracing for a drop.
The put/call volume ratio shows how much put activity there is relative to calls; above 1 means puts dominate. At 0.38 it matches the 7-day average of 0.39. Overall option volume was light, about 0.86 times its 20-day average.
Sentiment in short-dated options is firmly call-leaning:
- The 0–7 day expirations score +39, above their 7-day average of +28.
- The 7–30 day expirations score +63, against a 7-day average of +39.
- Every bucket out to four months leans bullish.
Two readings stand out versus GOOGL's own norm:
- The count of call contracts clearing an unusual-volume bar (12 calls vs. 5 puts) is unusually heavy for this name.
- Friday's net new open interest skewed to calls by one of the wider margins in recent history.
The key levels map
| Level | Price | Why it matters |
|---|---|---|
| 52-week high | $408.61 | GOOGL sits about 16% below it |
| Whole-chain call wall | $375.00 | Heaviest call open interest across all expirations (88,775 contracts); well outside this window |
| Large gamma strike | $370.00 | Second-largest gamma concentration in the chain |
| Gamma flip (estimate) | $360.00 | One rough estimate of where dealer hedging changes character |
| Swing resistance | $358.08 | Near the mid-September spike high |
| 100-day moving average | $357.86 | Coincides with the top of the implied range |
| Implied range high (October 2) | $357.47 | 1σ upper rail from straddle pricing |
| Swing resistance | $350.86 | Sits just above the call wall, reinforcing it |
| Call wall, October 2 | $350.00 | Heaviest call open interest for the window (15,662 contracts); also the chain's largest gamma strike |
| TA resistance | $346.00 | Both chart models flag it as the first hurdle |
| Swing resistance | $345.52 | Immediate overhead pivot |
| 50-day moving average | $344.29 | Price sits just beneath it |
| Close | $343.92 | Friday's close |
| Max pain, October 2 | $342.50 | Where the most option value expires worthless |
| 20-day moving average | $342.17 | Short-term trend line, now just below price |
| Swing support / gamma strike | $340.27 / $340.00 | First support shelf, with heavy two-sided open interest at $340 |
| 200-day moving average | $338.21 | This article's invalidation line |
| Swing support | $332.82 | Mid-September basing area |
| Implied range low (October 2) | $330.37 | 1σ lower rail |
| Put wall (October 2 and whole chain) | $330.00 | Heaviest put open interest for the window (3,258) and across the chain (29,797) |
| Swing support | $328.97 | Next shelf below the put wall |
Max pain is the price where the most option value would expire worthless; expirations sometimes gravitate toward it. Call and put walls are the strikes with the biggest piles of open contracts on each side; they often act like magnets or barriers.
For October 2, the call wall ($350) differs from the whole chain's heaviest call strike ($375). The put wall at $330 is the same for both.
Positioning and unusual flow
Market makers hedge the options they've sold. One rough estimate puts their net gamma positive, both for the whole chain and for the October 2 expiration on its own. In that regime their hedging tends to dampen moves, which supports the pin case between the walls.
The same estimate places its flip strike at about $360, above spot. The two framings don't fully agree, so don't lean hard on the cushion.
The flow worth noting, all in live contracts:
- October 2 $350 calls: 12,329 traded, open interest now 15,662, about $3.8 million in premium. This is the wall being built in real time. Someone either wants upside to $350 or is selling calls there as a cap. Either way the strike matters.
- September 28 $352.50 calls: 7,517 contracts against just 384 open, nearly 20 times turnover. That is a short-fuse bet on a quick pop that the options market prices as a long shot.
- October 9 $355 calls: open interest rose 2,459 to 9,631, making it that expiration's call wall. Upside interest extends one week past this window.
3 · Technical check
3-day model (to September 29): bullish, targeting $346.00, model range $338.00–$350.00. Confirms. The target sits inside both the near-dated options range and the October 2 range. The model cites a bullish MACD crossover (a momentum-line signal) and buyers regaining the directional edge. It also flags mild money-flow distribution, meaning more volume on down moves than up moves, as a caution. Its key levels are support at $340.00 and resistance at $346.00. Its dominant scenario is invalidated on a close below $341.00.
6-day model (to October 2): bullish, targeting $347.50, model range $335.50–$351.50. Confirms. Same direction as the options lean, with a target comfortably inside the options-implied range. Its key levels are support at $338.00 and resistance at $346.00. It frames the recent action as a basing attempt after a failed breakout, and its breakout scenario is invalidated on a close below $340.00.
Both models place their upside targets just under the $350 call wall, which fits the options map neatly.
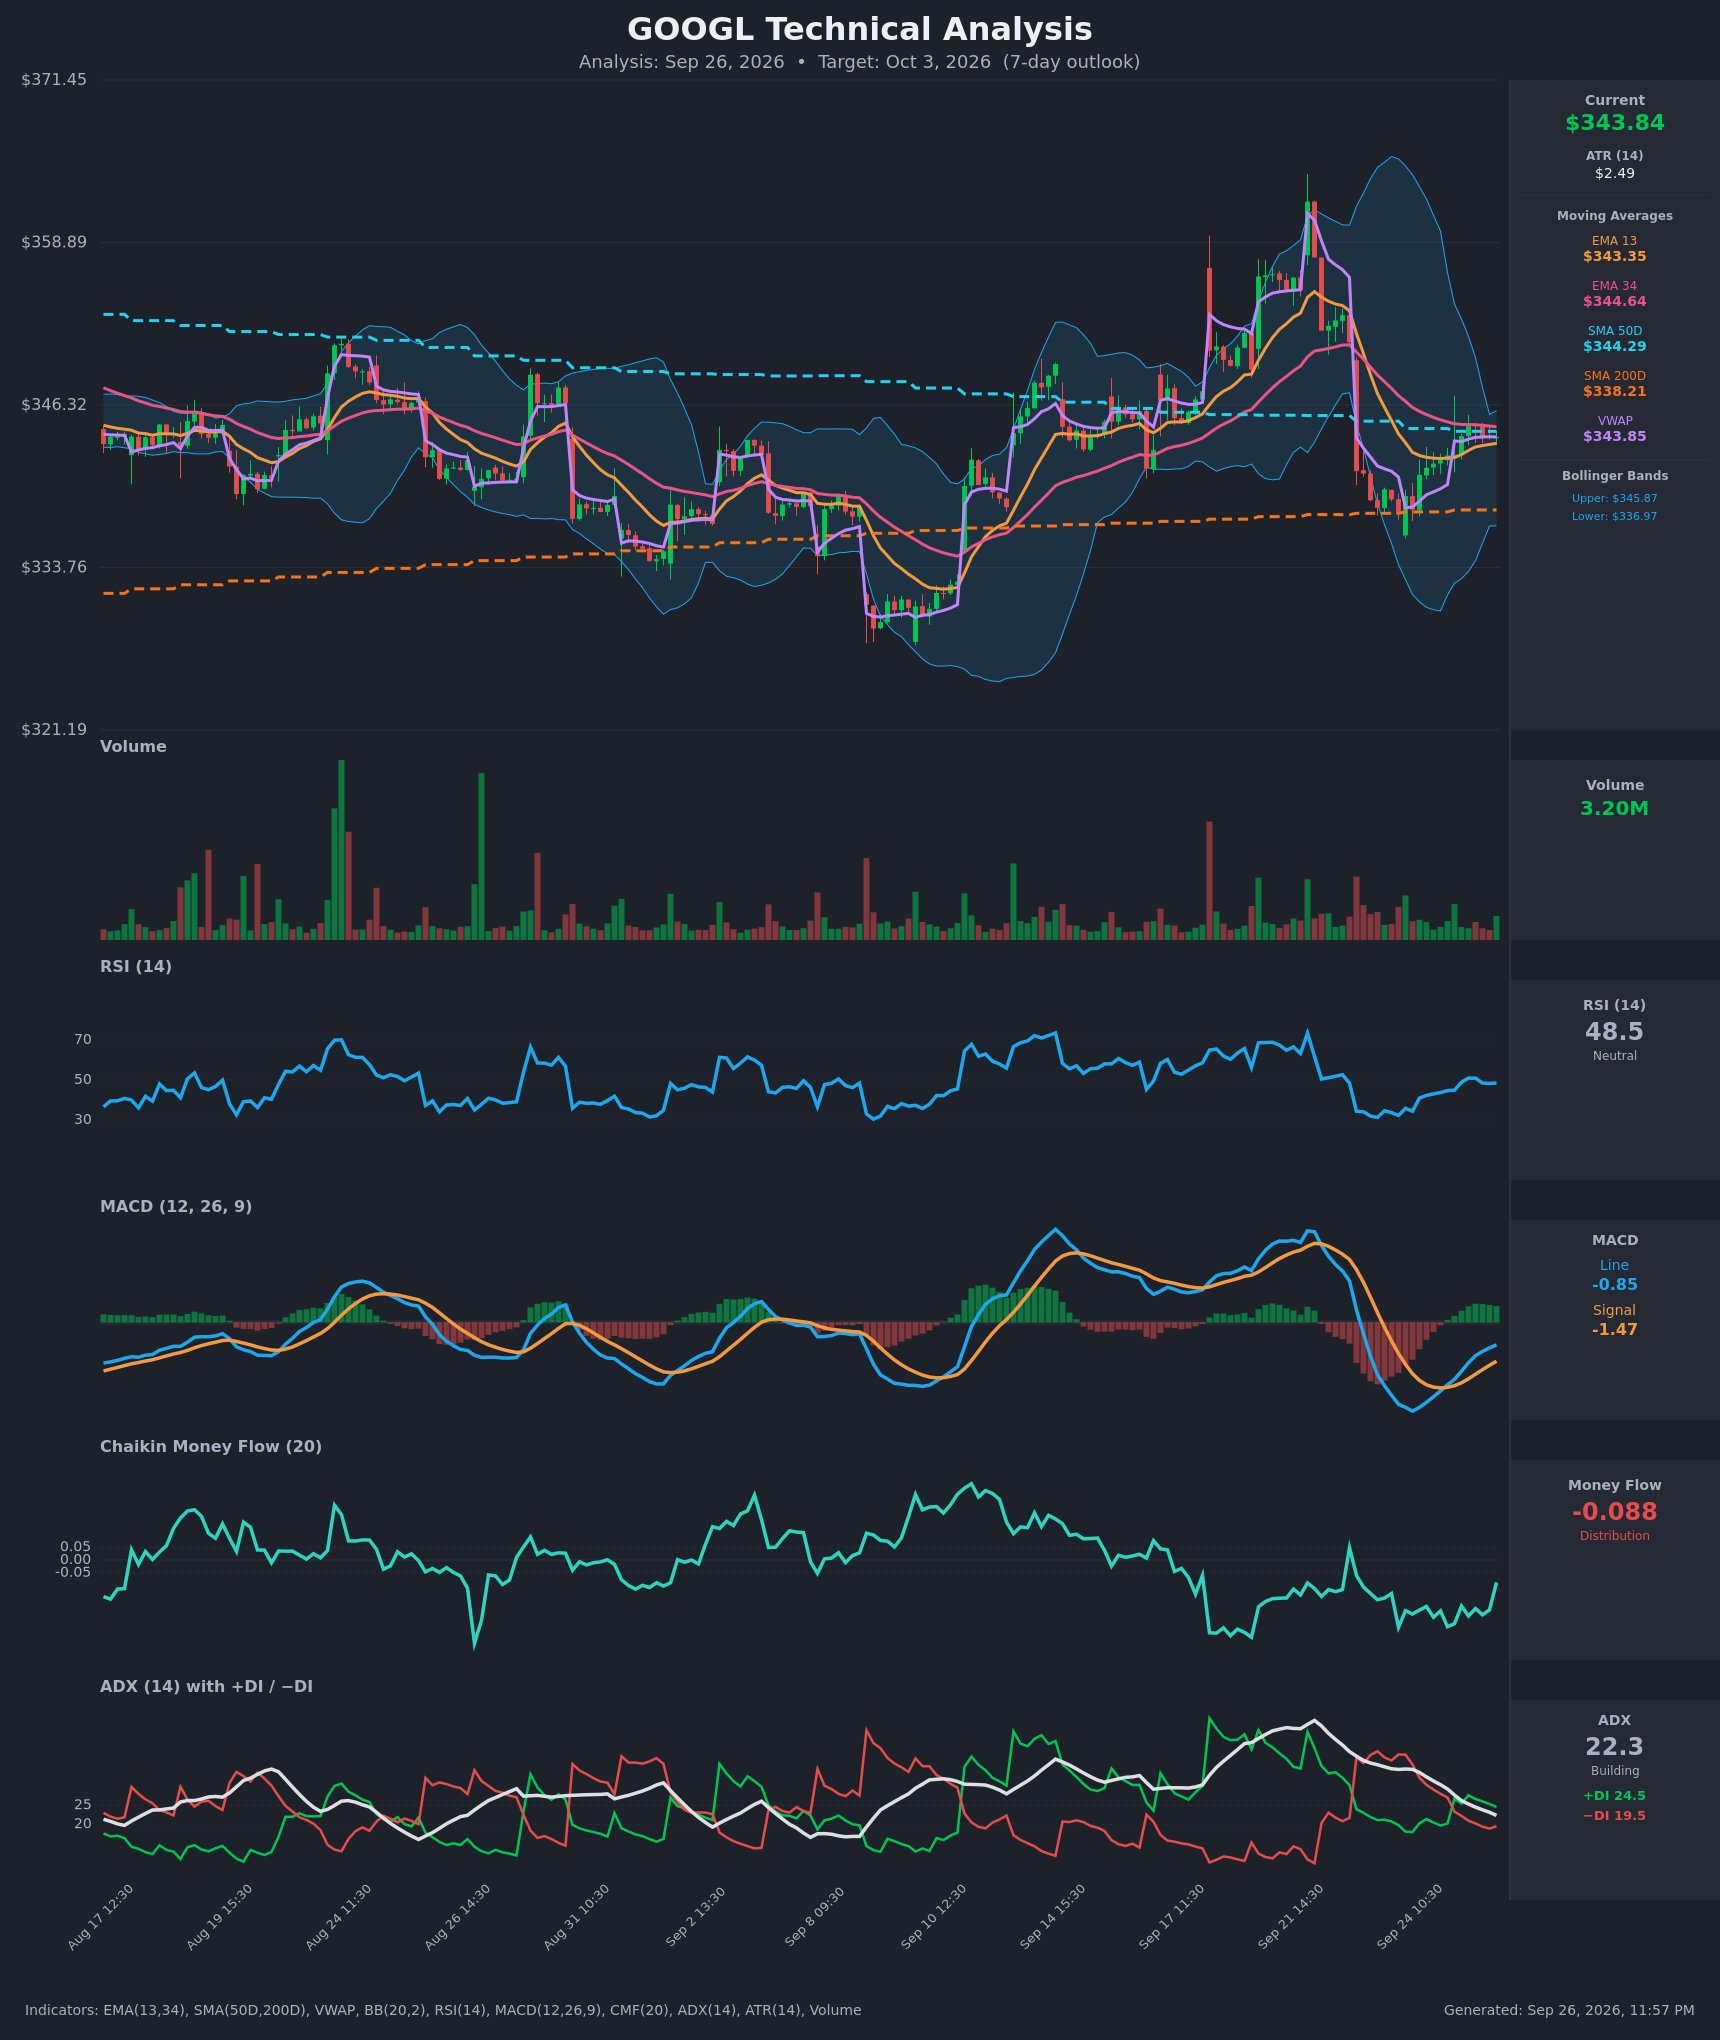
Model vs. Market: The options market implies $330.37–$357.47 into October 2; the 6-day technical model targets $347.50. The chart model sees modest upside that stops short of the $350 call wall, and the options market's range is wider on both sides. That is agreement on direction, with a ceiling both sides respect.
The technical targets shaped strike selection below. The bull call spread tops out at $350, right where both the TA targets and the call wall converge.
Full technical write-ups: 3-day report → · 6-day report →
4 · Three ways the next six days can go
If GOOGL pushes above the call wall ($350):
- The heaviest October 2 call open interest sits right there. Walls like that tend to slow rallies as call sellers defend and hedgers sell into strength.
- A clean close above $350.86 swing resistance would leave thinner positioning overhead until $355, the next week's call wall.
- Beyond that are the implied range top at $357.47 and the 100-day average at $357.86.
If GOOGL drifts between the walls:
- This is the base case the positioning describes.
- Max pain sits at $342.50, a buck and change below the close.
- With dealer gamma estimated positive, hedging flows tend to lean against moves in either direction.
- That can leave price oscillating between the $340 support shelf and the $345–$346 resistance cluster into October 2.
If GOOGL breaks below the put wall ($330):
- That would mean the $338.21 invalidation line has already failed. The move would have run through the bottom of the implied range.
- Below $330, put open interest thins out and the next swing support is $328.97.
- Spot is already about 4.7% below the ~$360 flip estimate, a fairly typical distance for this name. A slide from here would put it further onto the side where one rough estimate suggests hedging amplifies rather than cushions selling.
5 · Three defined-risk structures
Prices are end-of-day midpoints as of September 25, 2026. All structures are hypothetical unless flagged as an entered position. Verify live prices before trading; these will be stale by the open.
If you lean bullish: October 2 $345/$350 bull call spread
A debit spread means you pay upfront, and you profit if the stock rises toward the upper strike.
- Trade: Buy the October 2 $345 call, sell the October 2 $350 call
- Cost and payoff:
- Debit: $1.925 ($192.50 per spread)
- Max profit: $307.50 at $350 or higher
- Max loss: $192.50
- Break-even: $346.93
- Why it fits: Call open interest is building fast and short-dated sentiment is broadly bullish. IV rank of 27 keeps the debit reasonable. The short leg sits exactly on the $350 call wall, where both TA targets also top out.
- Makes sense only if: GOOGL clears the $345.52–$346 resistance cluster early in the window.
- Invalidated if: GOOGL closes below $338.21
- Earnings exposure: Expires 26 days before the October 28 report, so there is no earnings-gap risk.
- Managing it: The trend reads are flat across horizons and a momentum crossover turned bearish on September 24, so take profits early. Close at about 60–75% of max value, or on a test of $350. Exit regardless by the October 1 close.
- Liquidity note: The $345 calls traded 10¢ wide and the $350 calls 15¢ wide. Both are very active, so fills near mid are realistic.
- Analyze this position →
If you expect the range to hold: October 2 $325/$330/$355/$360 iron condor
An iron condor sells a put spread and a call spread together. You collect a credit and keep it if the stock stays between the short strikes.
- Trade: Sell the $330 put and buy the $325 put. Sell the $355 call and buy the $360 call. All legs expire October 2.
- Cost and payoff:
- Credit: $1.265 ($126.50 per condor)
- Max profit: $126.50
- Max loss: $373.50
- Break-evens: $328.74 and $356.27
- Why it fits: The short put sits on the $330 put wall. The short call sits above the $350 call wall and the $350.86 swing resistance. The positive dealer-gamma estimate favors a pin near $342.50 max pain.
- Makes sense only if: You accept modest credit. With IV rank at 27 and only a mid-range premium over delivered movement, this is a fair-value sale, not a rich one.
- Invalidated if: GOOGL closes below $330 or above $355
- Earnings exposure: Expires 26 days before the October 28 report, so there is no earnings-gap risk.
- Managing it: Close at 50% of the credit. If either short strike trades, close the whole position rather than hope.
- Liquidity note: The $330 puts traded 6¢ wide, the $355 calls 8¢, and the $360 calls 3¢. The $325 puts were 4¢ wide, above 5% of their small mark, so work that leg with a limit order.
- Analyze this position →
If you lean bearish: October 2 $340/$330 bear put spread
This debit spread pays you if GOOGL falls toward $330.
- Trade: Buy the October 2 $340 put, sell the October 2 $330 put
- Cost and payoff:
- Debit: $2.53 ($253 per spread)
- Max profit: $747 at $330 or lower
- Max loss: $253
- Break-even: $337.47
- Why it fits: Puts accumulated over five sessions, with the put/call open-interest ratio rising from 0.53 to 0.63. The target is the $330 put wall, and a break of the 200-day at $338.21 would put this spread in the money.
- Makes sense only if: GOOGL loses $340 support. This fights the prevailing lean, so size it small.
- Invalidated if: GOOGL closes above $350
- Earnings exposure: Expires 26 days before the October 28 report, so there is no earnings-gap risk.
- Managing it: Take profits on a move toward $332–$330. Exit if GOOGL closes above $346.
- Liquidity note: The $340 puts traded 10¢ wide and the $330 puts 6¢ wide, both liquid.
- Analyze this position →
If none of these: no trade
The honest case for standing aside is that the lean is mild and the room is short. The bullish upside runs only about $6 to a call wall that has been reinforced in real time. Premium is fair rather than rich, so sellers aren't being overpaid either. The trend reads are flat across every horizon.
If you don't have a view on whether $346 breaks, waiting for a close above it, or a close below $338.21, costs you little. Those closes would say more than today's positioning does.
6 · Quick FAQ
What is GOOGL's expected move by October 2? About ±$13.55 (±3.94%), a $330.37–$357.47 range, per straddle pricing as of the September 25 close.
Is GOOGL expected to go up or down over the next six days? Options positioning as of September 25 leans slightly bullish, driven by heavy call buying and call-leaning short-dated sentiment. That is a read of what traders have done, not a forecast. The actionable map is the $330.37–$357.47 range, with $330 support and $350 resistance.
Are GOOGL options expensive right now? Not especially. IV rank 27.41/100 means option prices are cheaper than about 73% of the past year's readings. They are running about 3.5 vol points above the movement GOOGL has actually delivered, richer than roughly 66% of this stock's recent readings. Net, that is fair value, with no strong edge to buying or selling premium.
When is GOOGL's next earnings report? October 28, after the close. It lands after the October 23 expiration but before October 30, which is why options past October 23 carry noticeably more premium.
What invalidates this read? A close below $338.21.
Methodology & disclosures. Data: end-of-day options-chain snapshot for GOOGL, 2026-09-25, generated 2026-09-26T23:57:10.185Z. Prices shown are midpoints and will differ from live markets. Momentum/positioning scores and volatility-premium comparisons are descriptive measurements of past option flow and past price movement — not investment advice, signals, forecasts, or guarantees. Earnings dates and reported results are from the data provider's earnings feed as of 2026-09-26T23:57:10.185Z; report dates can change. All trade structures are hypothetical. Every structure shown has a defined maximum loss; you can lose the entire max-loss amount. Options involve substantial risk and are not suitable for all investors.