IBIT Options Are Pricing a $2.46 Move Into September 21 — And the Chart Model Disagrees
The options market implies a $41.31–$46.23 range for IBIT into the September 21 expiration, with positioning leaning mildly higher — while both technical reads point lower. Here's the level that settles it, plus three defined-risk ways to trade the gap.

The options market implies a $41.31–$46.23 range into the September 21 expiration; here's what's driving it, why the chart model disagrees, and three defined-risk ways to trade it.
Published Sunday, September 13, 2026 · Data as of Friday, September 11 close
Explore the live IBIT options data in the Detailed Options Analyzer →
Quick answer
| Item | Answer |
|---|---|
| Market bias | Slightly bullish |
| Options-implied range (into Sep 21) | $41.31 – $46.23 (±5.62%, about ±$2.46) |
| Major support | $43.50 (Sep 21 put wall) |
| Major resistance | $47.00 (Sep 21 call wall) |
| Max pain (Sep 21) | $44.00 |
| Dealer gamma regime (estimate) | Positive — hedging tends to dampen moves; flip level ≈ $40.00 |
| Volatility condition | Falling — IV rank 8/100 · premium thin: options priced about 9 vol points below delivered movement |
| Technical check | Diverges (bearish, 4-day and 7-day) |
| Best-fitting strategy | Long call vertical (defined-risk debit spread), Sep 21 |
| Analysis invalidated if | IBIT closes below $43.13 |
1 · What matters today
IBIT closed Friday, September 11 at $43.77 after sliding 5.6% over five sessions — yet the chain's own positioning still leans, mildly, the other way. Our read of options flow (call-heavy volume, a skew that has flattened out, and spot sitting near the low end of the corridor bounded by the biggest open-interest piles at the target expiration) comes out slightly bullish into the September 21 expiration. The options market is pricing a move of about ±$2.46, or ±5.62% — a $41.31 to $46.23 range — a figure derived from what straddles cost. The level that decides it is $43.13, the nearest swing support just under Friday's close; a close beneath it and the lean is dead. One caution: both technical reads we checked point lower over this window, so treat the lean as tentative and keep the risk defined.
2 · What the options market is pricing
What changed this week
The story of the past week is price falling while option prices fell faster. IBIT is down 5.57% over five trading days, and at-the-money implied volatility — the market's estimate of how much IBIT will move, baked into option prices — dropped 10.87% over the same stretch to 36.7%, a hair (0.3%) below its own 30-day average and well under its 90-day average of 38.4%. IV rank sits at 8 out of 100 versus a 7-day average of 11.9 and a 14-day average of 12.9: even by the standards of a quiet fortnight, Friday's reading was the low end.
Underneath, two flows pulled against each other. Friday's put/call volume ratio was 0.43 — for every 100 calls traded, only 43 puts — against a 7-day average of 0.56 and a 14-day average of 0.62, on total option volume running 1.34× its 20-day norm. That's a call-heavy tape. But put/call open interest (contracts currently held open) climbed from 0.60 to 0.72 over five sessions and now sits above both its 7-day (0.66) and 14-day (0.62) averages: for every call contract held open there are now 0.72 puts, up sharply from a week ago. Traders bought calls on the day and accumulated puts over the week. The biggest still-live open-interest changes tell the same split story: the September 18 $40 puts shed 17,252 contracts, the October 16 $48 calls shed 12,987, while the September 16 $43 puts added 11,586 and the September 18 $46 calls added 6,338. Into Friday's expiration, the $43 puts had added 37,264 contracts of open interest — settled history now, not a live magnet.
The bigger picture is genuinely conflicted. The past week's 5.6% slide runs against a market still up 22.0% over the past month and 29.0% over roughly the past two and a half months — the near-term flow and the longer trend are pointing in different directions, and a fresh momentum crossover turned lower on Friday itself. That argues for shorter-dated structures and earlier profit-taking, not for leaning on a trend.
Expected move
Into the September 21 expiration, the options market is pricing a move of ±$2.46 (±5.62%) around Friday's $43.77 — that is, a $41.31 to $46.23 range by expiration, one standard deviation, straight out of straddle pricing. The ladder across nearby expirations:
| Expiration | Implied move | Range around $43.77 |
|---|---|---|
| Sep 16 | ±4.06% | $41.99 – $45.55 |
| Sep 18 | ±4.85% | $41.65 – $45.89 |
| Sep 21 (our window) | ±5.62% | $41.31 – $46.23 |
| Sep 25 | ±7.03% | $40.69 – $46.85 |
The rungs step up smoothly with time — no kink, no hump, no single date the chain is bracing for. That smoothness is itself information: nothing in the priced curve says the market expects a scheduled event inside this window.
Volatility
At-the-money IV of 36.7% puts IV rank at 8/100 — option prices are cheaper than roughly 92% of the past year's readings — with the IV percentile at 15. Direction is down: −3.9% on the day, −10.9% over five sessions, though still +6.5% over 30 days. The 60-day tenor prices at 38.6%, modestly above the front of the curve. The front-month read is unavailable in Friday's snapshot because the nearest expiration had already reached expiry day, so there is no clean term-structure slope to quote; the rest of the curve is intact.
Two "vs its own norm" observations are worth pulling out, both measured against IBIT's own recent history rather than the broader market. First, 20-day realized volatility — how much the fund has actually been moving — is running at 46.0%, well above this fund's own recent norm, a hangover from August's run and its string of 5–6% gap days. Second, and in sharp contrast, the last five sessions' realized movement is running unusually depressed relative to that same 20-day pace — one of the most extreme readings of its kind in this fund's recent history. Movement has cooled hard, but the month-long window hasn't caught up yet.
Premium rich or cheap? The volatility risk premium — the gap between how much movement options are priced for and how much IBIT has actually delivered — sits at about 9 vol points negative: implied 36.7% against 46.0% delivered. When that gap is positive, option sellers have been collecting more than realized movement cost them; here it is deeply negative, and its percentile versus this fund's own recent readings is 1 out of 100 — cheaper than essentially every recent reading. The path there was steady: the gap was about +4 vol points three weeks ago and has fallen every week since. Read that carefully, because a good chunk of it is mechanical — August's 22% advance still sits inside the 20-day realized window while the past week's movement has gone quiet, which flatters the "cheap" side of the comparison. Still, the combination — IV rank 8 and a 1st-percentile premium versus delivered movement — favors owning premium rather than collecting it this week. Credit structures here are being paid at the thin end of the range.
Skew and sentiment
Skew measures whether puts and calls the same distance from spot cost the same; when puts are pricier, traders are paying up for crash protection. Right now they aren't. The 25-delta put prices at 37.6% and the 25-delta call at 37.5% — a gap of essentially 0.0 vol points, against a 60-day median of 4.3 vol points of put richness for this name. Downside protection is unusually cheap relative to this fund's own history, a reading stretched well above its norm on the complacent side. The counterweight: that skew has steepened about 4.4 vol points over the last five sessions, so put demand is rebuilding from a very flat base even if it hasn't arrived yet.
Sentiment across the curve splits by tenor. Short-dated options (0–7 days) read essentially flat at −4, dragged there by heavy put open-interest building — calls added 4,793 contracts against 60,930 for puts in that bucket. Step out to the 7–30 day bucket and the read flips firmly positive at +35, with call open interest building and delta-weighted flow call-dominated. The 30–60 day and 60–120 day buckets sit at +26 and +33. The one-phrase summary the data supports: positioning is building further out while the front end hedges. Call-side sweeps also cleared the unusual-volume bar more often than put-side ones on Friday (five contracts to two) — a pace of call activity running above this fund's recent norm.
The key levels map
| Level | Price | Why it matters |
|---|---|---|
| Heaviest call OI, whole chain | $48.00 | 139,287 calls open across all expirations — the chain-wide ceiling, not this window's |
| Call wall (Sep 21) | $47.00 | The target expiration's largest call open-interest pile (2,135 contracts); 4,055 traded Friday |
| Swing resistance | $46.56 / $46.09 | Recent pivot cluster from price structure |
| Top of implied range (Sep 21) | $46.23 | Upper rail of the ±5.62% expected move |
| Largest gamma strike, whole chain | $45.00 | Heaviest total gamma·OI — hedging activity concentrates here |
| Swing resistance / technical cluster | $44.24 – $44.26 | Pivot high and the technical model's VWAP/moving-average resistance |
| Max pain (Sep 21) | $44.00 | Where the most option value would expire worthless; second-heaviest gamma strike |
| Friday's close | $43.77 | Reference price for everything above and below |
| Put wall (Sep 21) | $43.50 | The target expiration's largest put open-interest pile (540 contracts) — a thin one |
| Swing support | $43.13 | Nearest pivot support; the invalidation level for this read |
| 20-day moving average | $42.76 | Price sits 2.4% above it |
| 200-day moving average | $42.26 | Price sits 3.6% above it; the longer-term trend floor |
| Bottom of implied range (Sep 21) | $41.31 | Lower rail of the ±5.62% expected move |
| Heaviest put OI + gamma flip (estimate) | $40.00 | 102,070 puts open chain-wide; one rough estimate puts the hedging flip here |
| 50-day moving average | $38.87 | 12.6% below spot — how far August's run carried price |
An important caveat on the walls: September 21 is a light, non-standard expiration, and its own open-interest piles are small — 2,135 calls at $47 and 540 puts at $43.50. Those are this window's true levels, but they are weak magnets compared with the chain-wide clusters at $48 and $40. Note too that the September 18 expiration's positioning is bunched almost entirely at $40 (66,600 calls and 54,736 puts there, with max pain at $40) — a legacy cluster well below spot rather than a live pull on price.
Positioning and unusual flow
One rough estimate of dealer gamma — market makers hedge the options they've sold, and in a positive-gamma regime that hedging tends to dampen moves rather than amplify them — reads positive for the chain as a whole, with a flip level estimated near $40.00. Below that estimate, the same rough model suggests hedging would start amplifying selling instead of cushioning it; spot sits comfortably above it. Scoped to September 21 alone, the estimated regime is also positive but essentially nil in magnitude: too little open interest at that expiration for dealer hedging to matter much either way. Both figures are estimates built on an assumed dealer sign convention, not observed inventory.
Three pieces of flow stand out, all in live contracts. First, the September 21 $47 calls traded 4,055 contracts against 2,135 open — open interest rose 2,017 on the day, which is the call wall for this window being built in real time. Second, deep in-the-money September 21 calls at $41 and $41.50 traded 1,001 and 924 contracts against roughly zero open interest, about $305,000 and $242,000 of premium respectively — the highest-dollar prints at that expiration, and the delta profile (0.83–0.87) of someone using options as a stock substitute rather than a lottery ticket. Third, the single largest premium print on the entire chain was the October 16 $47 calls: 45,035 contracts, about $4.19 million of premium. That's beyond this window, but it's where the real size went.
3 · Technical check
Both chart-model reads disagree with the options lean. The 4-day model is bearish, targeting $43.15 with a projected range of $42.30 to $44.40 into September 18. The 7-day model is also bearish, targeting $43.10 with a projected range of $41.90 to $44.90 into September 21 — the same date this article is built around. Both cite the same evidence: a short-term moving-average cross-under (the 13-period EMA at $43.97 slipping beneath the 34-period at $44.21), MACD rolling back below its signal line after a failed bullish pop, and RSI at 43.6 under the 50 midline. The most decisive read is the directional-movement pair — the negative DI (31.6) sits above the positive DI (26.2) while ADX at 18.4 says the trend is weak — which translates to "sellers have the edge inside a range, not a downtrend." Money-flow readings have faded from clear August accumulation to flat, which is corroboration rather than a fresh signal.
Classification: Diverges. The direction contradicts the options positioning read, even though the technical target of $43.10 sits comfortably inside the options-implied range. Both models flag the same invalidation on their side — a reclaim and hold above roughly $44.26–$44.30 negates the bearish setup — and the same trigger, a close below $43.20 opening a move toward the 200-day average at $42.26.
Model vs. Market: The options market implies $41.31–$46.23 into September 21; the 7-day technical model targets $43.10. The gap isn't about magnitude — the target sits inside the implied range — it's about sign. The chain's positioning says "modestly higher," the chart says "test the floor first." A close back above $44.26 resolves it in the options market's favor; a close below $43.13 resolves it in the chart's.
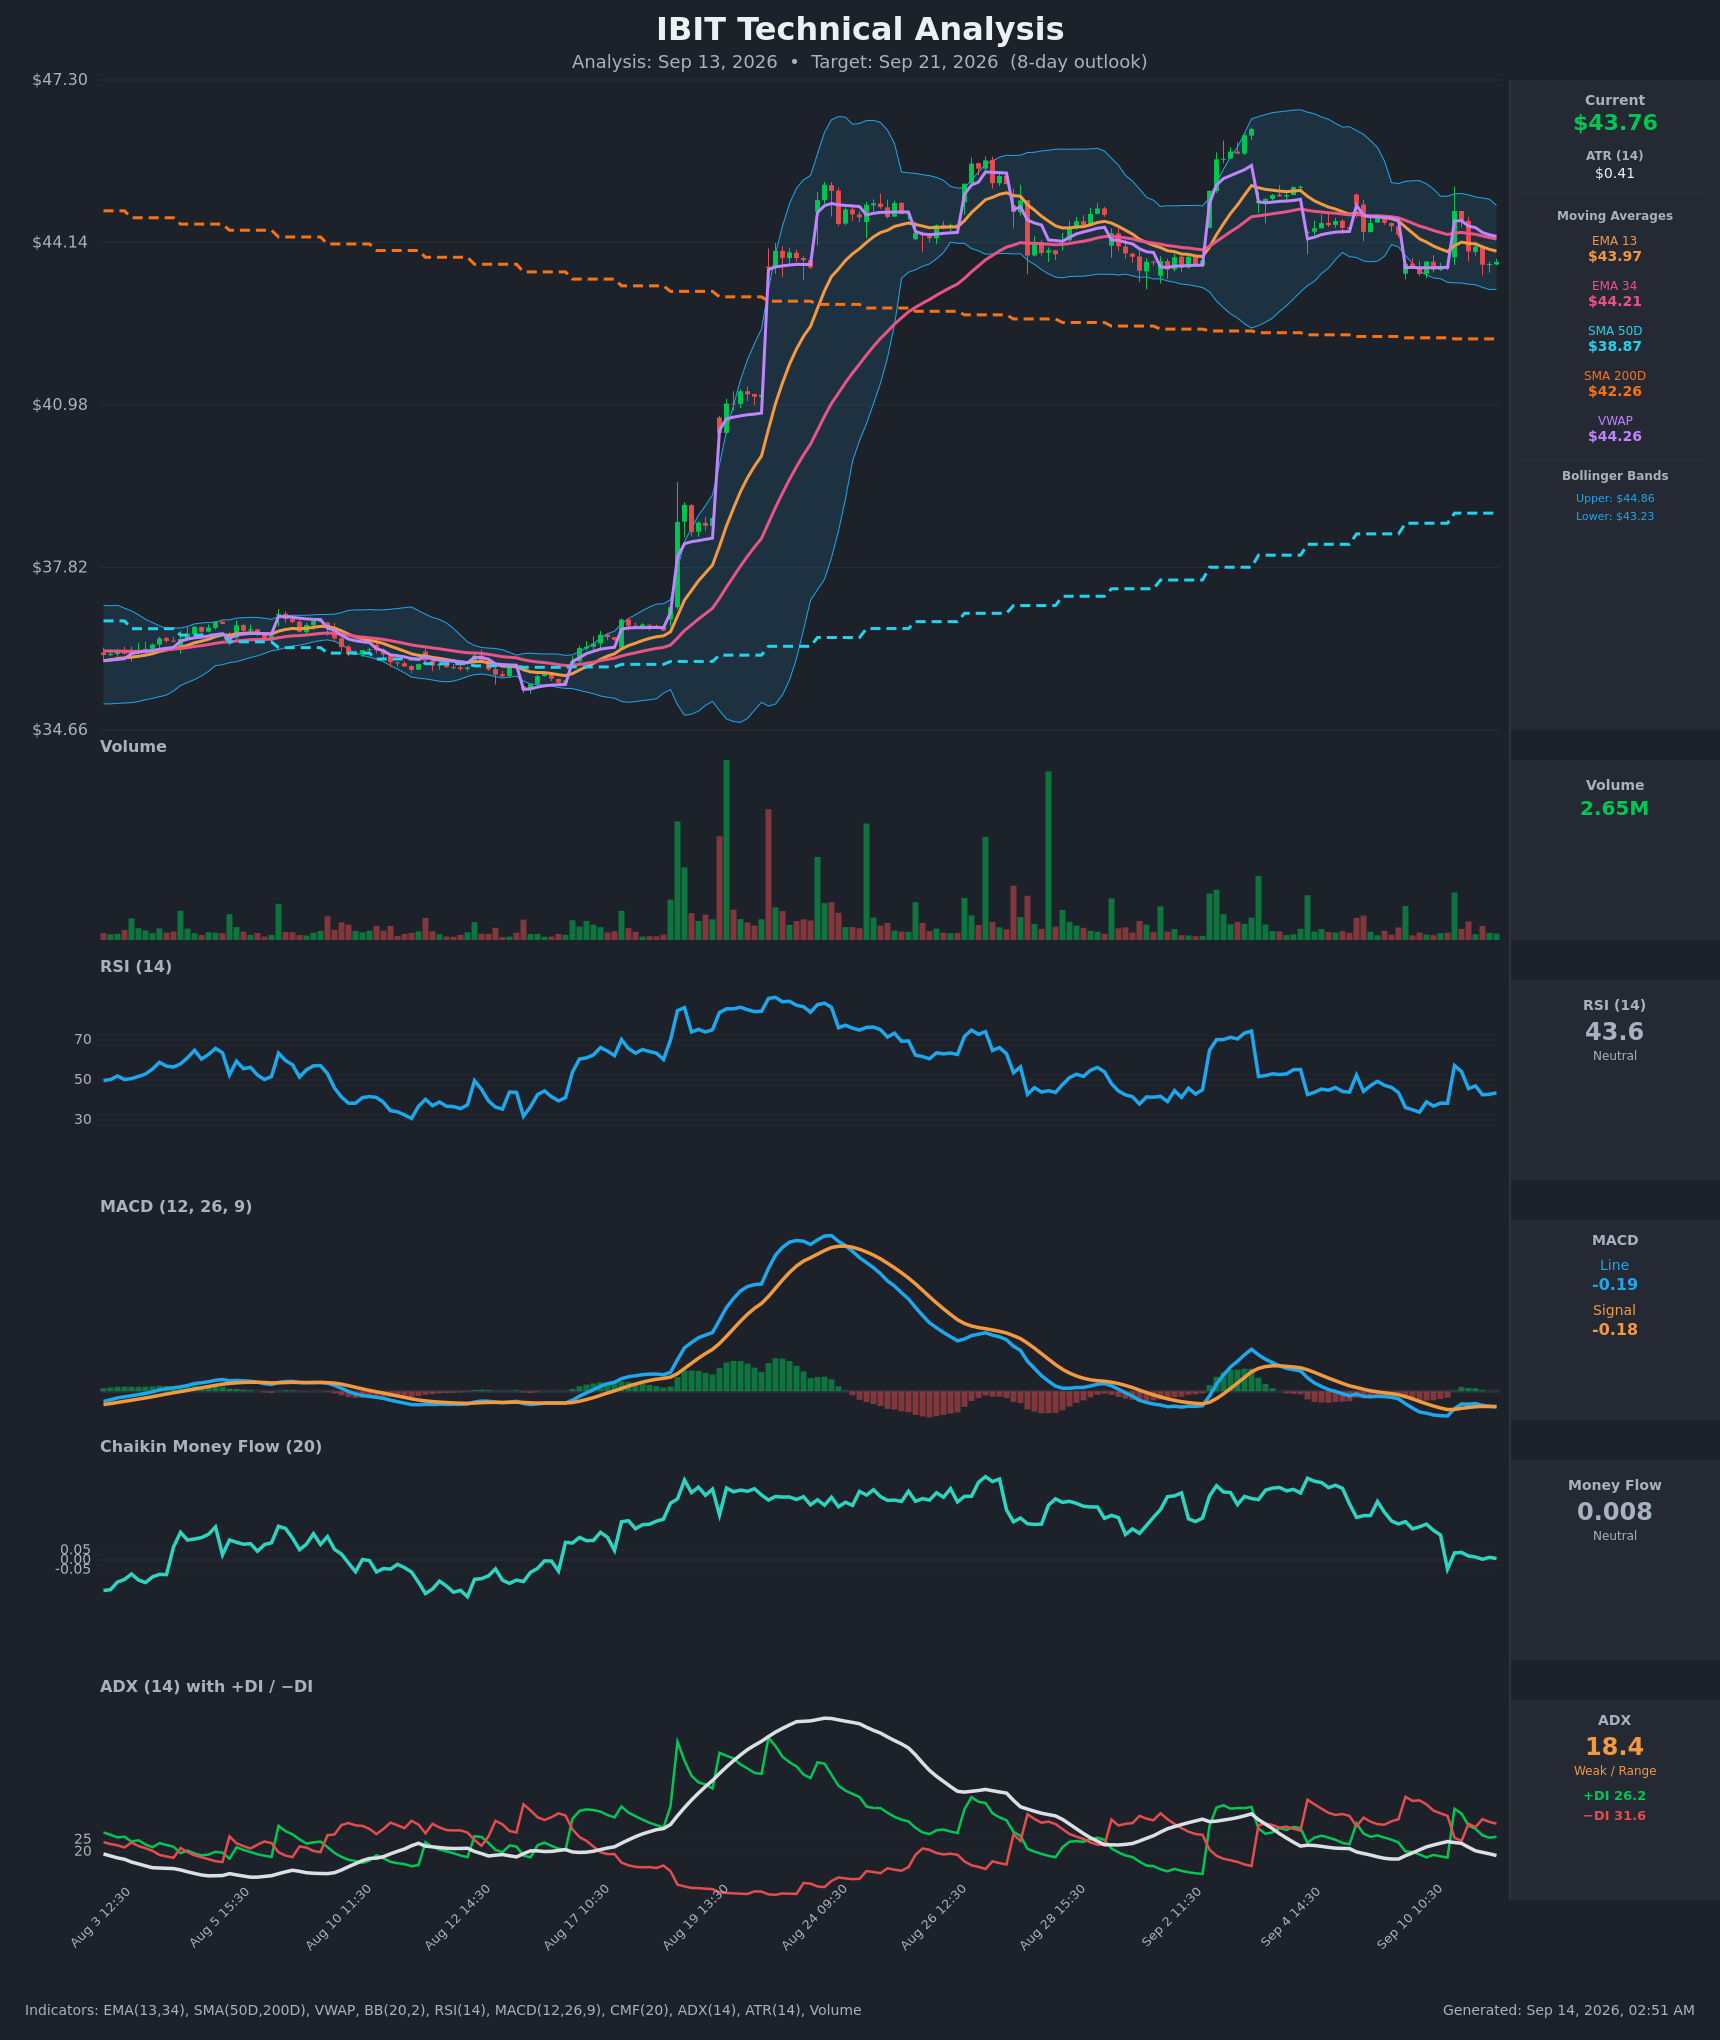
How this adjusted the structures below: it shaded the range structure's short call down to $46 rather than out toward the $46.50 strike, kept the bullish spread's break-even close to spot rather than reaching for a bigger payoff, and earned the bearish structure its place as a fully-costed third option rather than a footnote.
Full technical write-ups: 4-day report → · 7-day report →
4 · Three ways the next seven days can go
If IBIT pushes above the call wall ($47.00): The heaviest call open interest for this expiration sits there, and dealers hedging those calls tend to slow a rally as it approaches. But with only 2,135 contracts open at that strike, the brake is a light one — and above it, positioning thins out until the chain-wide $48 cluster. Note $47.00 sits above the upper rail of the implied range at $46.23, so getting there at all would be a larger-than-priced move.
If IBIT drifts between the walls: This is the base case the positioning describes. Max pain for September 21 sits at $44.00, roughly 0.5% above Friday's close, and the estimated positive-gamma regime is the kind where hedging flows lean against moves rather than with them. A quiet grind between $43.50 and $46.23 with expiring open interest pulling toward $44 is what the chain is set up for — and it is also the technical models' second-highest-probability scenario, at 25–35%.
If IBIT breaks below the put wall ($43.50): The next shelf is thin. Swing support at $43.13 comes first, then the 20-day average at $42.76 and the 200-day at $42.26 — the zone both chart models name as their downside target. The estimated gamma flip sits far below, near $40.00, and one rough estimate suggests hedging only starts amplifying selling rather than cushioning it below that level, so the accelerant isn't armed anywhere in this week's likely range. That makes a break lower more likely to be an orderly slide into the $42s than a cascade.
5 · Three defined-risk structures
Prices are end-of-day midpoints as of 2026-09-11. All structures are hypothetical. Verify live prices before trading — these will be stale by the open.
Because options are priced about 9 vol points below what IBIT has actually delivered, and at the very bottom of their own recent range, the debit structures lead here and the credit structure carries a warning. Both directional spreads sit at the September 21 expiration, matching the outlook window; with the short-term trend fighting the longer one, none of these is a hold-to-expiry position.
If you lean bullish: September 21 $44/$46 call debit spread
- Trade: Buy the Sep 21 $44 call, sell the Sep 21 $46 call. You pay a net debit up front; that debit is the entire risk, and you're betting price finishes above the lower strike.
- Debit: ~$0.62 ($44 call mid $0.925 less $46 call mid $0.31) · Max profit: $138 per spread · Max loss: $62 · Break-even: $44.62
- Why it fits: This is the structure the volatility read argues for — you're buying premium at an IV rank of 8/100 and a 1st-percentile premium versus delivered movement, and the short $46 call sits just inside the $46.23 implied-range rail so you aren't paying for territory the market doesn't expect.
- Makes sense only if: You believe the flattened skew and the call-heavy flow are telling the truth and the past week's dip was mean-reversion inside a still-intact longer uptrend.
- Invalidated if: IBIT closes below $43.13.
- Managing it: Take profits at roughly 50–60% of the spread's width rather than holding for max value — with the short-term direction fighting the two-month trend, these gains have been giving themselves back. Exit regardless by September 18 if price is still under $44.
- Liquidity note: The $44 calls quoted 90¢/95¢ — 5¢ wide, about 5% of the mid, fine. The $46 calls quoted 29¢/33¢, 4¢ wide on a 31¢ mid (about 13%), so work the spread as a single limit order near the mid rather than legging it.
- Analyze this position →
If you expect the range to hold: September 21 $41/$42 – $46/$47 iron condor
- Trade: Sell the $42 put and buy the $41 put; sell the $46 call and buy the $47 call, all Sep 21. You collect a credit and keep it if price finishes between the short strikes.
- Credit: ~$0.28 · Max profit: $28 per condor · Max loss: $72 · Break-evens: $41.72 and $46.28
- Why it fits: The short strikes bracket the expected-move rails ($41.31 / $46.23) and straddle max pain at $44.00, and the short call was shaded down to $46 rather than $46.50 to respect the technical models' resistance cluster near $44.26–$44.90.
- Health warning: You're selling premium that has not been rich lately — a 1st-percentile premium versus delivered movement means the market is paying you at the thin end of its own range, which is exactly why the risk/reward here is $72 at risk for $28 of credit. That ratio is the honest price of a low-IV condor, not a bad fill.
- Makes sense only if: You genuinely expect chop and you're comfortable that the payout is small relative to the risk.
- Invalidated if: IBIT closes outside $43.13 or $46.23 — at that point one side is live and the pin case is gone.
- Managing it: Close at ~50% of max credit; exit regardless two days before expiration. If either short strike is breached on a closing basis, close that side rather than hoping for a reversal.
- Liquidity note: The Sep 21 chain is thin. The $42 puts quoted 31¢/33¢ and the $41 puts 17¢/19¢ — both 2¢ wide and workable — but the $47 calls quoted 15¢/19¢, about 23% of mid. Enter the whole condor as one order with a limit, and skip it if you can't get filled near $0.28.
- Analyze this position →
If you lean bearish: September 21 $43.50/$42 put debit spread
- Trade: Buy the Sep 21 $43.50 put, sell the Sep 21 $42 put. You pay a debit; you profit if price slides toward the lower strike.
- Debit: ~$0.49 ($43.50 put mid $0.805 less $42 put mid $0.32) · Max profit: $101 per spread · Max loss: $49 · Break-even: $43.01
- Why it fits: This is the trade that expresses the technical divergence. The long strike is the put wall itself ($43.50), the break-even at $43.01 sits right at both models' breakdown trigger, and the short $42 strike sits just above the 200-day average at $42.26 — the zone both chart models name as their target. It also buys the cheapest downside protection this fund has offered in months: put and call implied volatility are effectively identical against a 4.3 vol-point norm of put richness.
- Makes sense only if: You weight the chart evidence above the positioning read — a legitimate call this week, given they disagree.
- Invalidated if: IBIT closes above $44.26, the level both technical models name as negating the bearish setup.
- Managing it: Take profits at roughly 60% of the spread's width; this is a range-floor test, not a trend trade, and the longer trend is still up. Exit by September 18 if price hasn't broken $43.13.
- Liquidity note: The $43.50 puts quoted 79¢/82¢ — 3¢ wide, about 4% of mid, the tightest legs at this expiration. The $42 puts quoted 31¢/33¢. Both are fillable.
- Analyze this position →
If none of these: no trade
There is an honest case for standing aside. The options read and both chart reads point in opposite directions, and when the two disagree at this size the expected edge on either directional spread is small. The September 21 expiration is also genuinely illiquid — a $47 call quoted 4¢ wide on a 17¢ mid means slippage can eat a meaningful chunk of a $62 debit before the thesis even gets tested. And selling premium, which is usually the fallback when direction is unclear, is the worst-paid it has been in this fund's recent history: an IV rank of 8 and a 1st-percentile premium versus delivered movement means you'd be collecting thin credit against realized movement that has been running near 46%. Waiting for either the $43.13 break or the $44.26 reclaim — and for a tighter-quoted expiration — costs nothing but patience.
6 · Quick FAQ
What is IBIT's expected move into September 21? About ±$2.46, or ±5.62%, from Friday's $43.77 close — a $41.31 to $46.23 range, per the options market's straddle pricing as of September 11.
Is IBIT expected to go up or down over the next week? Options positioning as of September 11 leans slightly bullish — call-heavy volume, a skew flatter than its own norm, and spot sitting near the low end of this expiration's wall corridor — but that's a read of what traders have done, not a forecast, and both technical models we checked point lower. The actionable map is the $41.31–$46.23 range and the $43.50 / $47.00 levels.
Are IBIT options expensive right now? No. IV rank of 8/100 says option prices are lower than about 92% of the past year's readings; on top of that, they're running roughly 9 vol points below the movement IBIT has actually delivered over the past 20 days — thinner than essentially every recent reading for this fund. That favors buying premium rather than selling it, with the caveat that August's big moves are still inflating the realized-volatility side of the comparison.
Where is IBIT's biggest options support and resistance? For the September 21 expiration, the put wall is $43.50 and the call wall is $47.00 — though both piles are small at that light expiration. Across the whole chain, the heaviest put open interest sits at $40.00 and the heaviest call open interest at $48.00.
What invalidates this week's read? A close below $43.13.
Methodology & disclosures. Data: end-of-day options-chain snapshot for IBIT, 2026-09-11, generated 2026-09-14T02:51:35.701Z. Prices shown are midpoints and will differ from live markets. Momentum/positioning scores and volatility-premium comparisons are descriptive measurements of past option flow and past price movement — not investment advice, signals, forecasts, or guarantees. All trade structures are hypothetical. Every structure shown has a defined maximum loss; you can lose the entire max-loss amount. Options involve substantial risk and are not suitable for all investors.