IBIT Options Imply a $2.37 Move by Sept 25 — But Every Wall Sits Below the Price
The options market is pricing IBIT between $43.65 and $48.39 into the September 25 expiration, with implied volatility near the bottom of its yearly range. Flow leans bullish, yet the heaviest open interest for that expiration is stacked entirely beneath spot — here's what that tension means and three defined-risk ways to trade it.
Listen to this analysis — prefer audio? This IBIT outlook is also available as a podcast episode:
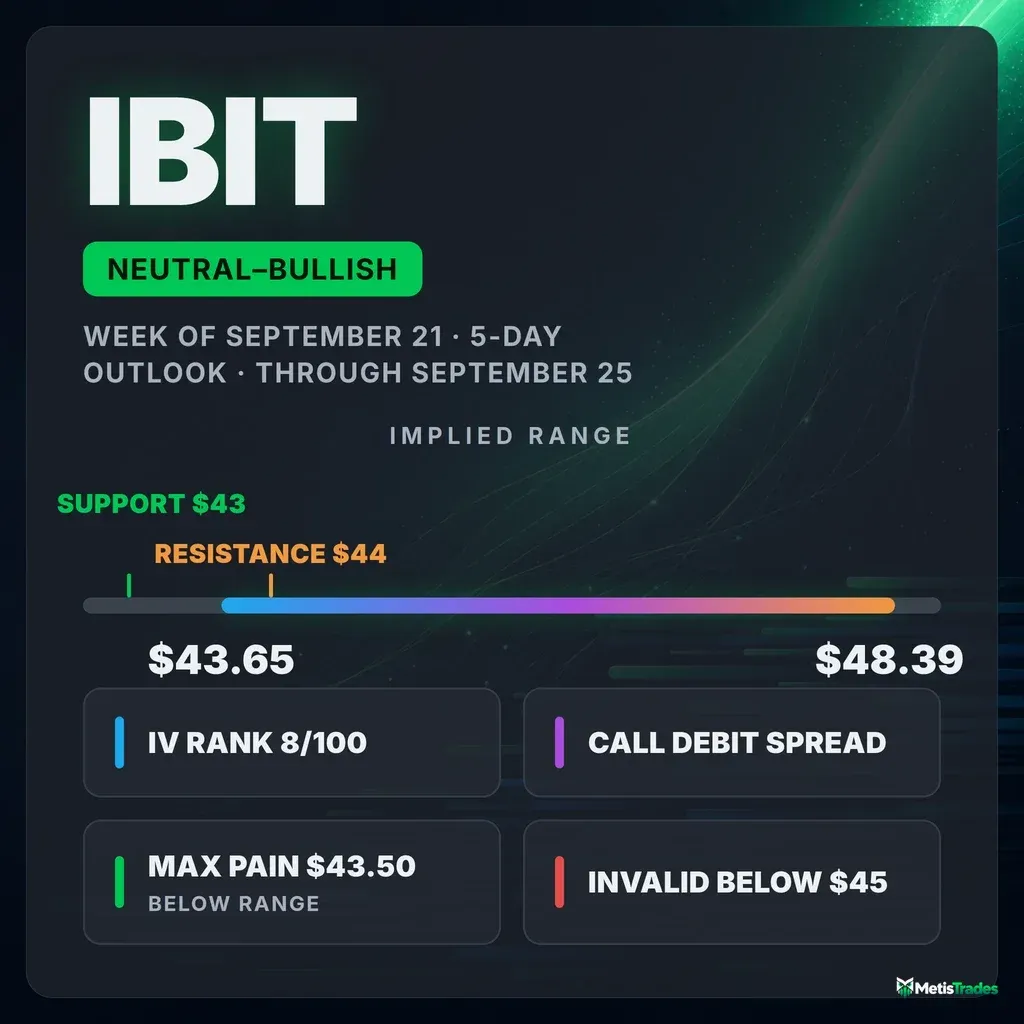
The options market implies a $43.65–$48.39 range into the September 25 expiration; here's what's driving it, where the walls actually sit, and three defined-risk ways to trade it.
Published Sunday, September 20, 2026 · Data as of Friday, September 18 close
Explore the live IBIT options data in the Detailed Options Analyzer →
Quick answer
| Item | Answer |
|---|---|
| Market bias | Slightly bullish — a modest upward lean, not a conviction call |
| Options-implied range (into Sept 25) | $43.65 – $48.39 (±5.16%, or ±$2.37) |
| Major support | $43.00 — the Sept 25 put wall |
| Major resistance | $44.00 — the Sept 25 call wall (already below spot); the next overhead cluster is $48.00 |
| Max pain (Sept 25) | $43.50 |
| Dealer gamma regime (estimate) | Positive — hedging tends to dampen moves; flip level ≈ $45.00 |
| Volatility condition | Rising off a low base — IV rank 8/100 · premium thin: options priced ~8 vol points below delivered movement |
| Technical check | Confirms (bullish, 3-day and 5-day chart models) |
| Best-fitting strategy | Sept 25 $46/$48 call debit spread |
| Analysis invalidated if | IBIT closes below $45.00 |
1 · What matters today
IBIT closed Friday, September 18 at $46.02 after a 5.1% week, and the options market is pricing roughly $2.37 up or down — about 5.2% — through the September 25 expiration. That's the move the options market is pricing in, derived from what straddles cost. Our read of the flow leans slightly bullish: call volume ran three times put volume, new call open interest swamped puts, and the extra price traders normally pay for downside protection has almost disappeared.
The counterweight is structural. For the September 25 expiration, the biggest pile of open call contracts sits at $44 and the biggest pile of puts at $43 — both below Friday's close. Price has already run past its own positioning corridor, and max pain for that date is $43.50. Two 3- to 5-day chart models both point higher, near $46.80–$46.90. One level decides it: a close below $45.00 and the bullish read is off.
2 · What the options market is pricing
What changed this week
The underlying did the heavy lifting: IBIT is up 5.14% over the last five sessions and 11.70% over twenty. Friday's session carried 1.76× the 20-day average option volume, and the mix was lopsided — put/call volume printed 0.35, meaning roughly one put traded for every three calls, against a 7-day average of 0.72 and a 14-day average of 0.65. That is one of the most call-heavy days this name has produced recently.
Open interest tells the same story with more commitment behind it. Chain-wide, call open interest grew by about 156,500 contracts on Friday while put open interest fell by roughly 136,700 — a one-day swing in new positioning that sits well above this ETF's own recent norm. The put/call open-interest ratio eased from 0.72 to 0.69 over five days (7-day average 0.72), so for every call contract held open there are about 0.69 puts.
The single biggest open-interest build was defensive, though: the September 25 $43 puts added 12,784 contracts to 15,390, which is exactly why that strike is now the week's put wall. Right behind it, the September 25 $44 calls added 10,367 (to 31,176) and the at-the-money $46 calls added 9,672 while trading $2.59 million of premium — the largest live line on the board. Traders built both rails of the September 25 corridor in a single session. Into Friday's now-settled September 18 expiration, by contrast, the $46 calls shed 8,554 contracts of open interest as they expired worthless-adjacent — history, not a live level.
One wrinkle worth naming: the short-, medium- and long-term trend reads all point the same way (price +5.1% over the past week, +11.7% over the past month, +28.5% over the past two months), so there's no divergence to referee. But a momentum crossover turned lower on September 11 before Friday's flow snapped it hard back to a bullish reading — this is a name whose positioning signal has flipped eleven times since May, which is a reason to keep directional structures short-dated.
Expected move
Into September 25, the options market is pricing about ±$2.37 (±5.16%) around Friday's $46.02 close — a range of $43.65 to $48.39. Here is the ladder:
| Expiration | Implied move | Range around $46.02 |
|---|---|---|
| Sept 23 | ±4.33% | $44.03 – $48.01 |
| Sept 25 (our horizon) | ±5.16% | $43.65 – $48.39 |
| Oct 2 | ±7.27% | $42.67 – $49.37 |
| Oct 16 | ±10.21% | $41.32 – $50.72 |
The rungs scale almost perfectly with the square root of time — 36.6% to 36.9% at-the-money implied volatility at every step — which means the market sees no single dated event inside this window. There is no bump, no hump, no kink: just a flat curve of uncertainty extending outward.
Volatility
At-the-money implied volatility — the market's estimate of how much IBIT will move, baked into option prices — is 36.87%. IV rank is 8/100, meaning today's reading is cheaper than about 92% of the past year's. IV jumped 11.8% on Friday alone (from 33.0% the prior session), but it is essentially unchanged over five days (+0.54%) and still sits below both its 30-day average (37.2%) and its 90-day average (38.3%). The front-month read is unavailable today because the nearest expiration in Friday's snapshot had already reached expiry — an expiry-day artifact, not missing data.
Meanwhile the ETF itself has been moving hard. Twenty-day realized volatility is 45.1%, running well above this fund's own recent norm, and the ratio of five-day to twenty-day realized movement is 1.26 — one of the most stretched accelerations in its recent history. Price is moving faster than it has been, and option prices have not kept up.
Premium rich or cheap? The volatility risk premium — the gap between how much movement options are priced for and how much IBIT has actually delivered — is negative about 8 vol points. Options are priced roughly eight points below the movement this fund has actually produced over the past month. That reading sits at the 8th percentile versus its own recent history: richer than only about 8% of the last three months of readings, i.e. cheaper than nearly all of them. Combine that with an IV rank of 8/100 and the verdict is unambiguous — this is a week to own premium rather than sell it. The path also matters: the gap widened steadily from about −2 vol points on August 31 to −12 points by September 17 as realized movement outran implied, then narrowed to −8 on Friday when implied volatility popped. Sellers of these options have been paid less than the underlying's actual churn has cost them.
Skew and sentiment
Skew measures whether puts and calls the same distance from the price cost the same — when puts are pricier, traders are paying up for crash protection. Right now 25-delta puts carry 37.81% implied volatility against 37.70% for the equivalent calls: a spread of 0.1 vol points, versus a 60-day median of 3.4 vol points for this name. Downside protection is nearly free relative to its own norm — traders have stopped paying up for it. That flatness is stretched well beyond this fund's typical reading, and it cuts both ways: it reflects genuine complacency, and complacency is cheap to buy insurance against.
Sentiment across the expiration curve is uniformly constructive. The 0–7 day bucket scores +39, the 7–30 day bucket +35, the 30–60 day bucket +39, and the longest bucket +44 — every rung leaning bullish, which our read labels "broadly bullish," with no single bucket dominating. Delta-weighted volume in the nearest expirations ran +0.68 call-side, and 25-delta risk reversals show calls about 5.5 vol points richer than their own 54-day baseline in the front bucket. Against a 7-day average of +16 for the nearest bucket, Friday's +39 marks a sharp near-term turn toward call demand.
The key levels map
| Level | Price | Why it matters |
|---|---|---|
| Top of the Oct 16 implied range | $50.72 | One-month outer rail the options price |
| Top of the Sept 25 implied range | $48.39 | Upper edge of this window's priced move |
| Heaviest overhead call strike (whole chain) | $48.00 | 134,697 calls open across all dates; also the Oct 16 call wall at 69,620 — the real overhead barrier |
| Swing resistance | $46.37 | Heuristic pivot cluster, the first level price must clear |
| Spot / Friday close | $46.02 | Reference for everything above and below |
| Swing support | $45.52 | Nearest heuristic support shelf below price |
| Gamma flip estimate + chain's heaviest call strike | $45.00 | One rough estimate puts the flip here; also the all-expiration call wall (207,901 contracts) and the largest single gamma strike — the pivot for this week's read |
| 20-day moving average | $44.34 | Price sits 3.79% above it |
| Sept 18 gap open / swing support | $44.24 | The breakout gap would fill here |
| Sept 25 call wall | $44.00 | 31,176 calls open — the expiration's heaviest call strike, now behind price |
| Max pain (Sept 25) | $43.50 | Where the most option value would expire worthless |
| Sept 25 put wall | $43.00 | 15,390 puts open, 12,784 of them added Friday — the week's downside shelf |
| Swing support | $42.37 | Deeper pivot cluster |
| 200-day moving average | $42.11 | Price is 9.29% above it |
| All-expiration put wall | $40.00 | 137,503 puts open — the chain's structural floor |
Note the disagreement between scopes: the whole chain's heaviest call strike is $45.00 and its heaviest put strike is $40.00, but the September 25 expiration's own walls are $44.00 and $43.00. When we talk about this week's magnets, the Sept 25 numbers are the ones that matter; the aggregates describe the longer-dated structure underneath.
Positioning and unusual flow
One rough estimate of dealer positioning puts the September 25 expiration — and the chain as a whole — in positive gamma, where market makers hedge the options they've sold in a way that tends to dampen moves rather than amplify them. The same estimate places the flip around $45.00; spot sits about 2.2% above it, which is an unremarkable distance for this name. Treat both figures as estimates built on an assumed dealer convention, not observed inventory.
Three live flow items stood out on Friday:
- Sept 25 $43 puts: +12,784 open contracts in one day (to 15,390, on 3,161 traded). That build created the week's put wall from nothing — someone laid a floor 6.6% below spot.
- Sept 25 $46 calls: 27,704 traded, $2.59 million of premium, +9,672 open contracts. At-the-money call buying at scale into a market that had just gapped up 2.2%.
- Sept 25 $50.50 calls: 4,048 traded into 5,812 brand-new open contracts. A far-out-of-the-money lottery line (7.5 delta) that did not exist the day before — the tail of the same call-chase.
The $45.50 and $45 puts expiring Monday also churned 7,308 and 24,045 contracts against tiny open interest, which is same-week hedging turnover rather than new positioning.
3 · Technical check
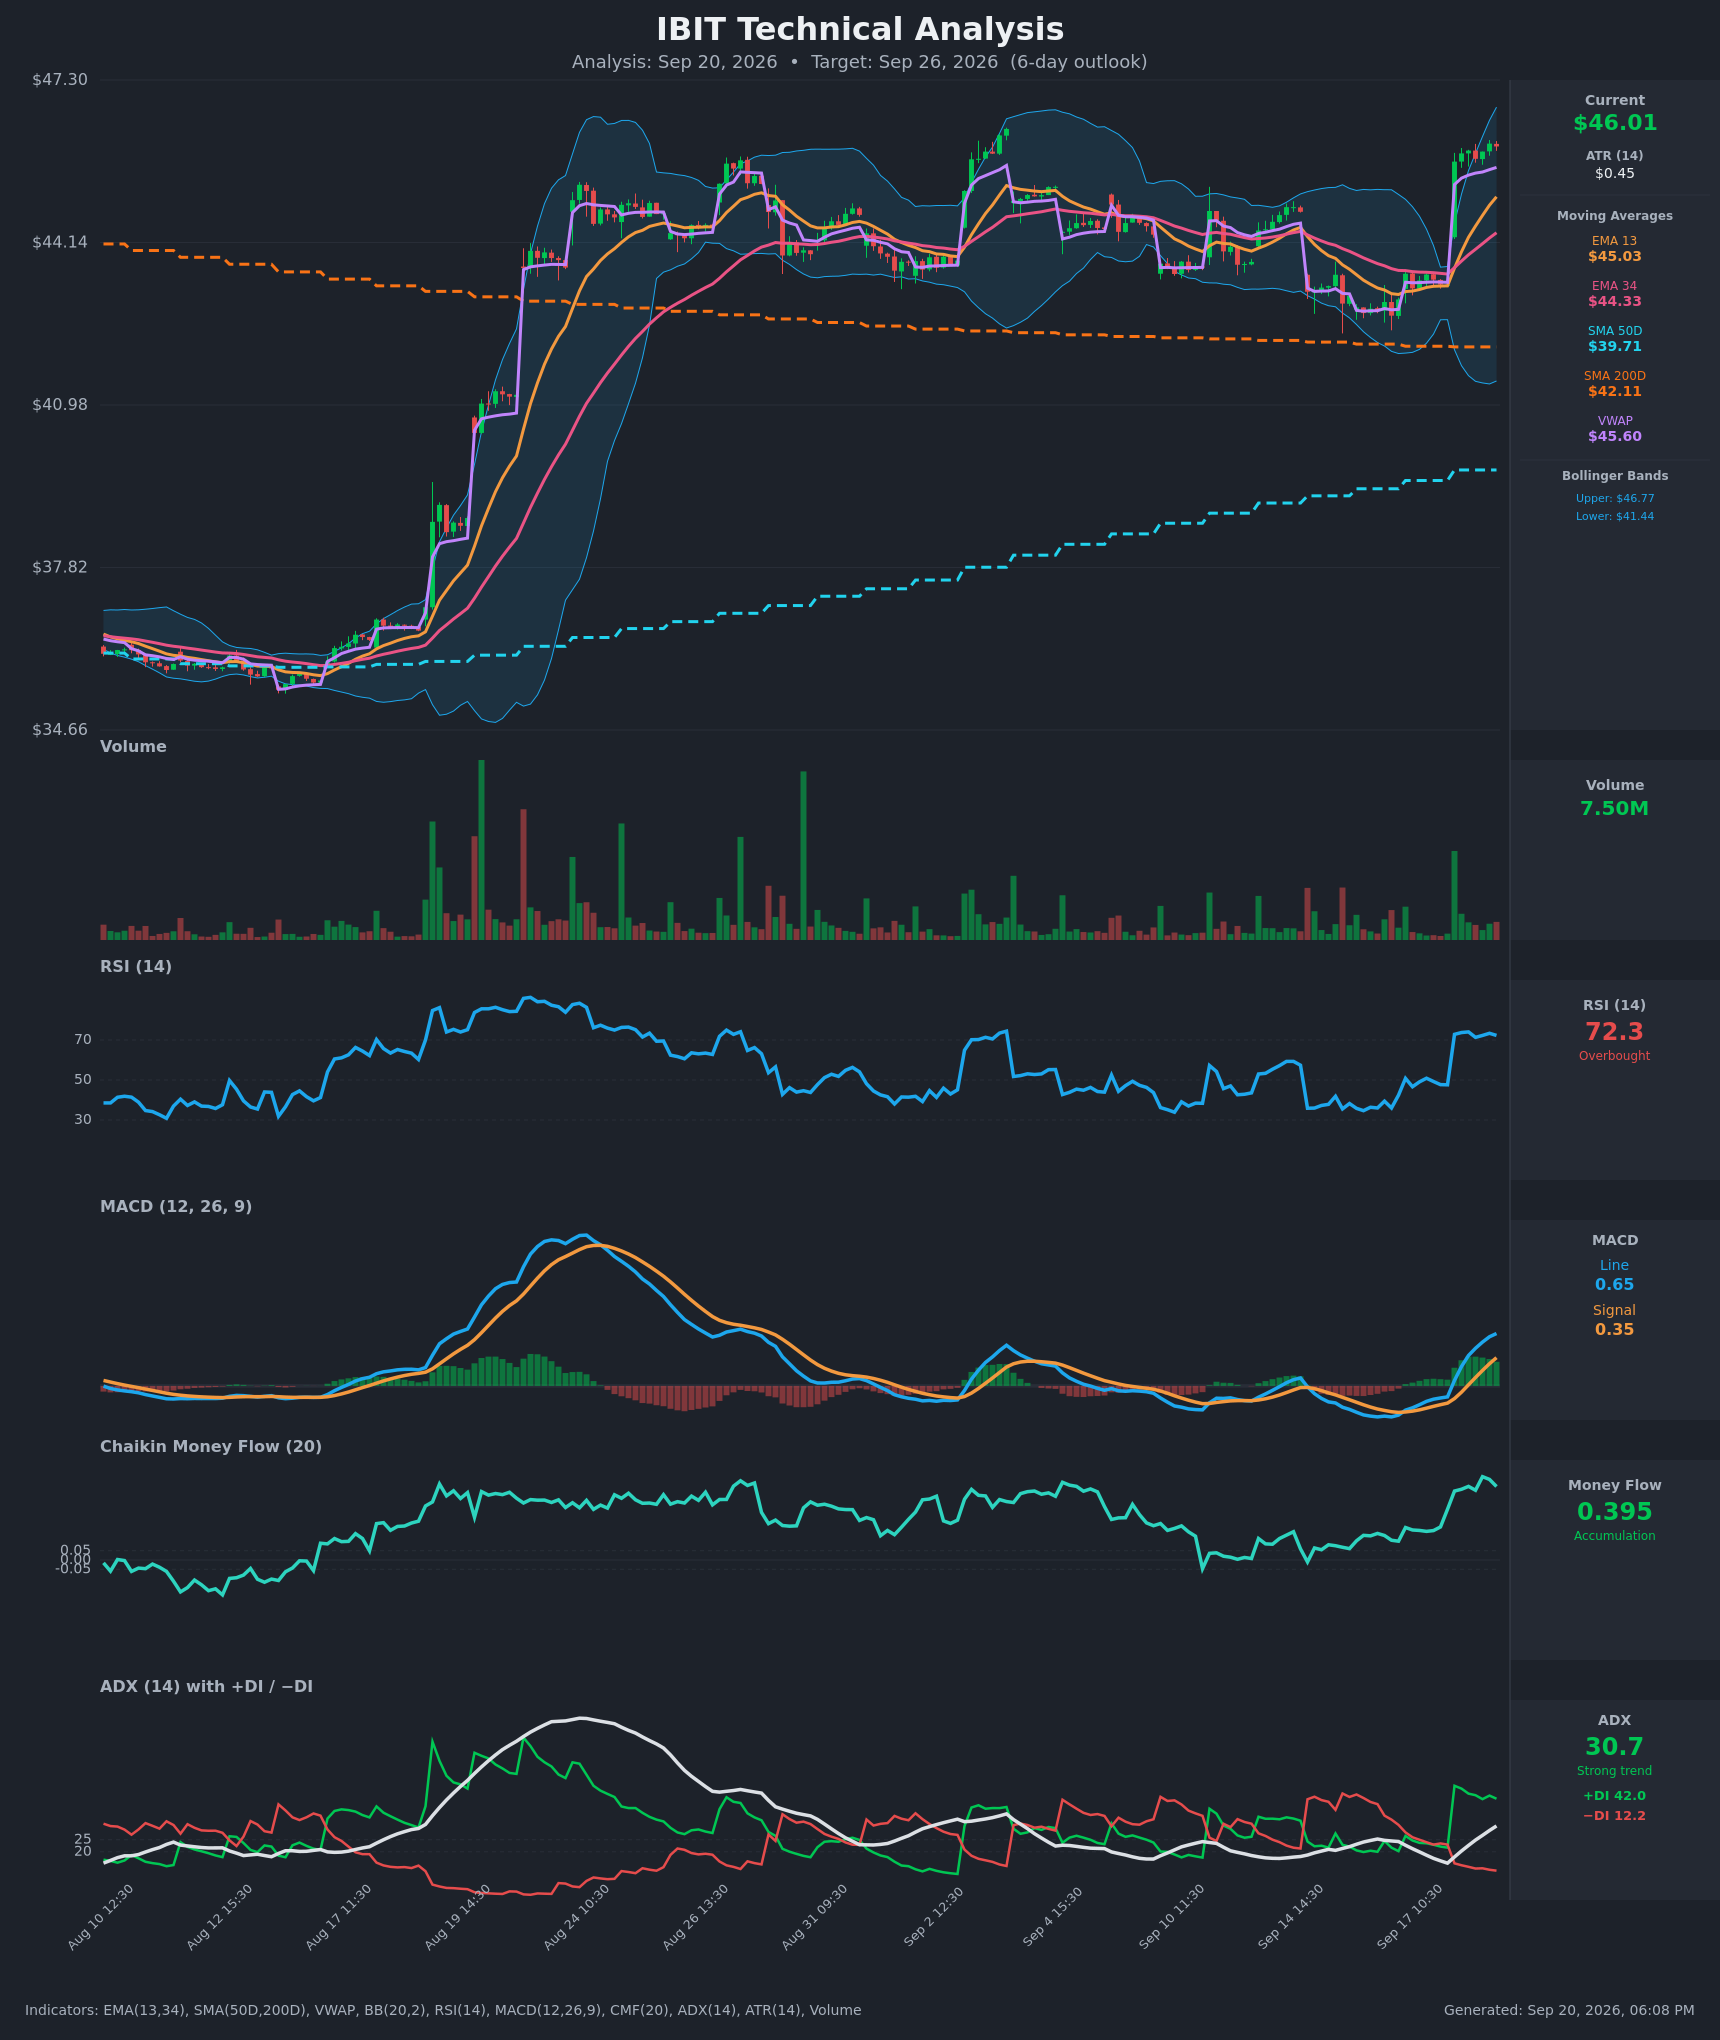
Both chart models run bullish and both fit comfortably inside what the options are pricing. The 3-day model (target date Sept 23) projects $46.80 with a forecast band of $44.85–$47.30. The 5-day model (target date Sept 25, matching our horizon) projects $46.90 with a band of $44.80–$47.60. Both cite the same evidence: a decisive EMA13/EMA34 crossover and MACD cross on September 18, ADX climbing to 30.7 with +DI (42.0) far above −DI (12.2), and Chaikin Money Flow at 0.395 — strong accumulation, not a low-volume drift.
The caveat is the same in both write-ups: RSI at 72.3 is overbought and price is pinned against the upper Bollinger Band at $46.77, so a shallow cooling-off toward the $45.00–$45.60 shelf is the most likely form of near-term trouble. Both reports name a close below EMA13 at $45.03 as the invalidation for the bullish case — which lines up almost exactly with the $45.00 gamma flip estimate and the chain's heaviest call strike. That convergence is why the invalidation level below is $45.00 and not something softer.
Model vs. Market: The options market implies $43.65–$48.39 into September 25; the 5-day technical model targets $46.90 inside a narrower $44.80–$47.60 band. The technicals confirm direction and compress magnitude — they're saying the options are paying for more tail than the chart expects to be used, which is an argument for spreads that sell the far wing rather than naked long options.
Full technical write-ups: 3-day report → · 5-day report →
4 · Three ways the next five days can go
If IBIT clears $46.37 and pushes toward the top of the range: the September 25 call wall at $44.00 is already behind price, so there's no local pile of call open interest to slow a move — the next real overhead cluster is $48.00, where 134,697 calls sit open across the chain and where the October 16 call wall is anchored. That strike also sits just under the implied top at $48.39, which is why both are natural profit-taking shelves rather than launch pads.
If IBIT drifts between $45 and $46.50: this is what positive-gamma hedging tends to produce — market makers selling strength and buying weakness, compressing the range into Friday. Max pain for September 25 is $43.50, well below spot, so the expiration's gravitational pull is downward; but max pain only exerts itself when large amounts of open interest are near the money, and at $46 most of this expiration's contracts are already deep in or out. A quiet grind that finishes between the current price and the $45 shelf is the highest-probability single outcome.
If IBIT breaks below $45.00: that is the level where our read flips. Below the estimated flip, the same dealer hedging that has been cushioning moves tends to reverse polarity and amplify selling instead. From there the map runs $44.34 (20-day average), $44.24 (Friday's gap open — an unfilled gap), $43.50 (max pain) and $43.00 (the put wall, where 12,784 contracts were added on Friday). A close below $43.00 would take price outside the entire implied range for this window.
5 · Three defined-risk structures
Prices are end-of-day midpoints as of 2026-09-18. All structures are hypothetical. Verify live prices before trading — these will be stale by the open.
Because premium is cheap on both lenses — IV rank 8/100 and options priced about eight vol points below delivered movement — the long-premium structure leads here, and the credit structure carries a warning.
If you lean bullish: Sept 25 $46/$48 call debit spread
- Trade: Buy the Sept 25 $46 call, sell the Sept 25 $48 call
- Debit: $0.625 ($0.935 − $0.310) · Max profit: $1.375 ($137.50 per spread) · Max loss: $0.625 ($62.50) · Break-even: $46.625
- Why it fits: This is the structure the volatility read wants — you're buying options that are priced below the movement this fund has actually been delivering, and capping the upside at $48.00, the chain's heaviest overhead call strike and just under the $48.39 implied top. Both chart models target $46.80–$46.90, above the $46.625 break-even.
- Makes sense only if: you think Friday's breakout has follow-through, and you accept that a flat week costs you the full debit.
- Invalidated if: IBIT closes below $45.00.
- Managing it: take profits at 60–70% of max value rather than holding for the cap — this name's positioning signal has flipped eleven times since May, so a short-term move fighting a mature run deserves early exits. Close by Wednesday, September 23 if price is still stuck under $46.37.
- Liquidity note: the $46 calls quoted 11¢ wide ($0.88/$0.99) and the $48 calls 4¢ wide ($0.29/$0.33) — in percentage terms that's 12–13% of mid, so work a limit at the midpoint. Size is not the problem: 27,704 and 38,556 contracts traded Friday.
- Analyze this position →
If you expect the range to hold: Sept 25 $43/$44/$48/$49 iron condor
- Trade: Sell the $44 put / buy the $43 put, sell the $48 call / buy the $49 call, all Sept 25
- Credit: $0.255 ($0.125 put side + $0.130 call side) · Max profit: $25.50 · Max loss: $74.50 · Break-evens: $43.745 and $48.255
- Why it fits: the short strikes sit on the two walls that matter for this expiration — $44.00 is the call wall, and the $43 long leg is the put wall itself, the strike that absorbed 12,784 new contracts on Friday. Positive-gamma hedging is the tailwind: it tends to compress rather than extend moves.
- Health warning: you're selling premium that hasn't been rich lately. With the implied-versus-delivered gap at the 8th percentile of its own recent readings, this condor collects $25.50 to risk $74.50, and its break-evens ($43.75 / $48.26) land almost exactly on the implied-move rails — you're being paid a thin price for taking the exact risk the market has already measured.
- Makes sense only if: you specifically believe realized movement is about to slow from its current 45% pace, not merely that price won't trend.
- Invalidated if: IBIT closes outside $43.00–$48.00 — at that point one short strike is breached and the structure is defending, not collecting.
- Managing it: close at ~50% of max credit; exit regardless by Wednesday, September 23 given how little cushion the credit provides against a gamma-heavy final two days.
- Liquidity note: the $43 puts traded 2¢ wide ($0.13/$0.15) on 3,161 contracts, the $44 puts 3¢ wide on 7,873, the $48 calls 4¢ wide on 38,556 and the $49 calls 2¢ wide on 2,525 — tight in pennies but 11–14% of mid, so a sloppy fill eats a meaningful share of a $0.255 credit.
- Analyze this position →
If you lean bearish: Sept 25 $45/$43.50 put debit spread
- Trade: Buy the Sept 25 $45 put, sell the Sept 25 $43.50 put
- Debit: $0.350 ($0.530 − $0.180) · Max profit: $1.150 ($115.00) · Max loss: $0.350 ($35.00) · Break-even: $44.65
- Why it fits: it targets the magnet the expiration's own structure points at — max pain at $43.50 — and it is the cheap way to express the one thing the flow is not paying for: downside. With 25-delta puts carrying only 0.1 vol points over calls against a 3.4-point norm, protection is priced as if nothing can go wrong. The long strike sits right at the $45.00 pivot, so the spread starts working the moment the invalidation level breaks.
- Makes sense only if: you read Friday's gap as exhaustion (RSI 72.3, price against the upper band) rather than a breakout.
- Invalidated if: IBIT closes above $46.37, the first swing-resistance shelf — at that point the setup has failed and the remaining premium is time decay.
- Managing it: this is a 5-day lottery-adjacent trade; take 50–60% of max value if it comes quickly and let it expire rather than adding to it. Never size it as a hedge for something larger — $35 of risk hedges $35.
- Liquidity note: the $45 puts traded 6¢ wide ($0.50/$0.56) on 2,631 contracts; the $43.50 puts were 4¢ wide ($0.16/$0.20) — that's roughly 22% of mid on the short leg, the widest of anything quoted here. Leg in at the mid or skip it.
- Analyze this position →
If none of these: no trade
There is a clean case for standing aside. Everything about this week's setup is short-dated and reflexive: a 2.2% gap on Friday, implied volatility that jumped 11.8% in a day off a one-year low, and a positioning signal that has reversed eleven times in four months. The debit structures need direction inside five sessions to pay. And the credit structure is exactly the trade the data argues against — with the implied-versus-delivered gap at the 8th percentile of its own history, selling this condor means collecting less than the fund's actual churn has been costing sellers. Standing aside beats selling premium here, and if you have no view on direction, "cheap options" alone is not a reason to own them. Waiting for a close back above $46.37 or below $45.00 gives you the same structures with a level to lean on.
6 · Quick FAQ
What is IBIT's expected move this week? About ±$2.37 (±5.16%) into the September 25 expiration — a range of $43.65 to $48.39 around Friday's $46.02 close, per the options market's straddle pricing as of September 18.
Is IBIT expected to go up or down over the next five days? Options positioning as of September 18 leans slightly bullish — call volume roughly tripled put volume, new call open interest swamped puts, and downside skew has collapsed to 0.1 vol points against a 3.4-point norm — but that is a read of what traders have done, not a forecast. The actionable map is the $43.65–$48.39 range and the $43.00 / $44.00 levels, with $45.00 as the line that changes the read.
Are IBIT options expensive right now? No — on both lenses they are cheap. IV rank of 8/100 says option prices are lower than 92% of the past year's readings; on top of that, they're running about 8 vol points below the movement IBIT has actually delivered over the past month, thinner than roughly 92% of this fund's own recent readings. That combination favors owning premium rather than collecting it.
Where is IBIT's biggest options support and resistance? For the September 25 expiration, the put wall is $43.00 (15,390 contracts) and the call wall is $44.00 (31,176 contracts) — both below Friday's $46.02 close. Across the whole chain the heaviest call strike is $45.00 and the heaviest put strike is $40.00.
What invalidates this week's read? A close below $45.00 — the estimated gamma flip level, the chain's heaviest call strike, and the level both chart models name as their own invalidation.
Methodology & disclosures. Data: end-of-day options-chain snapshot for IBIT, 2026-09-18, generated 2026-09-20T18:08:13.562Z. Prices shown are midpoints and will differ from live markets. Momentum/positioning scores and volatility-premium comparisons are descriptive measurements of past option flow and past price movement — not investment advice, signals, forecasts, or guarantees. All trade structures are hypothetical. Every structure shown has a defined maximum loss; you can lose the entire max-loss amount. Options involve substantial risk and are not suitable for all investors.