IBIT Options Are Pricing a $2.08 Move Into October 30, and Both Walls Sit at $48
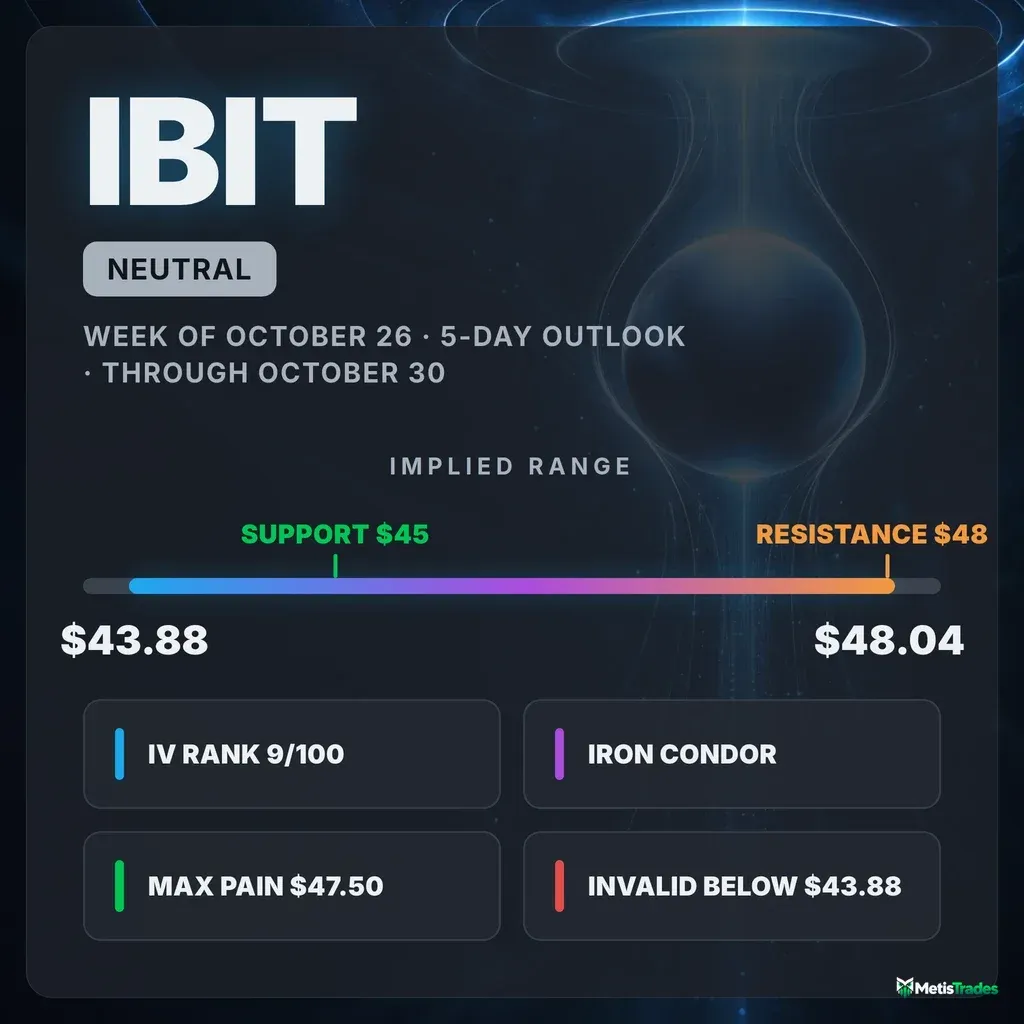
Options imply a $43.88–$48.04 range for IBIT into the October 30 expiration. Max pain sits at $47.50, and both the heaviest call and put strikes for that expiry are stacked at $48. Here is what is driving the setup, where the chart models disagree, and three defined-risk ways to trade it.
Listen to this analysis — prefer audio? This IBIT outlook is also available as a podcast episode:
The options market implies a $43.88–$48.04 range for IBIT into the October 30 expiration. Below: what is driving that range, why the $47.50–$48 zone matters, and three defined-risk ways to trade it.
Published Sunday, October 25, 2026 · Data as of Friday, October 23, 2026 close
Explore the live IBIT options data in the Detailed Options Analyzer →
Quick answer
| Item | Answer |
|---|---|
| Market bias | Neutral |
| Options-implied range (into October 30) | $43.88 – $48.04 (±$2.08, ±4.53%) |
| Major support | $45.00: the largest October 30 put open interest below spot, and a top-gamma strike. Swing support sits at $45.26 and the 50-day average at $45.14. Note that the October 30 put wall is at $48.00, above spot. |
| Major resistance | $48.00 (October 30 call wall, also that expiry's put wall) |
| Max pain (October 30) | $47.50 |
| Dealer gamma regime (estimate) | Positive, so hedging tends to dampen moves. Flip level ≈ $49 (spot already sits below it, so the cushion is thin) |
| Volatility condition | Neutral. IV rank 9.38/100. Premium is rich: options are priced ~13 vol pts above delivered movement (earnings date on the calendar, so this is not treated as free premium) |
| Next earnings | November 9 (time not specified), after the October 30 expiration |
| Technical check | Diverges: both chart models lean bearish. The 4-day model targets $45.55 (range $44.95–$46.85); the 6-day model targets $45.40 (range $44.10–$46.90) |
| Best-fitting strategy | October 30 $43/$44/$48/$49 iron condor, if you accept penny-wide fills |
| Analysis invalidated if | IBIT closes below $43.88 |
1 · What matters today
Our read of IBIT's options positioning is neutral. Options are pricing a move of about $2.08 either way into the October 30 expiration, which works out to a range of $43.88 to $48.04 around Friday's $45.96 close.
The single most important feature is where open contracts are piled up. For the October 30 expiration, the heaviest call strike and the heaviest put strike are both $48. Max pain, the price where the most option value would expire worthless, sits at $47.50. That cluster sits just above the stock and tends to act like a magnet into expiration.
Against that, traders are paying unusually steep prices for downside protection. The one level that changes the picture is $43.88: a close below the bottom of the implied range would mean sellers have overwhelmed the positioning.
Both chart-based technical models lean modestly bearish, which we treat as a caution flag rather than a reason to pick a side.
2 · What the options market is pricing
What changed this week
IBIT had a round trip. It closed at $46.30 on October 19 and ran to $47.84 on October 21. On October 22 it gapped down 3.26% at the open, and it finished Friday, October 23 at $45.96. The net result is a 0.41% decline over five sessions and a 3.38% decline over 20.
Implied volatility, the market's estimate of how much IBIT will move baked into option prices, slipped 1.2% over the five days and fell 2.6% on Friday alone.
The put/call volume ratio measures how much put activity there is relative to calls; above 1 means puts dominate. It dropped to 0.53 on Friday, against a 7-day average of 0.84 and a 14-day average of 0.90. Friday's flow was decidedly call-heavy after a week of put-heavy sessions.
Open interest means contracts currently held open. The open-interest version of the put/call ratio held at 0.69, right on its 7-day average of 0.69, so the standing book barely shifted. The biggest forward-looking open-interest build was in the October 26 $45 puts, which jumped by 6,742 contracts to 7,281 on 13,538 traded. Into Friday's now-settled expiration, the October 23 $47 calls had added 8,852 contracts, but that is history now.
The short- and long-term trend reads don't agree:
- Over the past week the read is neutral.
- Over roughly the past month it is bearish, with price down 3.4%.
- Over the past two-plus months it is still firmly bullish, with IBIT up 28.1%.
The near-term pullback is happening inside a larger uptrend. Notably, the short-term momentum line crossed back above its slower average on Friday.
Expected move
The expected move is the move the options market is pricing in, derived from what straddles cost. For the October 30 expiration it is ±4.53%, or ±$2.08, built on that expiration's at-the-money IV of 32.7%.
| Expiration | Implied move | Range around $45.96 |
|---|---|---|
| October 28 (checkpoint) | ±3.66% | $44.28 – $47.64 |
| October 30 (target) | ±4.53% | $43.88 – $48.04 |
| November 6 | ±7.37% | $42.57 – $49.35 |
| November 20 (~1 month) | ±10.38% | $41.19 – $50.73 |
The near-dated weeklies are noticeably cheaper than the rest of the curve. At-the-money IV runs about 24.7% for October 26, 32.7% for October 30, and roughly 37% from November 4 onward. That is why the implied move widens faster than time alone would explain once you step past the first week of November.
Volatility
The headline at-the-money IV is 37.35%, interpolated across the chain. It sits a hair above its 30-day average of 37.1% and just below its 90-day average of 37.6%, so the direction is essentially flat. The 60-day tenor reads 38.4%.
IV rank shows where today's IV sits versus the past year. At 9.38/100, today's level is cheaper than roughly 91% of the past year's range, and the IV percentile of 23.4 says the same thing in a different way.
Term structure means comparing option prices across different expiration dates. The front-month read is unavailable today because Friday was an expiration day, but the per-expiration table above shows an upward-sloping curve.
Movement itself has been uneven. Twenty-day realized volatility is unusually low for IBIT compared with its own recent history. ("Unusually" here means unusual for IBIT, not versus the broader market.) Meanwhile the past five days have moved about 1.5 times faster than the past month, which is well above this stock's norm. Friday's gap day is the culprit.
Premium: rich or cheap? The volatility risk premium is the gap between how much movement options are priced for and how much IBIT has actually delivered. When it's positive, option sellers have been collecting more than realized movement cost them.
- Right now options are priced about 13 vol points above IBIT's 24.0% 20-day realized volatility.
- Its percentile reading is 96/100. That compares today's gap with this stock's own recent readings, so 96 means richer than 96% of them.
- The gap was negative as recently as October 12. It jumped to about 18 points by October 19, then eased back to 13.
Much of that jump is mechanical. The large mid-September swings, including a 4.47% gap up on September 21, rolled out of the 20-day realized-volatility window, which pushed realized volatility down without anyone repricing options.
So we have IV rank near the bottom of its yearly range alongside a 96th-percentile premium over delivered movement. On paper that favors collecting premium. However, with a November 9 report date on the calendar, we don't treat that richness as a free edge.
Earnings on the calendar
The data provider's earnings calendar lists a report for November 9, with no time of day specified. That lands after both the October 30 and November 6 expirations, and before November 13.
The chain shows no visible footprint of it. At-the-money IV is essentially identical for November 6 (37.6%), November 13 (37.7%) and November 20 (37.5%), with no hump at the first post-report rung. No prior reported results are on file.
Skew and sentiment
Skew means puts and calls the same distance from the stock price don't cost the same; when puts are pricier, traders are paying up for crash protection. Today:
- 25-delta puts carry 39.5% IV versus 36.4% for 25-delta calls.
- That is a 3.1-vol-point gap, against a 60-day norm of just 0.8 points for this name and a 14-day average of 2.1.
- Skew is stretched well past its own history: traders are paying a clear premium to protect against a drop.
- It has eased slightly, about 0.8 points flatter than five sessions ago.
Flow pulled the other way on Friday. Seven call contracts cleared an unusually high volume bar versus peer contracts, compared with three puts. That is an unusually call-tilted reading for IBIT. New open interest still leaned to puts, with about 19,953 put contracts added versus 3,451 calls.
Sentiment in short-dated options is flat. The 0–7 day bucket scores 0 and the 7–30 day bucket scores +4, both close to their 7-day averages of +4 and +6. The overall regime reads "Calm."
The key levels map
| Level | Price | Why it matters |
|---|---|---|
| Whole-chain heaviest call strike | $50.00 | 147,933 call contracts across all expirations, the big overhead pile |
| Swing resistance | $49.31 | Top of the recent pivot cluster |
| Gamma flip (estimate) | ≈ $49 | One rough estimate of where hedging flips; spot is already below it |
| Implied range high (Oct 30) | $48.04 | Upper edge of the priced move |
| Call wall and put wall (Oct 30) | $48.00 | 29,551 calls and 23,556 puts; the largest gamma strike in the chain |
| Oct 22 gap origin | $47.84 | Prior close before the 3.26% gap down; the gap is unfilled |
| Max pain (Oct 30) | $47.50 | Where the most October 30 option value expires worthless |
| Swing resistance | $47.44 | Pivot cluster |
| 20-day average | $47.02 | Price is 2.26% below it |
| Swing resistance | $46.71 / $46.09 | Nearby overhead pivots |
| Spot (Oct 23 close) | $45.96 | Reference |
| Swing support | $45.26 | Nearest pivot below |
| 50-day average | $45.14 | Rising; also the chart models' first support |
| Oct 30 put cluster | $45.00 | 12,383 open puts, the largest below spot; second-largest gamma strike |
| Implied range low (Oct 30) | $43.88 | Lower edge of the priced move and our invalidation level |
| Swing support | $43.23 | Next pivot down |
| 200-day average | $41.67 | Long-term trend line, still well below |
| Whole-chain heaviest put strike | $40.00 | 74,506 put contracts across all expirations |
The 52-week range spans $32.84 to $65.97, which puts IBIT 30% below its high.
Positioning and unusual flow
A call wall or put wall is the strike with the biggest pile of open call or put contracts; these often act like magnets or barriers. For October 30, both sit at $48.00, which is unusual. The whole-chain aggregates are spread far wider, at $50 for calls and $40 for puts. Those aggregate levels describe the broader map; the $48 cluster is the one that matters for this window.
Market makers hedge the options they've sold. One rough estimate puts both the whole chain and the October 30 expiration in a positive-gamma regime, where hedging tends to dampen moves. That same estimate, though, places its flip level near $49, above the current price. Spot sits somewhat further below that flip than is typical for IBIT, so read any cushioning as soft rather than firm. The October 26 expiration's own estimate is negative.
The flow worth noting:
- October 30 $46.5 calls: 22,259 contracts traded against just 2,631 open, about $1.34 million in premium. This was the day's largest dollar trade, aimed squarely at the $47.50–$48 zone.
- October 27 $48 calls: 27,333 contracts traded against 351 open. That is fresh, very short-dated upside speculation.
- October 30 $45 puts: open interest rose by 4,075 to 12,383, building the floor-side cluster beneath spot.
3 · Technical check
The 4-day chart model (target date October 28) is bearish, with a target of $45.55 and a projected range of $44.95–$46.85. The options market's October 28 range is $44.28–$47.64, so the target sits inside the priced move. The direction, however, diverges from our neutral read.
The model sees a bearish flag after the October 22 drop. Its dominant scenario is invalidated by a close back above $46.45. Two readings soften that call:
- Trend strength (ADX) has faded from about 35 to 24.5, below the usual trend threshold.
- Money-flow (CMF) has stayed positive throughout the decline.
Together these suggest the selloff is maturing into a pause.
The 6-day chart model (target October 30) is also bearish, with a target of $45.40 and a range of $44.10–$46.90. That too sits inside the options-implied $43.88–$48.04, so it diverges on direction but not on magnitude.
Neither model calls for a move bigger than the market is pricing. The disagreement is about tilt, not size.
Model vs. Market: The options market implies $44.28–$47.64 into October 28; the 4-day technical model targets $45.55. Open interest leans toward a pin near $47.50–$48, while the chart sees a drift toward $45, so a close below $45.14 by the checkpoint would hand the argument to the chart.
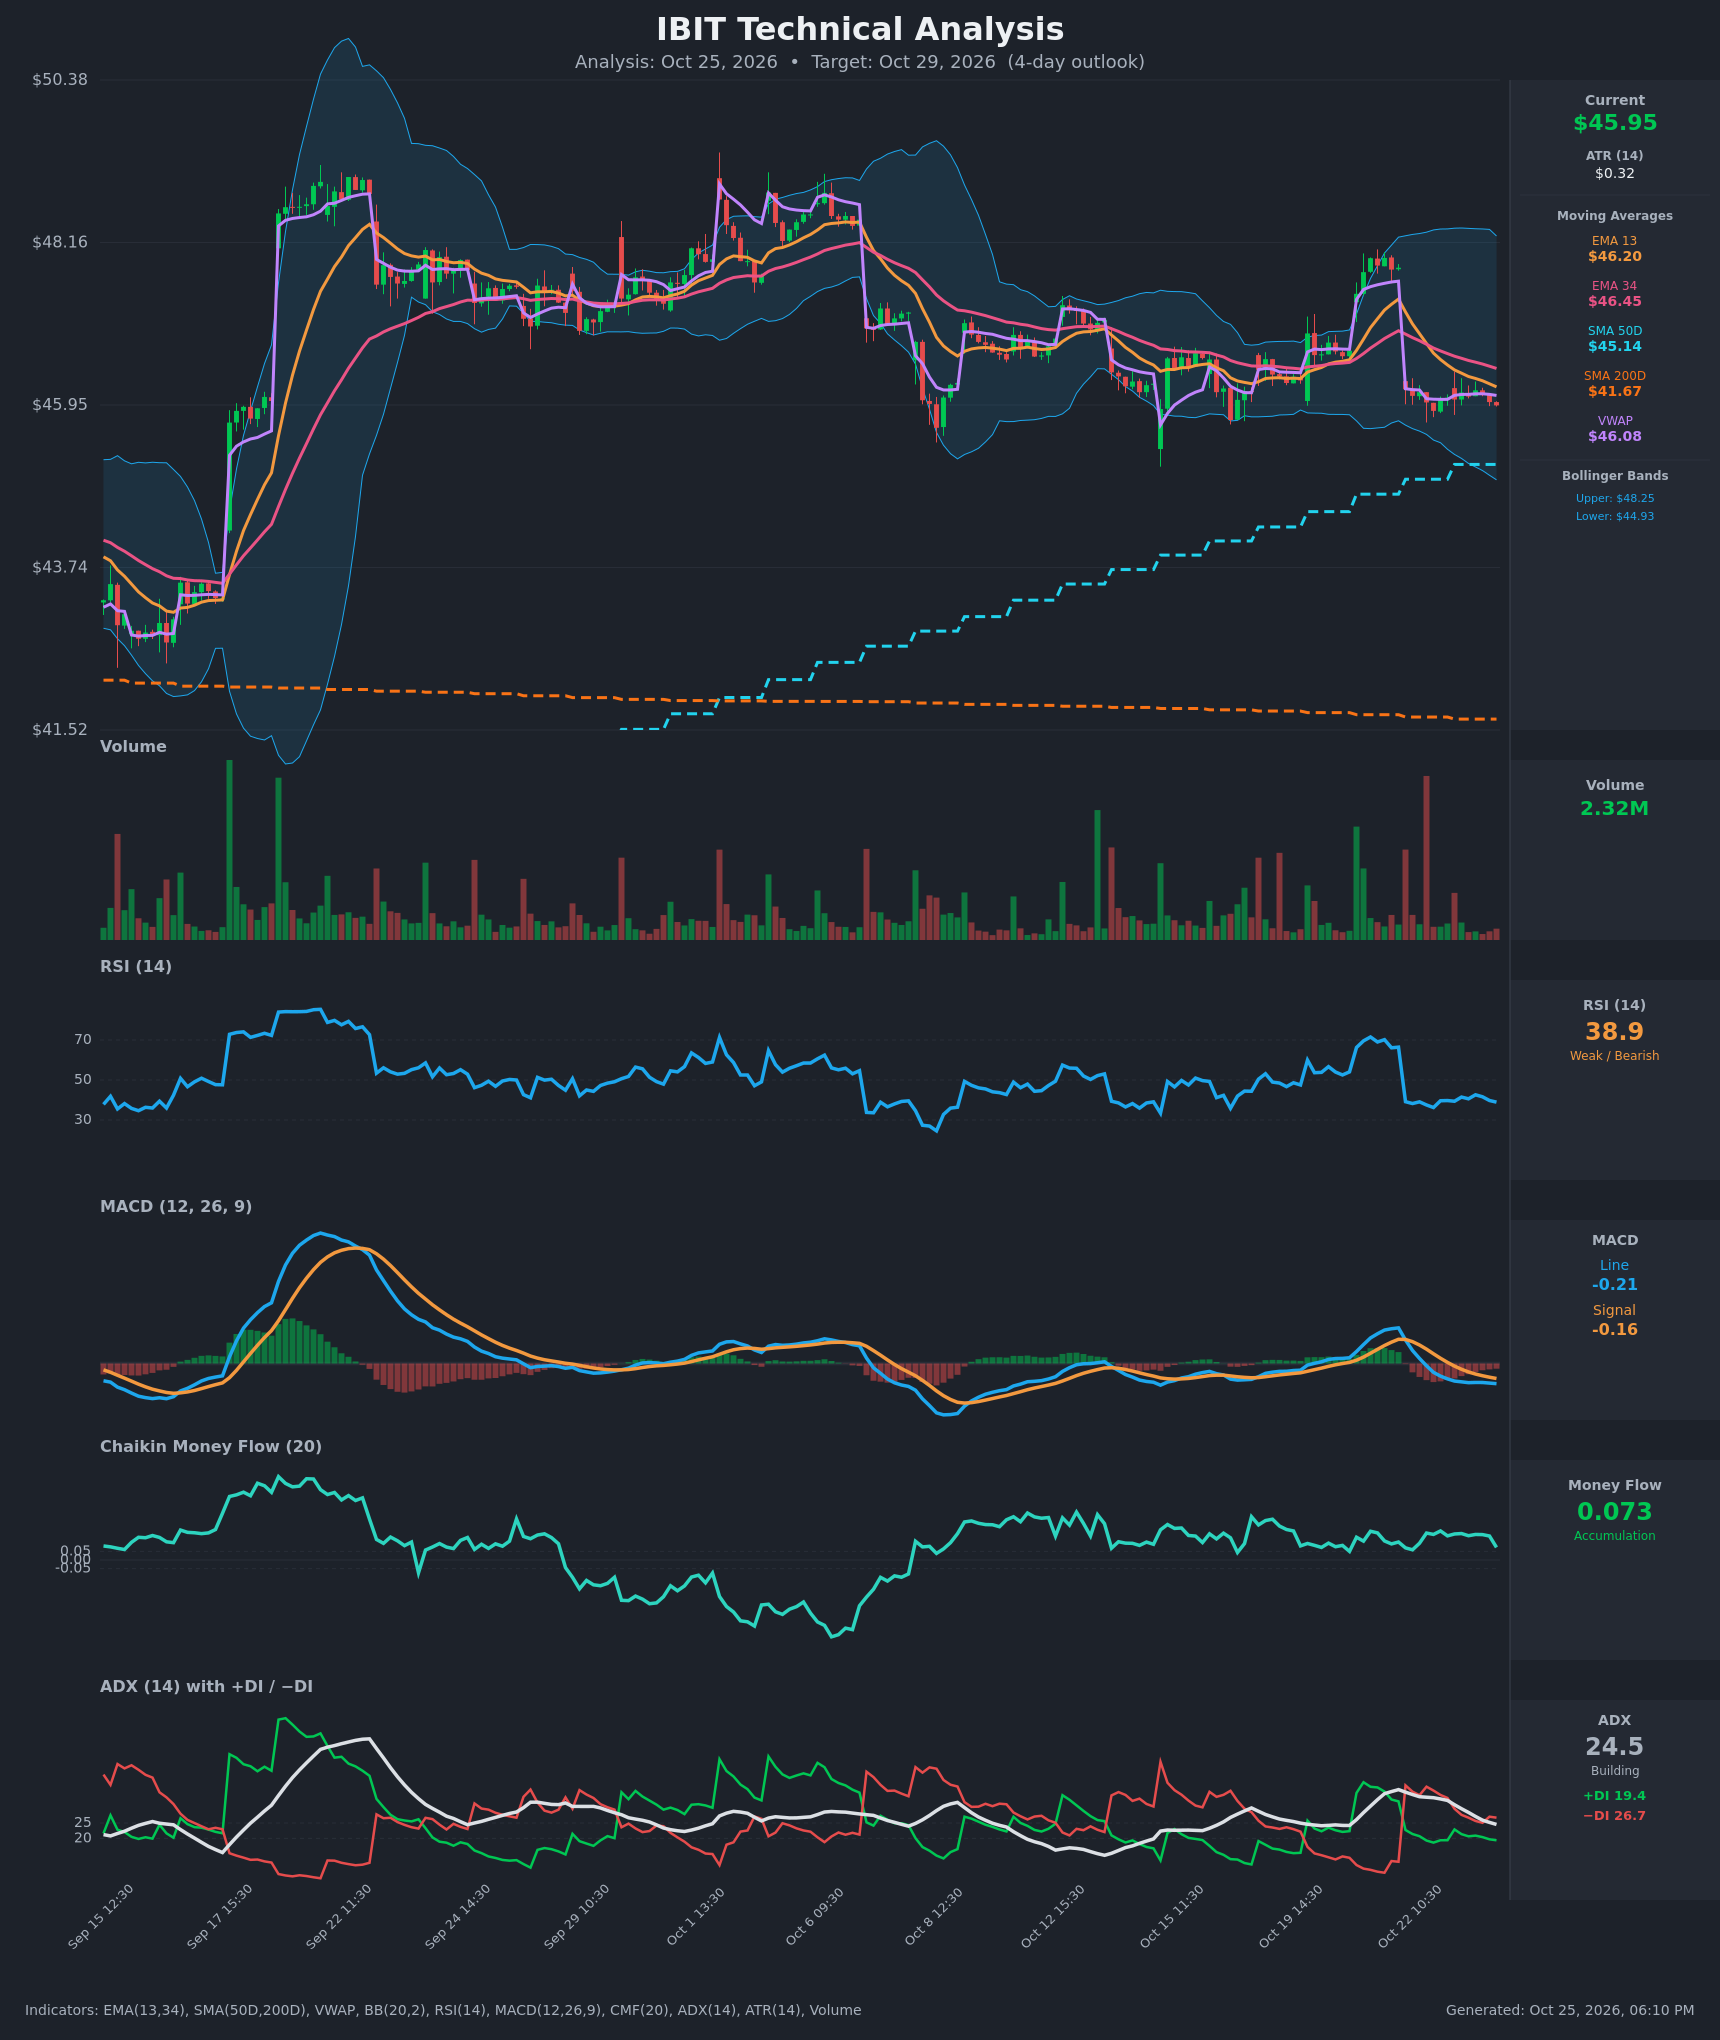
The TA nudged one strike choice: the bearish spread below targets $45, close to both models' targets.
Full technical write-ups: 4-day report → · 6-day report →
4 · Three ways the next 5 days can go
If IBIT pushes above the October 30 call wall ($48.00): The heaviest call open interest for the expiration sits right there, and heavy call piles tend to slow rallies. A clean break above $48.04 would take price outside the implied range, with thinner positioning until the ≈$49 gamma-flip estimate and the $50 whole-chain call pile.
If IBIT drifts between $45 and $48: This is the pin case. With max pain at $47.50 and both walls at $48, hedging flows and expiring contracts tend to pull price toward the upper half of this band into October 30. Friday's call buying at $46.5 and $48 fits that picture.
If IBIT breaks below the $45 put cluster: The positioning floor thins out quickly below $45. Spot is already beneath the ≈$49 flip estimate, where one rough estimate suggests hedging cushions less than usual. A slide toward $43.88 could therefore run faster than the dampened-gamma label implies. The steep put skew shows traders are already paying up for exactly this branch.
5 · Three defined-risk structures
Prices are end-of-day midpoints as of October 23, 2026. All structures are hypothetical unless flagged as an entered position. Verify live prices before trading; these will be stale by the open.
Because our read is neutral, the range structure leads. All three expire October 30, ten days before the November 9 report date.
If you expect the range to hold: October 30 iron condor
An iron condor combines a put credit spread and a call credit spread. You collect premium upfront and keep it if IBIT finishes between the two short strikes.
- Trade: Sell the $44 put / buy the $43 put, and sell the $48 call / buy the $49 call, all expiring October 30.
- Credit: $0.20 · Max profit: $20 · Max loss: $80 · Break-evens: $43.80 and $48.20
- Why it fits: The short strikes sit near the edges of the $43.88–$48.04 implied range. The short call is placed at the $48 wall, and max pain at $47.50 sits comfortably inside the tent.
- Makes sense only if: You accept a $1-wide structure with a poor reward-to-risk ratio in exchange for a high-probability zone.
- Invalidated if: IBIT closes below $43.88 or above $48.04.
- Earnings exposure: Expires ten days before the November 9 report, so there is no earnings-gap risk.
- Managing it: Close at about 50% of the credit. If either short strike is breached on a close, exit rather than hope. Exit regardless on October 29.
- Liquidity note: The $44 puts trade 2¢ wide on a 22¢ mid, and the $48 calls 2¢ wide on 18¢. That is penny-tight in dollars but roughly 9–11% of mark, so work limit orders at mid.
- Analyze this position →
If you lean bullish: October 30 $46.5/$48 bull call spread
A debit spread means you pay upfront, and you profit if IBIT rises toward the short strike.
- Trade: Buy the October 30 $46.5 call, sell the October 30 $48 call.
- Debit: $0.42 · Max profit: $108 · Max loss: $42 · Break-even: $46.92
- Why it fits: It targets the max-pain and wall cluster at $47.50–$48, the same strikes that drew Friday's $1.34 million call trade. Selling the $48 call also offsets some of the rich premium you pay on the long leg.
- Makes sense only if: IBIT holds $45 and starts reclaiming the October 22 gap.
- Invalidated if: IBIT closes below $45.00.
- Earnings exposure: Expires ten days before the November 9 report, so there is no earnings-gap risk.
- Managing it: Take profits near $47.50 rather than waiting for $48. The month-long trend is still down even though the two-month trend is up, so this is a short-dated trade, not a hold. Exit by October 29.
- Liquidity note: The $46.5 calls traded 2¢ wide (3.3%) on 22,259 contracts, so fills are easy. The $48 calls are 2¢ wide.
- Analyze this position →
If you lean bearish: October 30 $46/$45 bear put spread
- Trade: Buy the October 30 $46 put, sell the October 30 $45 put.
- Debit: $0.38 · Max profit: $62 · Max loss: $38 · Break-even: $45.62
- Why it fits: Steep put skew shows real demand for downside. Both chart models target $45.40–$45.55, and $45 is the heaviest put strike below spot, a natural landing zone.
- Makes sense only if: IBIT fails to reclaim $46.45 and the bearish-flag read plays out.
- Invalidated if: IBIT closes above $47.02.
- Earnings exposure: Expires ten days before the November 9 report, so there is no earnings-gap risk.
- Managing it: Close near $45.14–$45.00. Don't hold for a breakdown beyond the short strike, because the rising 50-day average sits right there. Exit by October 29.
- Liquidity note: The $46 puts trade 2¢ wide (about 2.4%) and the $45 puts 2¢ wide (about 4.5%), so fills are reasonable.
- Analyze this position →
If none of these: no trade
Standing aside is reasonable here. Premium looks rich versus delivered movement, but part of that richness is a window effect: big September swings dropped out of the realized-volatility calculation. The other part sits against an IV rank of 9.38, which is cheap by yearly standards. That is not the clean "sell expensive options" setup it appears to be.
The condor's $1 widths also risk $80 to make $20. A single gap like October 22's 3.26% drop would blow through either side.
If you can't monitor intraday, or you don't want to take a side when the options and chart reads disagree, flat is a position.
6 · Quick FAQ
What is IBIT's expected move over the next 5 days? About ±$2.08 (±4.53%) into the October 30 expiration, a $43.88–$48.04 range, per straddle pricing as of October 23.
Is IBIT expected to go up or down by October 30? Options positioning as of October 23 is neutral. Open interest clusters above spot at $47.50–$48, while put skew is unusually steep. That is a read of what traders have done, not a forecast. The actionable map is the $43.88–$48.04 range, with $45.00 support and $48.00 resistance.
Are IBIT options expensive right now? IV rank of 9.38/100 says option prices sit near the low end of the past year's range. Measured against movement IBIT has actually delivered, though, they run about 13 vol points rich, which is higher than 96% of this stock's recent readings. Part of that gap is a window effect, and a report date is on the calendar, so we don't treat it as free premium.
When is IBIT's next earnings report? The data provider lists November 9, with no time specified. That is after the October 30 and November 6 expirations. The chain currently shows no added premium around that date.
Where is IBIT's biggest options support and resistance? For October 30, the call wall and the put wall are both at $48.00, with max pain at $47.50. The largest put pile below spot is at $45.00. Across all expirations, the heaviest strikes are $50 for calls and $40 for puts.
What invalidates this read? A close below $43.88, the bottom of the implied range.
Methodology & disclosures. Data: end-of-day options-chain snapshot for IBIT, 2026-10-23, generated 2026-10-25T18:10:33.287Z. Prices shown are midpoints and will differ from live markets. Momentum/positioning scores and volatility-premium comparisons are descriptive measurements of past option flow and past price movement — not investment advice, signals, forecasts, or guarantees. Earnings dates and reported results are from the data provider's earnings feed as of 2026-10-25T18:10:33.287Z; report dates can change. All trade structures are hypothetical. Every structure shown has a defined maximum loss; you can lose the entire max-loss amount. Options involve substantial risk and are not suitable for all investors.