IBM Options Are Pricing a $9.99 Move — The Chart Model Sees $226
IBM's options market implies a $219.56–$239.54 range into the September 25 expiration, with the heaviest put open interest parked right under spot at $227.50. The chart model disagrees on direction — here's the level that settles it, plus three defined-risk ways to trade the gap.
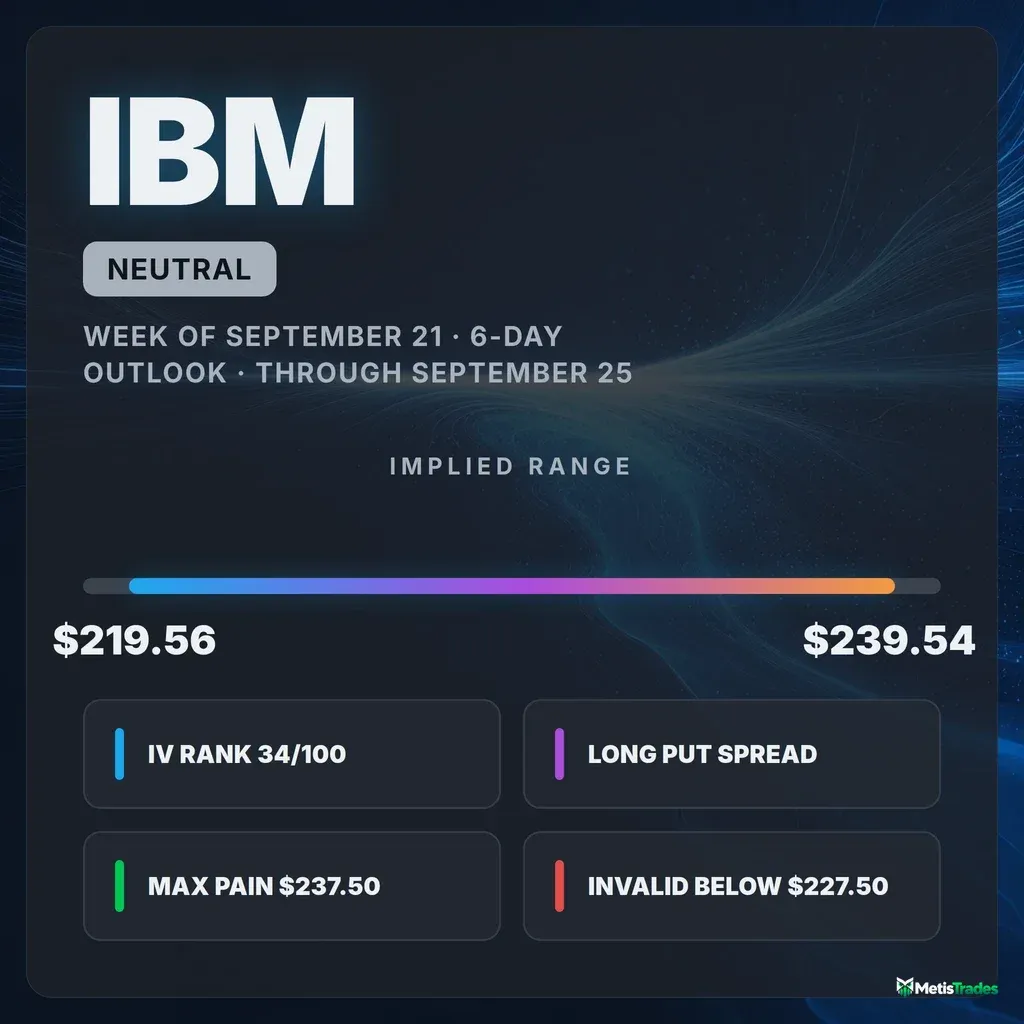
The options market implies a $219.56–$239.54 range into the September 25 expiration; here's what's driving it, where the real levels sit, and three defined-risk ways to trade it.
Published Saturday, September 19, 2026 · Data as of Friday, September 18, 2026 close · Export generated 2026-09-19 19:09 UTC
Explore the live IBM options data in the Detailed Options Analyzer →
Quick answer
| Item | Answer |
|---|---|
| Market bias | Neutral |
| Options-implied range (into September 25) | $219.56 – $239.54 (±4.35%, about ±$9.99) |
| Major support | $227.50 (put wall, September 25 expiration) |
| Major resistance | $260.00 (call wall, September 25 expiration) |
| Max pain (September 25) | $237.50 |
| Dealer gamma regime (estimate) | Negative — one rough estimate suggests hedging tends to amplify moves; flip level ≈ $170 (estimate) |
| Volatility condition | Rising — IV rank 34/100 · premium fair: options priced about 0.3 vol points below delivered movement |
| Technical check | Diverges (bearish, 3-day and 6-day chart models) |
| Best-fitting strategy | Long put spread — only if you want the chart model's side of an otherwise neutral options read |
| Analysis invalidated if | IBM closes below $227.50 |
1 · What matters today
IBM closed the September 18 session at $229.55 after a 5.6% slide over five trading days, and the options market is pricing about $9.99 of movement either way — a $219.56 to $239.54 range — through the September 25 expiration. That's the move the options market is pricing in, derived from what at-the-money straddles cost.
Our read of the chain lands neutral, and genuinely so: short-dated flow still leans call-heavy and puts are unusually cheap versus calls, while price momentum has turned hard the other way. The level that decides it is $227.50 — the strike with the biggest pile of open put contracts for this expiration, sitting barely two dollars under spot. Hold it and the $237.50 max-pain magnet stays live; lose it and the next real shelf is $220. Both chart models we checked lean bearish toward $226, which is inside the implied range, not beyond it.
2 · What the options market is pricing
What changed this week
The last five sessions undid the rally. IBM is down 5.65% over that stretch and down 1.77% over twenty days, and the flow followed price. The put/call open-interest ratio — how many put contracts are held open for every call — went from 0.73 to 0.91 over five days, a 24% build, against a 7-day average of 0.77. Day over day, call open interest fell by 12,745 contracts while put open interest rose by 3,419: traders closed upside and added protection in the same session.
Volume told the same story more loudly. Total option volume ran 1.59× its 20-day average, and the put/call volume ratio printed 0.449 against a 7-day average of 0.339 — still call-dominated in absolute terms (there are more than two calls traded for every put), but noticeably more put-tilted than this name's own recent pace. Implied volatility — the market's estimate of how much IBM will move, baked into option prices — rose 3.5% on the day and 8.3% over five sessions.
Among contracts that are still live, the biggest open-interest builds were the October 16 $210 puts (+321 contracts, now 2,881 held open), the September 25 $255 calls (+298 on 1,320 contracts traded) and the September 25 $240 calls (+292 on 1,980 traded) — downside insurance further out, lottery-ticket calls close in. Into the September 18 expiration itself, the $250 puts shed 1,616 contracts of open interest as they settled; that's history, not a live level.
The multi-horizon trend reads agree, which is worth one line: the past week is down 5.6%, the past ten weeks down 22.3%, with the middle horizon flat. Near-term flow and the bigger trend are pointing the same way, and our momentum composite flipped from bullish to bearish on September 18 after sitting positive for two weeks — a daily print of −25 against a 7-day average of +15. That is a fresh turn, not a settled regime.
Expected move
Into September 25, the chain prices roughly ±4.35% — about $9.99 up or down from $229.55, or $219.56 to $239.54. Here is how that scales out:
| Expiration | Implied move | Range around $229.55 |
|---|---|---|
| September 25 (7 DTE) | ±4.35% | $219.56 – $239.54 |
| October 2 (14 DTE) | ±6.26% | $215.18 – $243.92 |
| October 9 (21 DTE) | ±7.73% | $211.81 – $247.29 |
| October 16 (28 DTE) | ±9.03% | $208.82 – $250.28 |
The rungs step up almost exactly as the square root of time would predict — the at-the-money implied volatility barely moves across them (31.4% at September 25, 32.6% at October 16). In plain terms, the chain sees no single date inside the next month as unusually dangerous; it just wants more room for more calendar.
Volatility
Chain-wide at-the-money implied volatility sits at 36.34%, with an IV rank of 34/100 — today's reading is cheaper than about 66% of the past year's readings, and the IV percentile of 49.6 says roughly half the past year sat below today. IV is above its 30-day average of 33.4% but well under its 90-day average of 41.6%, so this is a bounce off compressed levels rather than a stress spike. The front-month read is unavailable today (September 18 was an expiration day), so the comparison of near-dated versus longer-dated option prices has to sit this one out.
Two readings versus IBM's own recent norm are worth flagging. Realized volatility over the last five sessions is running about 21% hotter than its own 20-day pace — the stock has genuinely started moving faster, not just gapping once. And price momentum is unusually weak for this name, one of the most stretched readings in the set. "Unusual" here means unusual for IBM, not versus the broader market.
Premium rich or cheap. The gap between how much movement options are priced for and how much IBM has actually delivered — the volatility risk premium — is currently about 0.3 vol points negative: at-the-money implied volatility is sitting a shade under the stock's 20-day realized volatility of 36.7%. Sellers are not being paid for the movement the stock has delivered. That said, the gap still sits richer than about 62% of this stock's own recent readings, because the last few weeks have mostly been worse for sellers than this. The path matters: on September 9 that gap was about +7.7 vol points, and it has compressed steadily since as realized movement caught up with priced movement. With the next earnings report not until October 28 — well outside this window — nothing scheduled is distorting the comparison. The verdict: an IV rank of 34 plus a premium that has gone flat-to-negative against delivered movement mildly favors owning premium over selling it this week, and argues against stuffing a portfolio full of short-vol structures.
Skew and sentiment
Here is the oddity of the week. Puts and calls the same distance from the stock price don't normally cost the same — in a large-cap selloff, traders usually pay up for crash protection. Not here: the 25-delta put is marked at 35.2% implied volatility against 37.4% for the 25-delta call, so calls are running 2.2 vol points richer than puts. Against a 60-day median of 0.9 vol points, that's about 1.3 points more call-tilted than IBM's own norm. Traders are paying a premium for upside, not for downside — complacency, or bottom-fishing, depending on your temperament.
The term-structure read agrees. Sentiment in short-dated options scores +12 in the 0–7 day bucket and +27 in the 7–30 day bucket, with the 30–60 day bucket at +48; the overall regime reads "broadly bullish," driven by call-side delta-weighted volume and call open interest building across every bucket. Unusual peer-relative flow also skewed to calls — four call contracts cleared the peer-relative unusual bar against one put, an unusually call-heavy split for this name.
So the chain is split down the middle: positioning and skew lean mildly constructive, price and momentum lean clearly negative. That is why the bias row reads Neutral rather than picking a fight.
The key levels map
| Level | Price | Why it matters |
|---|---|---|
| Call wall (September 25) | $260.00 | Heaviest call open interest for this expiration (1,214) and also the whole chain's heaviest call strike (22,323) — the two agree here, which is unusual |
| Swing resistance | $251.82 | Recent swing-pivot cluster (heuristic level) |
| Heavy gamma / call OI | $250.00 | One of the chain's five biggest gamma-weighted strikes; 15,505 calls held open across expirations |
| Swing resistance | $243.68 | Recent swing-pivot cluster (heuristic level) |
| Largest gamma strike | $240.00 | Biggest total gamma-weighted open interest in the chain — rallies tend to slow into strikes like this |
| Top of implied range | $239.54 | Upper rail of the ±4.35% move priced for September 25 |
| Max pain (September 25) | $237.50 | The price where the most option value would expire worthless — expirations sometimes gravitate toward it |
| 20-day moving average | $236.17 | Price is 2.8% below it; rolled over this week |
| Chart-model resistance | $233.60 | Short-term EMA zone both technical reports flag as overhead |
| 50-day moving average | $232.19 | Price is 1.14% below it after weeks above |
| Swing resistance | $230.97 | Former support band, now overhead (heuristic level) |
| Last close | $229.55 | Reference for every figure above and below |
| Swing support | $228.49 | Nearest heuristic support cluster |
| Put wall (September 25) | $227.50 | Heaviest put open interest for this expiration (718) — the week's defining level |
| Chart-model support | $225.00 | The 6-day model's stated support and bounce invalidation |
| Chain-wide put wall | $220.00 | Heaviest put strike across all expirations (17,483) — note this differs from the September 25 row above |
| Bottom of implied range | $219.56 | Lower rail of the ±4.35% move priced for September 25 |
| Swing support | $216.78 | Heuristic level from prior pivots |
| 52-week low zone | $199.19 | Range position sits at 22.8 out of 100 — closer to the low than the high ($332.46) |
| Gamma flip estimate | ≈$170 | Estimate only — spot sits unusually far above it for this name, so it is not this week's trigger |
Positioning and unusual flow
Market makers hedge the options they've sold, and one rough estimate of that inventory puts IBM in a negative-gamma regime both chain-wide and specifically at the September 25 expiration — a state in which hedging tends to amplify moves rather than cushion them. Treat that as an estimate, not observed inventory; the same estimate places the flip level near $170, far below spot, which is an unusually wide gap for this name and a reminder that these figures are modeled, not measured.
Three live flow items stood out. The September 25 $235 calls traded 2,247 contracts against just 178 held open — roughly $446,000 of premium changing hands in a strike with almost no prior positioning, the single largest dollar-premium print at this expiration. The September 25 $240 calls traded 1,980 contracts and added 292 to open interest ($178,000 of premium). On the other side, the September 25 $207.50 puts traded 919 contracts against 40 open — a 23× turnover on a strike nearly 10% below spot, which is what cheap disaster insurance looks like. The call activity is the louder of the two; the put activity is the more telling about who is nervous.
3 · Technical check
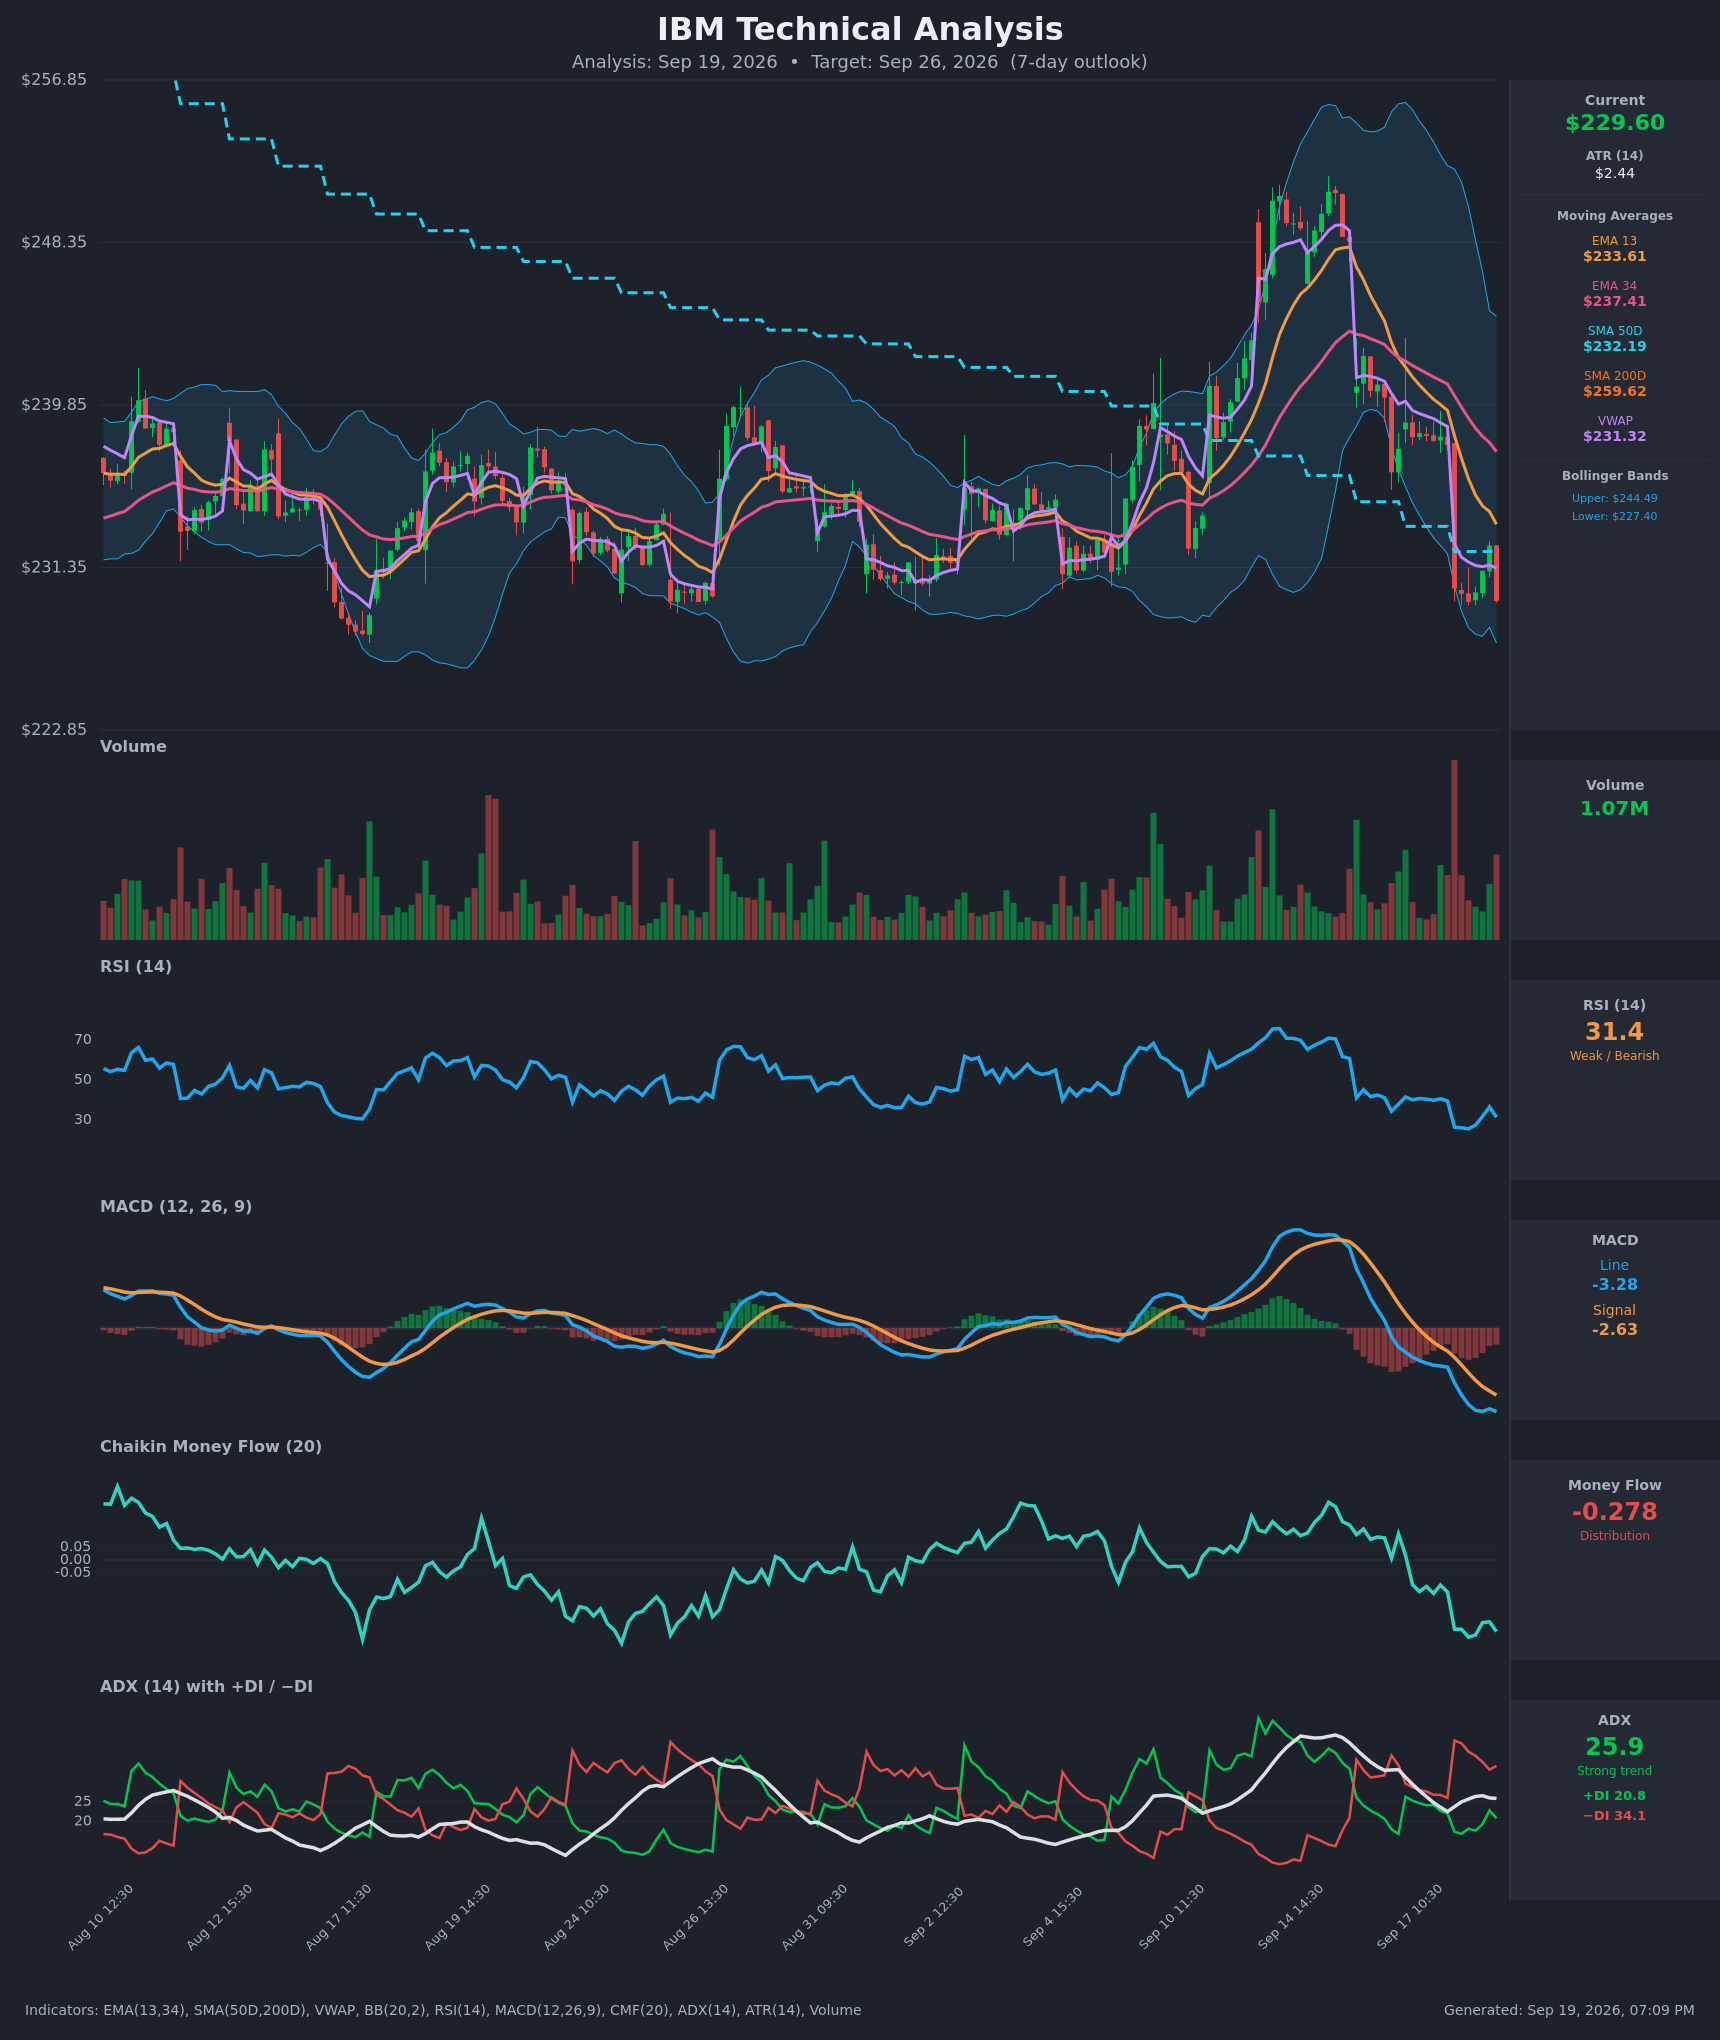
Both technical models we ran are bearish, and both land on the same number. The 3-day model (target date September 22) projects $226.00 with a forecast range of $222.50 to $233.50. The 6-day model (target date September 25) also projects $226.00, with a wider forecast band of $220.50 to $235.00. Both reference $229.60, within a couple of cents of the options snapshot's $229.55, so the two data sets are looking at the same close.
The supporting reads are decisive rather than marginal: ADX at 25.9 and rising with −DI (34.1) clearly above +DI (20.8) describes a strengthening, seller-controlled trend rather than a range, and Chaikin Money Flow at −0.278 is one of the most negative distribution readings on the chart. The 6-day model's dominant scenario invalidates on a sustained close above $234; the 3-day model's invalidates on a reclaim of $231.30.
Classification: diverges. The chart models call direction where the options read declines to, but the magnitude is contained — $226.00 sits comfortably inside the $219.56–$239.54 the options are pricing. In other words, the two sources disagree about which way, not about how far. Practically, that pushed the short strikes on the range structure below symmetrical and made the bear-side spread the one that leads this week's list, without changing the neutral headline.
Model vs. Market: The options market implies $219.56–$239.54 into September 25; the 6-day technical model targets $226.00. The gap is resolved by $227.50 — the put wall. A close through it validates the chart model's continuation case; a hold and a reclaim of $231–$234 leaves the chart model fighting a chain that is still positioned for upside.
Full technical write-ups: 3-day report → · 6-day report →
4 · Three ways the next six days can go
If IBM reclaims $237.50 and pushes toward the call wall ($260): the nearest overhead friction is not the wall itself but the $240 strike, which carries the largest gamma-weighted open interest in the chain. Positioning like that tends to slow rallies into it. Above $240, call open interest thins out until $250 and then $260, where 22,323 contracts sit chain-wide — a genuinely hard ceiling within a one-week horizon.
If IBM drifts between $227.50 and $239.54: this is the max-pain case. Expiring open interest is clustered such that the least option value would survive at $237.50, roughly 3.5% above spot — expirations sometimes gravitate that way, and the call-tilted skew is consistent with a chain positioned for exactly that drift. A quiet week that ends anywhere between $230 and $237.50 leaves almost every short-dated structure we list below profitable.
If IBM breaks below the put wall ($227.50): this is the acceleration branch, and the one both chart models favor. The negative dealer-gamma estimate for this expiration means hedging flows would tend to add to the move rather than cushion it — an estimate, but a directionally consistent one with a week in which realized movement is already running above its own monthly pace. Below $227.50 the map is thin until $220, the chain's heaviest put strike across all expirations, with $219.56 marking the bottom of the priced range.
5 · Three defined-risk structures
Prices are end-of-day midpoints as of 2026-09-18. All structures are hypothetical. Verify live prices before trading — these will be stale by the open.
Ordering note: with premium running slightly below delivered movement, structures that buy optionality lead this week, and the credit structure carries a health warning.
If you lean bearish: September 25 $230/$222.50 put debit spread
- Trade: Buy the September 25 $230 put, sell the September 25 $222.50 put
- Debit: $2.72 · Max profit: $478 · Max loss: $272 · Break-even: $227.28
- Why it fits: the break-even sits within a quarter of the $227.50 put wall, so this trade is literally a bet on that level failing — which is what both chart models forecast and what the negative dealer-gamma estimate would amplify. Buying rather than selling the spread respects a volatility premium that has gone flat against delivered movement. A short-term downtrend fighting nothing (the longer trend is down 22.3% over ten weeks) argues for the shorter expiration rather than stretching out.
- Makes sense only if: you accept that you are taking the chart model's side of an options read that is neutral, and you size accordingly.
- Invalidated if: IBM closes above $234 — the 6-day model's own invalidation level.
- Managing it: take profit at roughly 60–70% of max value rather than holding for the last dollar of intrinsic; exit by September 23 if IBM is still holding above $229.50, because the remaining time value drains fast in the last two sessions.
- Liquidity note: the $230 puts traded 30¢ wide (bid $3.80 / ask $4.10) on 389 contracts; the $222.50 puts were 32¢ wide on 370 contracts, which is about 26% of that leg's mid — work the spread as a package and expect slippage if you cross.
- Analyze this position →
If you expect the range to hold: September 25 $215/$220/$240/$245 iron condor
- Trade: Sell the $220 put and buy the $215 put; sell the $240 call and buy the $245 call, all September 25. You collect a credit up front and keep it if IBM finishes between the short strikes.
- Credit: $0.96 · Max profit: $96 · Max loss: $404 · Break-evens: $219.04 and $240.96
- Why it fits: both break-evens sit just outside the $219.56–$239.54 implied range, and the short call at $240 sits above max pain at $237.50 — so the pin case pays. The short put at $220 sits under the put wall and on the chain-wide heaviest put strike.
- Health warning: you're selling premium that hasn't been rich lately — the priced-versus-delivered gap is currently about 0.3 vol points negative, so this structure is being paid for range, not for overpriced volatility. The risk/reward (risk $404 to make $96) demands a high hit rate to work.
- Makes sense only if: you believe the sharp five-day drop has exhausted itself and the week chops.
- Invalidated if: IBM closes outside $219.04–$240.96 — and in practice, close the put side on any close below $227.50.
- Managing it: close at roughly 50% of max credit; exit the whole position by September 23 rather than holding a four-legged structure into expiration-day gamma.
- Liquidity note: the $240 calls traded 20¢ wide on 1,980 contracts and the $220 puts 27¢ wide on 894 — the wings ($215 puts, $245 calls) are thinner in percentage terms, so enter as a single four-leg order.
- Analyze this position →
If you lean bullish: September 25 $230/$237.50 call debit spread
- Trade: Buy the September 25 $230 call, sell the September 25 $237.50 call
- Debit: $2.57 · Max profit: $493 · Max loss: $257 · Break-even: $232.57
- Why it fits: the short strike sits exactly on max pain at $237.50, which is where expiring open interest would do the least damage to option sellers, and the whole structure lives inside the implied range. It also aligns with the one genuinely unusual reading in the chain — calls priced 2.2 vol points over puts, about 1.3 points more call-tilted than IBM's own 60-day norm.
- Makes sense only if: $227.50 holds early in the week and IBM reclaims the 50-day average at $232.19 — both chart models treat $231–$234 as the line that breaks their case.
- Invalidated if: IBM closes below $227.50.
- Managing it: this is the structure fighting the short-term trend, so take profit early — 50% of max value is plenty — and cut it if the position is not working by September 23.
- Liquidity note: the $230 calls traded 55¢ wide (bid $3.75 / ask $4.30) on 823 contracts; the $237.50 calls were 35¢ wide on 405 contracts. Both are tradeable, neither is tight — the spread is about 13% and 24% of mid respectively, so limit orders only.
- Analyze this position →
If none of these: no trade
There is a respectable case for standing aside. The options read is genuinely neutral — positioning and skew pull one way, price and momentum the other — and the volatility premium offers no edge in either direction: at an IV rank of 34 and a priced-versus-delivered gap of roughly negative 0.3 vol points, you are neither being paid well to sell nor buying anything cheap. Add bid-ask spreads that run 8–25% of mid on most September 25 strikes, and a one-week trade has to be right by a decent margin just to clear friction. If you have no view on whether $227.50 holds, waiting for the September 22–23 sessions to answer that question costs you very little and removes most of the guesswork.
6 · Quick FAQ
What is IBM's expected move this week? About ±$9.99 (±4.35%) into the September 25 expiration, or a $219.56–$239.54 range, per the options market's straddle pricing as of the September 18 close.
Is IBM expected to go up or down over the next six days? Options positioning as of September 18 reads neutral — call-tilted skew and broadly bullish short-dated flow against clearly negative price momentum — but that's a read of what traders have done, not a forecast. The actionable map is the $219.56–$239.54 range with $227.50 as support and $260.00 as the call-side ceiling.
Are IBM options expensive right now? IV rank 34/100 says option prices are cheaper than 66% of the past year's readings. On top of that, they're running about 0.3 vol points below the movement IBM has actually delivered over the last 20 days — though that gap still sits richer than about 62% of this stock's own recent readings. Net: fair, with a mild edge to buying rather than selling premium.
Where is IBM's biggest options support and resistance? For the September 25 expiration, the put wall is $227.50 and the call wall is $260.00. Note that across the whole chain the heaviest put strike is $220 — a different level from this expiration's own wall.
What invalidates this week's read? A close below $227.50. Below that level the pin case dies, the negative dealer-gamma estimate turns unhelpful, and the chart models' $226 target — and the $220 shelf under it — become the working map.
Methodology & disclosures. Data: end-of-day options-chain snapshot for IBM, 2026-09-18, generated 2026-09-19T19:09:12.965Z. Prices shown are midpoints and will differ from live markets. Momentum/positioning scores and volatility-premium comparisons are descriptive measurements of past option flow and past price movement — not investment advice, signals, forecasts, or guarantees. Earnings dates and reported results are from the data provider's earnings feed as of 2026-09-19T19:09:12.965Z; report dates can change. All trade structures are hypothetical. Every structure shown has a defined maximum loss; you can lose the entire max-loss amount. Options involve substantial risk and are not suitable for all investors.