INTC Options Are Pricing an $8.37 Move Into Friday — the Chart Model Sees Less Than Half That
Intel's options market implies a $94.57–$111.31 range into the September 18 expiration, while the 5-day technical model sees a far tighter $99.80–$106.20 band. Here's what the positioning actually shows, the levels that matter, and three defined-risk ways to trade the gap.

The options market implies a $94.57–$111.31 range into the September 18 expiration; here's what's driving it, the levels that actually matter inside that range, and three defined-risk ways to trade it.
Published Sunday, September 13, 2026 · Data as of the September 11, 2026 close
Explore the live INTC options data in the Detailed Options Analyzer →
Quick answer
| Item | Answer |
|---|---|
| Market bias | Neutral with a bullish tilt |
| Spot (September 11 close) | $102.94 |
| Options-implied range (into September 18) | $94.57 – $111.31 (±8.13%, or about ±$8.37) |
| Major support | $80.00 (put wall, September 18 expiration) |
| Major resistance | $110.00 (call wall, September 18 expiration) |
| Max pain (September 18) | $97.50 |
| Dealer gamma regime (estimate) | Positive — hedging tends to dampen moves; flip level ≈ $70 |
| Volatility condition | Falling — IV rank 29.65/100, ATM IV 58.82% · premium roughly fair: options priced about 0.9 vol points above delivered movement |
| Technical check | Mixed (bearish at 3 days, neutral at 5 days) |
| Best-fitting strategy | Short put spread below the range floor |
| Analysis invalidated if | INTC closes below $95 |
1 · What matters today
Intel closed at $102.94 after a violent two weeks — up 12.3% over five sessions, but still down about 2% over the past month. The options market is pricing a move of roughly ±$8.37 into the September 18 expiration, which is a $94.57–$111.31 range. That is the whole story in one number: this is a wide, unsettled market that has just stopped trending and started chopping.
Our read of the flow lands neutral with a slight upward tilt. Short-dated sentiment is still call-leaning and put open interest has been thinning fast, but the stock is now pinned under a very heavy $110 call strike with max pain — the price where the most option value would expire worthless — sitting below at $97.50. The level that changes the picture is $95: a close below it kills the tilt. One technical model reads bearish over three days, another neutral over five.
2 · What the options market is pricing
What changed this week
The five-day price move is the headline: +12.29%, with a +5.22% gap up on September 8 and a +2.14% gap on September 11, punctuated by two down gaps in between. Implied volatility — the market's estimate of how much INTC will move, baked into option prices — has been going the other way. At-the-money implied volatility sits at 58.82%, down 5.4% in a day, and down 30.9% over 30 sessions; it is now 11.3% below its own 30-day average and far under the 81.4% 90-day average.
Positioning has quietly de-risked. Put open interest relative to calls fell to 0.60 — for every call contract held open there are now 0.60 puts, against a 14-day average of 0.72. Put/call volume printed 0.51 versus a 7-day average of 0.48, so roughly one put traded for every two calls. Day-over-day, call open interest added 15,054 contracts while puts shed 30,800. Total option volume ran 1.14× its 20-day average — active, not frantic. Into Friday's now-settled expiration, the $95 puts added 8,571 contracts of open interest before expiring worthless; that is history, not a live level.
The one tension worth naming: the short- and long-term trend reads disagree outright. Over roughly five sessions the read is bullish on a 12.3% pop; over about 20 sessions it is flat; over about 50 sessions it is bearish, with price down 19%. The near-term bounce is running against a bigger downtrend that has not been repaired, which is exactly why the structures below are short-dated rather than positional.
Expected move
Into the September 18 expiration, the options market is pricing a move of about ±$8.37, or ±8.13% — the move derived from what straddles cost at that expiration. Around the $102.94 close, that frames a $94.57–$111.31 range.
| Expiration | Implied move | Range around $102.94 |
|---|---|---|
| Monday, September 14 | ±3.73% | $99.10 – $106.78 |
| Wednesday, September 16 | ±6.31% | $96.44 – $109.44 |
| Friday, September 18 | ±8.13% | $94.57 – $111.31 |
| Friday, September 25 | ±11.34% | $91.27 – $114.61 |
The rungs do not step up smoothly. The September 14 contracts carry an at-the-money implied volatility of just 41.09%, September 16 jumps to 53.91%, and September 18 — the standard monthly expiration, where nearly all the open interest lives — prices at 58.73%, higher than the September 21 and September 25 rungs behind it. That hump is where the chain's positioning is concentrated, not a scheduled event; there is no earnings report inside this window.
Volatility
IV rank is 29.65/100 — today's implied volatility is cheaper than roughly 70% of the past year's readings — and the percentile read agrees at 29. That is slightly below the 3-day average of 34.7 and roughly in line with the 14-day average of 30.1. The front-month read is unavailable today because the snapshot landed on an expiry day, so the usual comparison of near-dated against 60-day pricing is off the table; the 60-day at-the-money read is 66.9%, comfortably above the 58.82% at-the-money print, which is the normal upward-sloping shape.
Two "vs its own norm" observations are worth flagging — measurements against INTC's own recent history, not the broader market. Twenty-day realized volatility of 57.9% is actually unusually depressed for this stock; INTC has been a wilder name than that over the past year. At the same time, the five-day pace of movement is running about 1.44× the twenty-day pace, an unusually large acceleration for this name. Movement is picking up off a low base.
Premium rich or cheap. The volatility risk premium — the gap between how much movement options are priced for and how much INTC has actually delivered — sits at about 0.9 vol points (58.82% implied against 57.89% realized over 20 days). When it's positive, option sellers have been collecting more than realized movement cost them. That reading is richer than roughly two-thirds of this stock's own recent readings, which sounds encouraging until you look at the path: a week ago the gap was more than 10 vol points, and it has collapsed to under one as implied volatility fell and realized movement caught up. Nothing mechanical explains it — no report entered or left the realized-volatility window. So the honest verdict is fair, not rich: an IV rank of 30 and a premium cushion under a single vol point argue against naked premium selling and in favor of defined-risk structures where the maximum loss is known before you enter.
Skew and sentiment
Skew is the observation that puts and calls the same distance from the stock price don't cost the same. Here the usual relationship is inverted: 25-delta calls price at 61.29% against 58.43% for the equivalent puts, so calls are about 2.9 vol points richer than puts. Traders are paying up for upside, not crash protection. Against this stock's own 60-day median of 3.4 points call-rich, though, today's reading is slightly less call-heavy than normal — the demand for upside cooled a touch on Friday, and the same softening shows in a five-session drift toward steeper put pricing.
Sentiment across the curve is broadly call-leaning. The 0–7 day bucket reads mildly positive at 10, well off its 7-day average of 41, while the 8–30 day bucket reads 39 against an average of 40. The plain translation: the front week's enthusiasm has cooled sharply while positioning slightly further out has held. Call-side sweeps still outnumbered put-side sweeps 12 to 10 on the day, a pace modestly above this name's own norm.
The key levels map
| Level | Price | Why it matters |
|---|---|---|
| 52-week high | $142.35 | Price sits 27.7% below it; range position 67/100 |
| Call OI cluster | $115.00 | 59,150 calls chain-wide; the next shelf if $110 breaks |
| Top of implied range | $111.31 | Upper rail of the ±8.13% move into September 18 |
| Call wall (September 18) | $110.00 | 61,641 calls at this expiration and 229,146 chain-wide — the same strike is the whole chain's heaviest call strike and its largest gamma strike; the two agree |
| Swing resistance | $107.21 | Heuristic level from recent pivot clustering |
| Chart-model resistance | $104.50 – $106.20 | Recent swing high and the top of the 5-day model band |
| 100-day moving average | $105.33 | The only major average still above price (−2.27%) |
| Nearest swing resistance | $103.03 | Price closed just under it |
| Spot | $102.94 | September 11 close |
| Gamma / OI cluster | $100.00 | Second-heaviest gamma strike chain-wide (97,825 calls, 60,468 puts) |
| 50-day moving average | $98.35 | Price sits 4.66% above it; first structural test on a pullback |
| Nearest swing support | $98.33 | Effectively the same shelf as the 50-day |
| Max pain (September 18) | $97.50 | Where the most option value expires worthless; expirations sometimes gravitate toward it |
| Heaviest put strike inside the range | $95.00 | 25,703 puts at September 18 plus swing support at $95.35 — the support that actually matters this week |
| 20-day moving average | $94.61 | Price is 8.81% above it |
| Bottom of implied range | $94.57 | Lower rail of the ±8.13% move |
| Put wall (September 18) | $80.00 | 27,876 puts here and 85,641 chain-wide — the biggest put pile, but 22% below spot and outside the implied range: a disaster hedge, not a live floor |
| Gamma flip estimate | ≈ $70 | One rough estimate of where market-maker hedging would start amplifying selling; far below spot |
Positioning and unusual flow
One rough estimate of dealer positioning puts the September 18 expiration in a positive-gamma regime, the same as the chain overall — in that state market makers' hedging tends to dampen moves rather than amplify them, and price sits far above the estimated flip level near $70. Treat that as an estimate built on an assumed convention, not observed inventory; the practical read is that there is no mechanical accelerant sitting under this week's price.
Three non-expired flow items stand out. The September 18 $95 calls traded 18,034 contracts for about $15.7 million of premium — the single largest dollar figure anywhere in the chain, and deep in the money, which reads as position work rather than a directional lottery ticket. The September 18 $110 calls traded 25,480 contracts against 61,641 open, adding 2,944 contracts of open interest and $2.76 million of premium: money continuing to build the wall rather than break it. And the September 18 $113 calls, a strike that carried no open interest the prior day, traded 7,186 contracts — 46 times the open interest that resulted. Someone paid up for a move above the wall inside seven days. Further out, the November $80 puts added 4,299 contracts, the largest genuine open-interest build in the file: longer-dated downside insurance being topped up while near-dated puts get sold off.
3 · Technical check
The near-term chart model (3-day horizon, target date September 16) reads bearish, with a target of $101.60 and a projected band of $99.90 to $104.70. It cites a MACD cross below its signal line, RSI cooling from 78 to 55, and price slipping marginally below VWAP — momentum exhaustion after the vertical run, with trend strength collapsing from an ADX of 45 down to 22. Against the options-implied $96.44–$109.44 range for the September 16 expiration, the target sits comfortably inside — but the direction cuts against our upward tilt, so this one diverges.
The 5-day model (target date September 18) reads neutral, with a target of $103.80 and a projected band of $99.80 to $106.20. It sees the same fading momentum but notes the moving-average structure is still stacked bullishly and calls the current chop a consolidation rather than a reversal. That target sits inside the options-implied range and the direction is compatible with our read, so it broadly confirms the range thesis while declining to take the upward tilt.
Model vs. Market: The options market implies $94.57–$111.31 into September 18; the 5-day technical model targets $103.80 inside a $99.80–$106.20 band. The chart model's band is roughly a third the width of the one options are charging for — someone is wrong about how much this stock is going to move over the next five sessions, and premium buyers are the ones paying to find out.
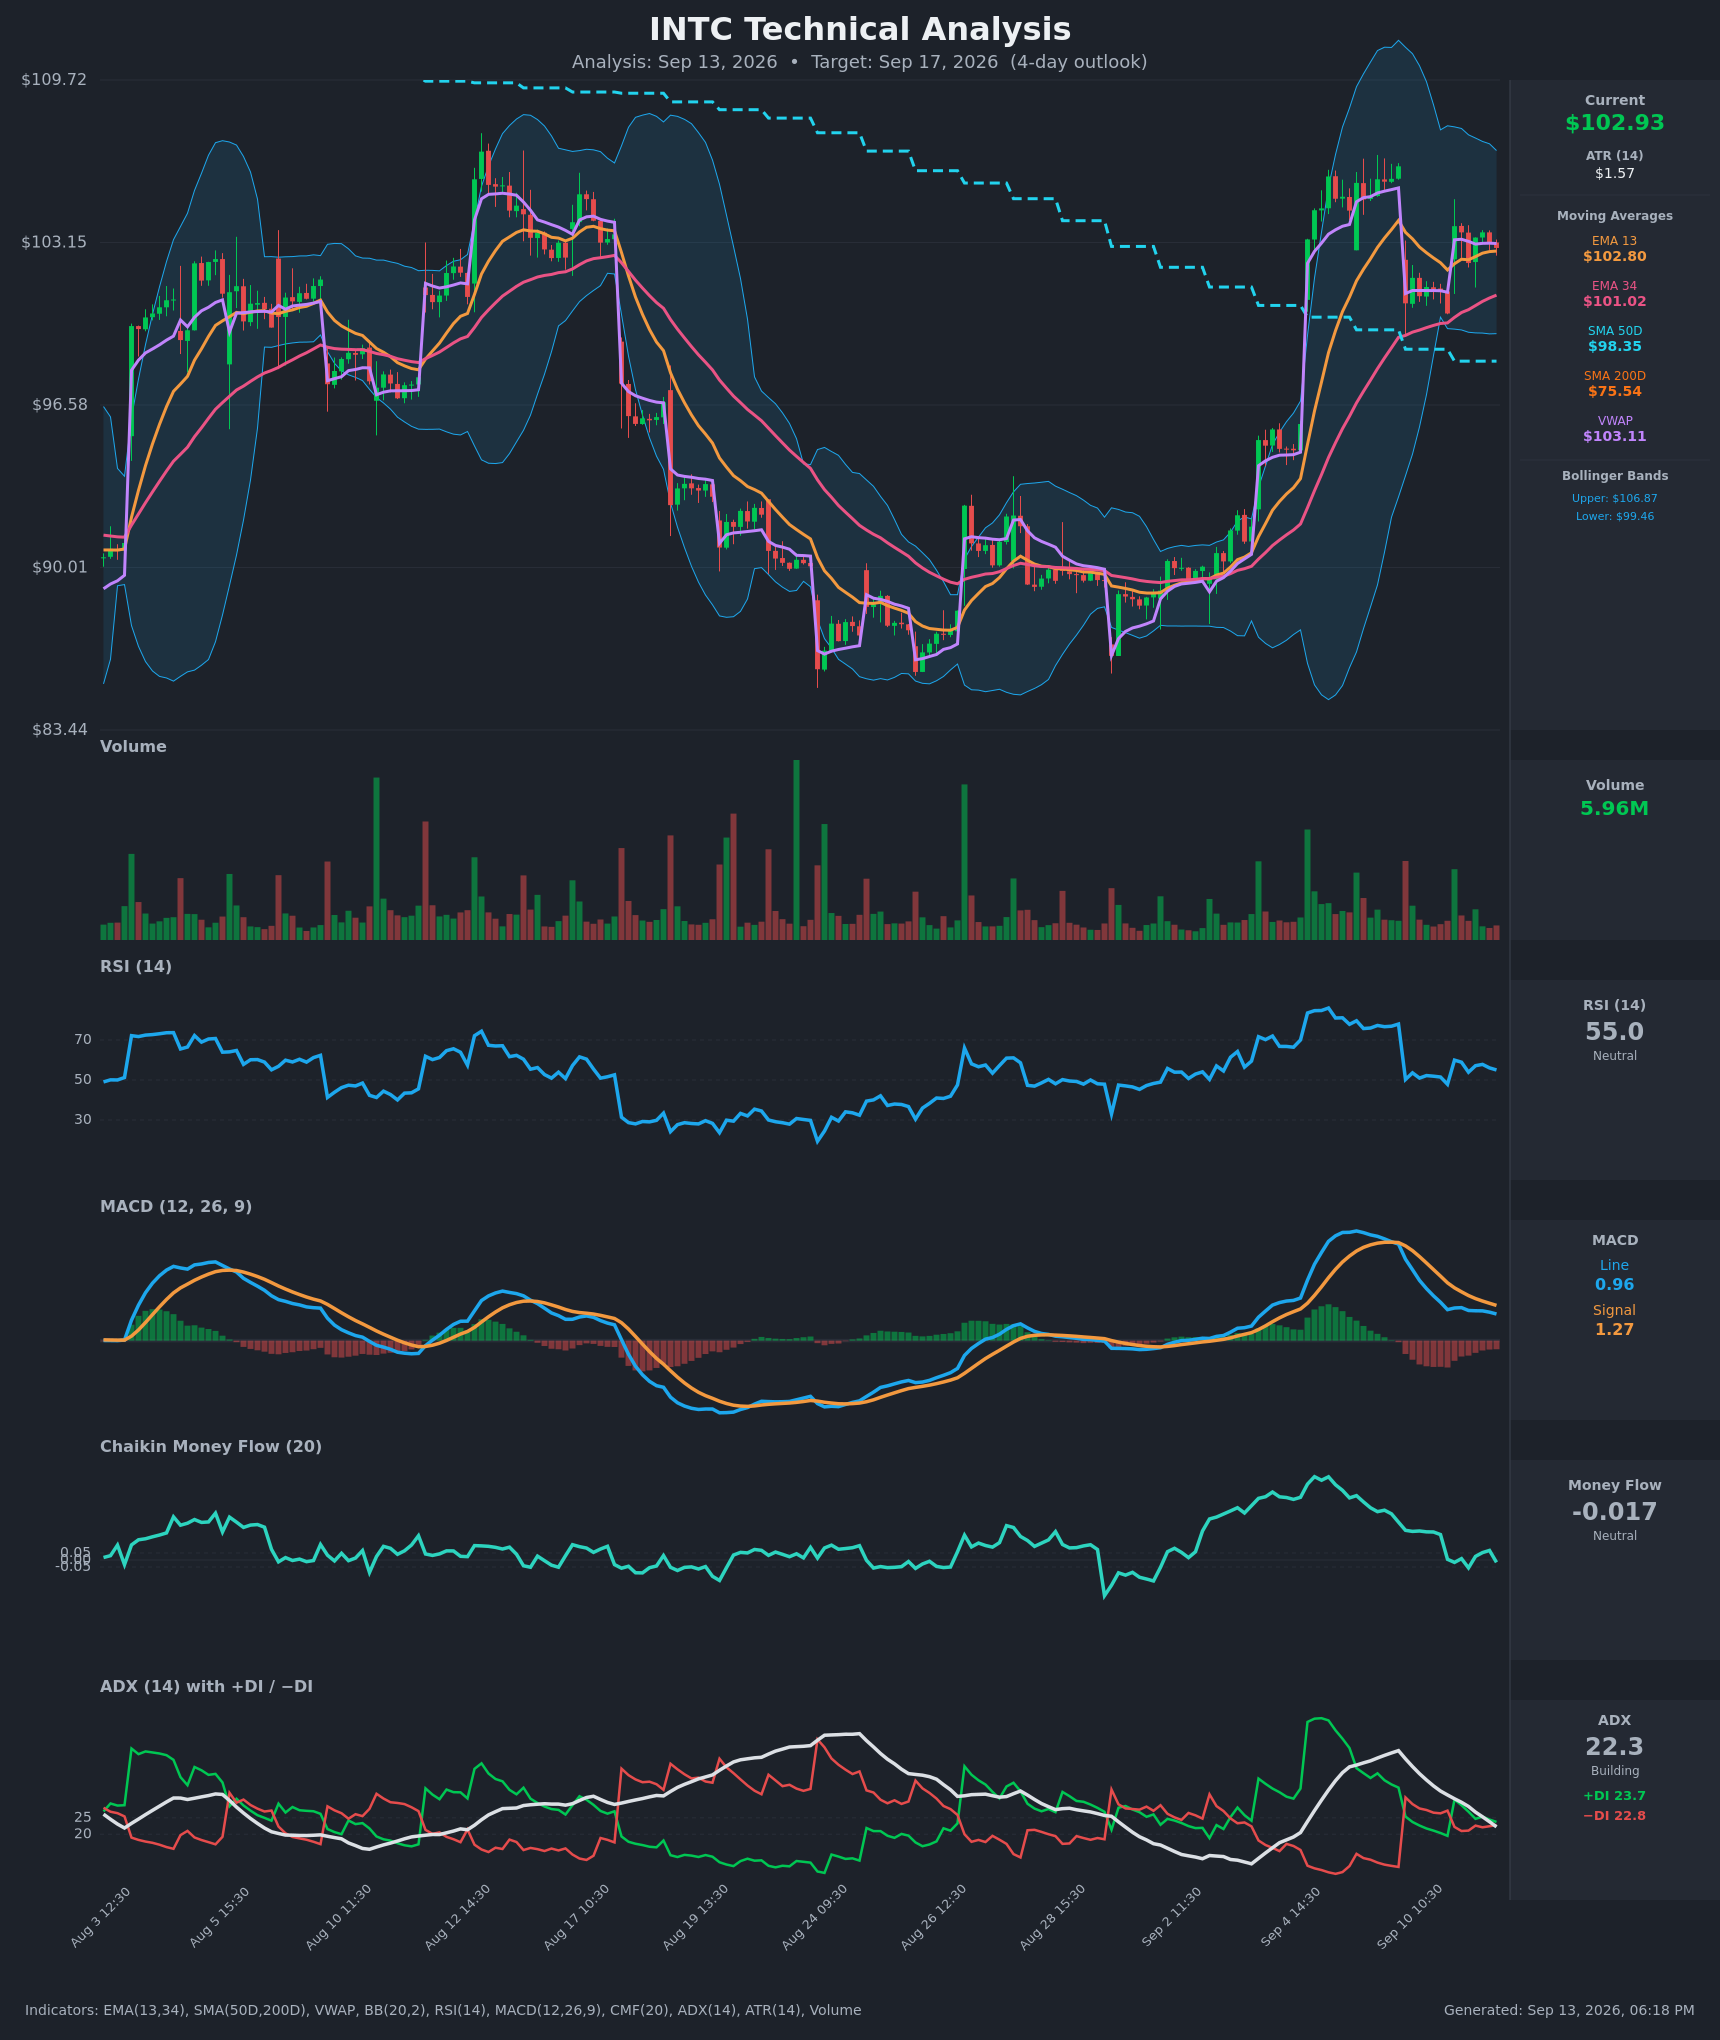
The practical effect on strike selection: because the near-term model leans lower while the 5-day model is flat, the bullish structure below uses a short strike beneath the $98.33 swing shelf rather than at the money, and the range structure's short call sits right on the $110 wall instead of being shaded higher.
Full technical write-ups: 3-day report → · 5-day report →
4 · Three ways the next five days can go
If INTC pushes above the call wall ($110): that strike holds 61,641 calls for September 18 and 229,146 across the chain — the heaviest concentration anywhere. Rallies into that much overhead open interest tend to slow as the hedging against it builds, and the top of the implied range at $111.31 sits just above. A clean break through leaves noticeably thinner positioning until the $115 shelf, where 59,150 calls sit chain-wide.
If INTC drifts between the walls: this is the base case and where max pain at $97.50 earns its mention — expirations sometimes gravitate toward the strike that leaves the most option value worthless, and the estimated positive-gamma regime means hedging flows tend to dampen rather than push. That combination argues for chop between roughly $98 and $107 with a pull lower into Friday, which is exactly the geometry the 5-day chart model describes.
If INTC breaks below $95: the nominal put wall sits at $80, but that is 22% below spot and outside the implied range — a disaster hedge, not a floor anyone will defend this week. The level with real September 18 put open interest inside the range is $95, at 25,703 contracts, sitting just under the 50-day average at $98.35 and just above the 20-day at $94.61. A close through $95 breaks that cluster and the bullish tilt with it. The estimated gamma flip near $70 is far enough away that the usual "hedging amplifies the selling" mechanic is not the risk here — the risk is simply that the 50-day-plus downtrend reasserts itself.
5 · Three defined-risk structures
Prices are end-of-day midpoints as of September 11, 2026. All structures are hypothetical. Verify live prices before trading — these will be stale by the open.
If you lean bullish: short put spread
- Trade: Sell the September 18 $100 / $95 put credit spread (sell the $100 put, buy the $95 put)
- Credit: $1.26 · Max profit: $126 · Max loss: $374 · Break-even: $98.74
- Why it fits: You collect premium up front and win if INTC simply stays above $98.74 — the short strike sits at the heaviest round-number open-interest cluster in the chain, and the long strike sits on the $95 put shelf that defines this week's real support. With calls priced about 2.9 vol points over equivalent puts, the put side is the cheaper side to be short.
- Makes sense only if: you believe the five-day bounce holds its footing and the 50-day average near $98.35 caps the pullback.
- Invalidated if: INTC closes below $98.33.
- Managing it: close at roughly 50% of max credit; because the near-term uptrend is fighting a 50-day downtrend, take profit early rather than holding for the last few cents, and exit regardless by Thursday's close. If INTC closes through $100, close the position rather than hoping into expiration Friday.
- Liquidity note: the September 18 $100 puts quoted 10¢ wide on 3,988 contracts of volume and the $95 puts 3¢ wide on 3,215 — both fill easily.
- Analyze this position →
If you expect the range to hold: iron condor
- Trade: Sell the September 18 $95 / $92.50 put spread and the September 18 $110 / $113 call spread
- Credit: $0.74 · Max profit: $74 · Max loss: $226 on the call side ($176 on the put side) · Break-evens: $94.26 and $110.74
- Why it fits: the short strikes sit essentially on the expected-move rails ($94.57 and $111.31) and on the two structural levels that matter — the $95 put cluster and the $110 call wall. The estimated positive-gamma regime is the condition under which pins like this behave, and max pain at $97.50 sits inside the profit zone.
- Makes sense only if: you accept the risk/reward. This collects $74 against $226 of exposure, which only works if the range really does hold — with a premium cushion under one vol point, you are not being paid a fat volatility edge here, only a structural one.
- Invalidated if: INTC closes above $110 or below $95.
- Managing it: take it off at roughly 50% of max credit, or close the tested side alone if one wing goes in the money; do not carry both wings into Friday's settlement.
- Liquidity note: all four legs quoted 3¢ wide on Thursday, with the $110 calls the most active contract at the expiration (25,480 contracts, $2.76 million of premium). Slippage is not the issue with this one.
- Analyze this position →
If you lean bearish: long put spread
- Trade: Buy the September 18 $103 / $98 put debit spread (buy the $103 put, sell the $98 put)
- Debit: $1.99 · Max profit: $302 · Max loss: $199 · Break-even: $101.02
- Why it fits: you pay a fixed amount and profit as INTC falls, with the full payout reached at $98 — just above max pain at $97.50 and right at the 50-day average. This is the structure that expresses the 3-day chart model's bearish read, and with an IV rank of 30, buying rather than selling this premium is not expensive by this stock's own standards.
- Makes sense only if: you think the fading momentum reads — MACD rolled over, trend strength collapsed from 45 to 22 — resolve lower before Friday.
- Invalidated if: INTC closes above $104.50.
- Managing it: this is a five-session trade with real time decay against it; take profit at roughly 60–70% of maximum rather than waiting for the pin, and cut it if the setup hasn't started working by Wednesday's checkpoint.
- Liquidity note: the September 18 $103 puts quoted 10¢ wide on 1,829 contracts and the $98 puts 5¢ wide on 792 — both around 3% of mid, tight enough to work.
- Analyze this position →
If none of these: no trade
There is a real case for standing aside this week. The premium picture is the reason: an IV rank of 30 means options are cheaper than 70% of the past year's readings, and the cushion between what options price and what INTC actually delivers has collapsed from more than 10 vol points to under one in five sessions. Credit sellers are collecting thin premium into an implied ±8.13% move with a stock that just gapped three times in four sessions; debit buyers are paying for a move the 5-day chart model does not think is coming. Add a genuine disagreement between the short-term bounce and the still-broken 50-day trend, and "wait for the $95 or $110 rail to be tested and trade the reaction" is a defensible plan that costs nothing.
6 · Quick FAQ
What is INTC's expected move this week? About ±$8.37, or ±8.13%, into the September 18 expiration — a $94.57 to $111.31 range, per the options market's straddle pricing as of the September 11 close.
Is INTC expected to go up or down over the next five days? Options positioning as of September 11 leans neutral with a slight bullish tilt — put open interest is thinning, short-dated sentiment is still call-leaning, and calls price richer than puts — but that is a read of what traders have done, not a forecast. The actionable map is the $94.57–$111.31 range plus the $95 and $110 levels.
Are INTC options expensive right now? Two lenses, same answer. An IV rank of 29.65/100 says option prices are lower than about 70% of the past year's readings; on top of that, they are running only about 0.9 vol points above the movement INTC has actually delivered — technically richer than roughly two-thirds of this stock's own recent readings, but a cushion that thin is closer to fair than to rich. Defined-risk structures beat naked premium selling here.
Where is INTC's biggest options support and resistance? For September 18, the put wall is $80.00 and the call wall is $110.00 — but the $80 pile is 22% below spot and outside the implied range, so the support that actually matters this week is the $95 strike, where 25,703 puts sit.
What invalidates this week's read? A close below $95.
Methodology & disclosures. Data: end-of-day options-chain snapshot for INTC, 2026-09-11, generated 2026-09-13T18:18:07.646Z. Prices shown are midpoints and will differ from live markets. Momentum/positioning scores and volatility-premium comparisons are descriptive measurements of past option flow and past price movement — not investment advice, signals, forecasts, or guarantees. All trade structures are hypothetical. Every structure shown has a defined maximum loss; you can lose the entire max-loss amount. Options involve substantial risk and are not suitable for all investors.