IREN Options Are Pricing a $4.53 Move Into Friday — Our Chart Model Sees a Drift Lower
The options market is pricing IREN between $39.30 and $48.36 into the September 18 expiration, and flow positioning still leans slightly bullish — but both technical reads point the other way. Here is the level map, the tension, and three defined-risk ways to trade a 4-day window.

The options market implies a $39.30–$48.36 range into the September 18 expiration; here is what is driving it, where the real levels sit, and three defined-risk ways to trade the next four days.
Published Sunday, September 13, 2026 · Data as of Friday, September 11, 2026 close
Explore the live IREN options data in the Detailed Options Analyzer →
Quick answer
| Item | Answer |
|---|---|
| Market bias | Slightly bullish (a neutral-bullish lean) |
| Options-implied range (into September 18) | $39.30 – $48.36 (±10.33%, or about ±$4.53) |
| Spot / last close | $43.83 |
| Major support | $24.00 — the September 18 expiration's own put wall; the nearest meaningful downside cluster is $40.00 |
| Major resistance | $65.00 — the September 18 expiration's own call wall; the nearest real overhead is $50.00 |
| Max pain (September 18) | $43.00 |
| Dealer gamma regime (estimate) | Positive — one rough estimate suggests market-maker hedging tends to dampen moves; flip level ≈ $22.00 |
| Volatility condition | Falling — IV rank 3/100 · premium thin: options are priced about 5.7 vol points below what IREN has actually delivered |
| Technical check | Diverges (bearish, 2-day and 4-day horizons) |
| Best-fitting strategy | September 18 $44/$47 call debit spread |
| Analysis invalidated if | IREN closes below $42.24 |
1 · What matters today
IREN closed Friday, September 11 at $43.83 after a 5.2% run over five sessions. Our read of options flow still leans slightly bullish — call-tilted volume, a skew that has flattened out (traders are not paying up for crash protection), and a positioning composite that sits modestly on the bullish side of neutral. The options market is pricing a move of about ±$4.53, or ±10.33%, through Friday, September 18: a $39.30–$48.36 range derived from what at-the-money straddles cost. The catch is that option premium is cheap in absolute terms — implied volatility sits at just 3 out of 100 versus the past year — so this is a week to own optionality rather than sell it. Both technical reads disagree with the lean and point lower. A close below $42.24 kills the bullish case.
2 · What the options market is pricing
What changed this week
The stock did the moving; the options market did the shrinking. IREN gained 5.23% over the trailing five sessions but is still down 2.82% over twenty — the past week's pop sits inside a two-month chop rather than a clean trend. At-the-money implied volatility — the market's estimate of how much IREN will move, baked into option prices — finished at 79.3%, barely changed over five days (+1.1%) but down 33.7% over thirty, and running 18.8% under its own 30-day average of 97.6%. The 52-week IV rank printed 3.1 against a 7-day average of 6.8 and a 14-day average of 9.2: option prices have been grinding toward the floor of their yearly range all month.
Flow stayed call-tilted but stopped accelerating. Put/call volume came in at 0.51 — for every 100 call contracts traded, about 51 puts — essentially on top of its 7-day average of 0.49 and its 14-day average of 0.52. Open interest told a slightly different story: put/call open interest ticked up to 0.86 from a 7-day average of 0.82, with put open interest adding 9,876 contracts against 4,162 on the call side in a single session. The single largest change in contracts held open was a liquidation, not a build — the October 2 $55 calls shed 4,228 contracts of open interest. Among live near-dated strikes, the September 18 $49 calls added 1,825 contracts on 1,177 of volume, the $45 calls added 1,209 on 6,309 of volume, and the $40 puts added 921 on 6,359 of volume. Into Friday's expiration, flow was frantic and mostly worthless: the settled $45 calls traded 18,902 contracts against 4,491 of open interest and expired at a penny.
Our short- and long-term trend reads agree in direction but not in conviction: the past week's +5.2% registers as bullish, while the ~20-day (−2.8%) and ~50-day (+1.1%) windows read as flat. That argues for short-dated directional structures and quick profit-taking, not for pressing a trend that only exists on a one-week lookback.
Expected move
Into the September 18 expiration, the options market is pricing a 1-sigma move of ±10.33% — about ±$4.53 around the $43.83 close, or a $39.30–$48.36 range. That is the move implied by straddle pricing, not a forecast.
| Expiration | Implied move | Range around $43.83 |
|---|---|---|
| September 18 (7 days) | ±10.33% | $39.30 – $48.36 |
| September 25 (14 days) | ±14.84% | $37.33 – $50.33 |
| October 9 (28 days) | ±21.90% | $34.23 – $53.43 |
The ladder scales almost exactly the way pure time decay says it should — roughly with the square root of days — with only a gentle lift in at-the-money implied volatility from 74.6% at the front rung to 79.1% a month out. There is no kink, no hump, no event being priced into any of these dates.
Volatility
At-the-money implied volatility of 79.3% sounds enormous until you measure it against IREN's own history: IV rank 3/100 means today's reading is cheaper than roughly 97% of the past year's readings, and the percentile measure (2/100) says almost no day in the last twelve months closed below it. Current IV sits well under both the 30-day average (97.6%) and the 90-day average (108.0%), and it slipped another 3.0% on Friday alone. The front-month term-structure read — comparing option prices across expiration dates — is unavailable today, an ordinary artifact of a snapshot taken on an expiry day.
One "vs its own norm" observation worth flagging: 20-day realized volatility of 85% is unusually low for this name, sitting well below its recent norm, while the 5-day/20-day realized ratio is about typical — movement has cooled without going dead. Separately, spot is sitting unusually far above the estimated gamma flip level for this stock, which is the calm, supportive side of that estimate.
Premium rich or cheap? The volatility risk premium — the gap between how much movement options are priced for and how much IREN has actually delivered — is currently negative by about 5.7 vol points. Option sellers have been collecting less than realized movement cost them. That gap sits at the 51st percentile of this stock's own recent readings, so by its own recent standards this is a middling gap, not an extreme; over the past week it has oscillated in a narrow band between roughly −2 and −8 vol points with no sign flip. Combine a 3/100 IV rank with a premium that has been running below delivered movement, and the verdict is straightforward: this is a week that favors owning premium, not collecting it. Defined-risk debit structures lead below; any credit structure here is selling something that has not been rich lately.
Skew and sentiment
Puts and calls the same distance from the stock price do not usually cost the same — when puts are pricier, traders are paying up for crash protection. In IREN right now they are not. The 25-delta skew reads −1.6 vol points (25-delta puts at 79.4% implied volatility versus 25-delta calls at 81.0%), against a 60-day median of +0.4 vol points. Calls are the richer side, and the skew is running about 2 vol points flatter than this stock's own norm — complacency rather than fear. That said, the skew has steepened by about 4 vol points over the last five sessions, so put demand is rebuilding from a very flat base even if the level itself still looks benign.
Sentiment in short-dated options is mildly constructive but front-loaded with nothing: the 0–7d bucket scores a flat 0, the 7–30d bucket +21, the 30–60d bucket +29, and the 60–120d bucket +15 — an overall regime our read labels broadly bullish, with no single bucket dominating. The call-tilted volume reading is modestly above its own norm for this name; the put/call volume ratio, read as a raw level, sits meaningfully on the call-heavy side of typical. None of this is a forecast — it is a description of where money has been placed.
The key levels map
A note before the ladder: the September 18 expiration's own walls sit in strange places. Its heaviest call open interest is at $65.00 (30,013 contracts) and its heaviest put open interest at $24.00 (14,501) — deep out-of-the-money strikes that are effectively lottery tickets and leftover hedges, not this week's ceiling and floor. The whole chain's aggregate walls are much closer to home: a $50.00 call wall (73,607 contracts) and a $35.00 put wall (46,245). Where the two disagree, the aggregate is the more useful map for the next four days, and the nearest-money open-interest piles inside the September 18 expiration itself — 25,317 calls at $50 and 12,398 puts at $40 — line up with it.
| Level | Price | Why it matters |
|---|---|---|
| Call wall (September 18) | $65.00 | The expiration's heaviest call open interest — far above spot and not a live ceiling this week |
| Heavy call open interest | $60.00 | 42,138 calls chain-wide; a gamma cluster only relevant on a violent squeeze |
| Swing resistance | $52.36 | Recent pivot cluster from price structure |
| Whole-chain call wall | $50.00 | 73,607 calls chain-wide, 25,317 of them in September 18 — the real overhead magnet |
| Top of implied range | $48.36 | Upper 1-sigma rail for the September 18 expiration |
| Swing resistance | $45.82 | First pivot overhead from recent price action |
| 200-day moving average | $45.66 | Price is 4.0% below it — the longer-term structure is still broken |
| Largest gamma strike (estimate) | $45.00 | Biggest total gamma pile chain-wide; 15,824 September 18 calls sit here |
| Spot / close | $43.83 | Friday, September 11 close |
| Swing support | $43.72 | Nearest pivot underneath — thin cushion |
| Max pain (September 18) | $43.00 | The price where the most option value would expire worthless; expirations sometimes gravitate toward it |
| Swing support | $42.24 | The line this week's read is built on — a close below it invalidates the bullish lean |
| 20-day moving average | $41.77 | Price is 4.9% above it |
| 50-day moving average | $40.18 | Price is 9.1% above it — the medium-term floor of the recent base |
| Heaviest near-money put strike | $40.00 | 12,398 September 18 puts plus a large gamma cluster — the practical downside shelf |
| Bottom of implied range | $39.30 | Lower 1-sigma rail for the September 18 expiration |
| Whole-chain put wall | $35.00 | 46,245 puts chain-wide — the deeper structural floor |
| Put wall (September 18) | $24.00 | The expiration's own heaviest put strike — disaster hedges, not support |
| Gamma flip estimate | $22.00 | One rough estimate of where hedging flips from cushioning to amplifying; far below spot |
| 52-week range | $28.93 – $76.87 | Spot sits about 31% of the way up that range, 43.0% below the high |
Positioning and unusual flow
One rough estimate of dealer positioning puts the chain in a positive-gamma regime — market makers hedge the options they have sold, and in this regime that hedging tends to dampen moves rather than amplify them. The September 18 expiration carries the same estimated regime as the aggregate, so the read is consistent for the week. The estimated flip level of $22.00 sits nowhere near spot; treat it as a reminder that the fragile regime is a long way down, not as a tradeable number.
Three live flow items stood out on Friday. The September 18 $45 calls were the single biggest money magnet in the chain — 6,309 contracts traded for roughly $823,000 of premium, against 15,824 contracts of open interest. The September 18 $40 puts traded 6,359 contracts for about $293,000 of premium and added 921 to open interest, which is real downside hedging at the lower expected-move rail. And the September 18 $43.50 puts turned over 815 contracts against only 177 held open — a turnover ratio near 4.6×, which is the signature of fresh, same-day positioning right at the money rather than an old position being managed.
One honest caution against the lean: our leading positioning read — the early, unconfirmed one built only from flow, skew and term structure — flipped into a state in which price has climbed roughly 25% over the trailing window while the positioning score fell about 32 points. Conditions like that have historically preceded a turn; they are not a confirmed turn, and they are the reason every structure below is defined-risk.
3 · Technical check
Both technical reads disagree with the options lean. The 2-day model (target date September 16) is bearish, targeting $43.55 with a projected range of $42.80 to $44.60 — its own forecast, not what the options are pricing. It leans on a bearish short-term moving-average cross, a MACD line below its signal, and an ADX of 14.6 with negative directional movement on top, which together describe a weak, range-bound tape with a mild bearish edge. Its dominant scenario invalidates on a reclaim and hold above $44.10.
The 4-day model (target date September 18, matching our window) is also bearish: target $43.20, projected range $42.30 to $44.60, with support flagged at $42.50 and resistance at $44.90. Its most-weighted scenario needs a close below $43.20 to trigger and is invalidated on a reclaim and hold above $44.30. Notably, its money-flow gauge has stabilized from clearly negative back to the accumulation threshold, which is what keeps the read a measured drift rather than a breakdown.
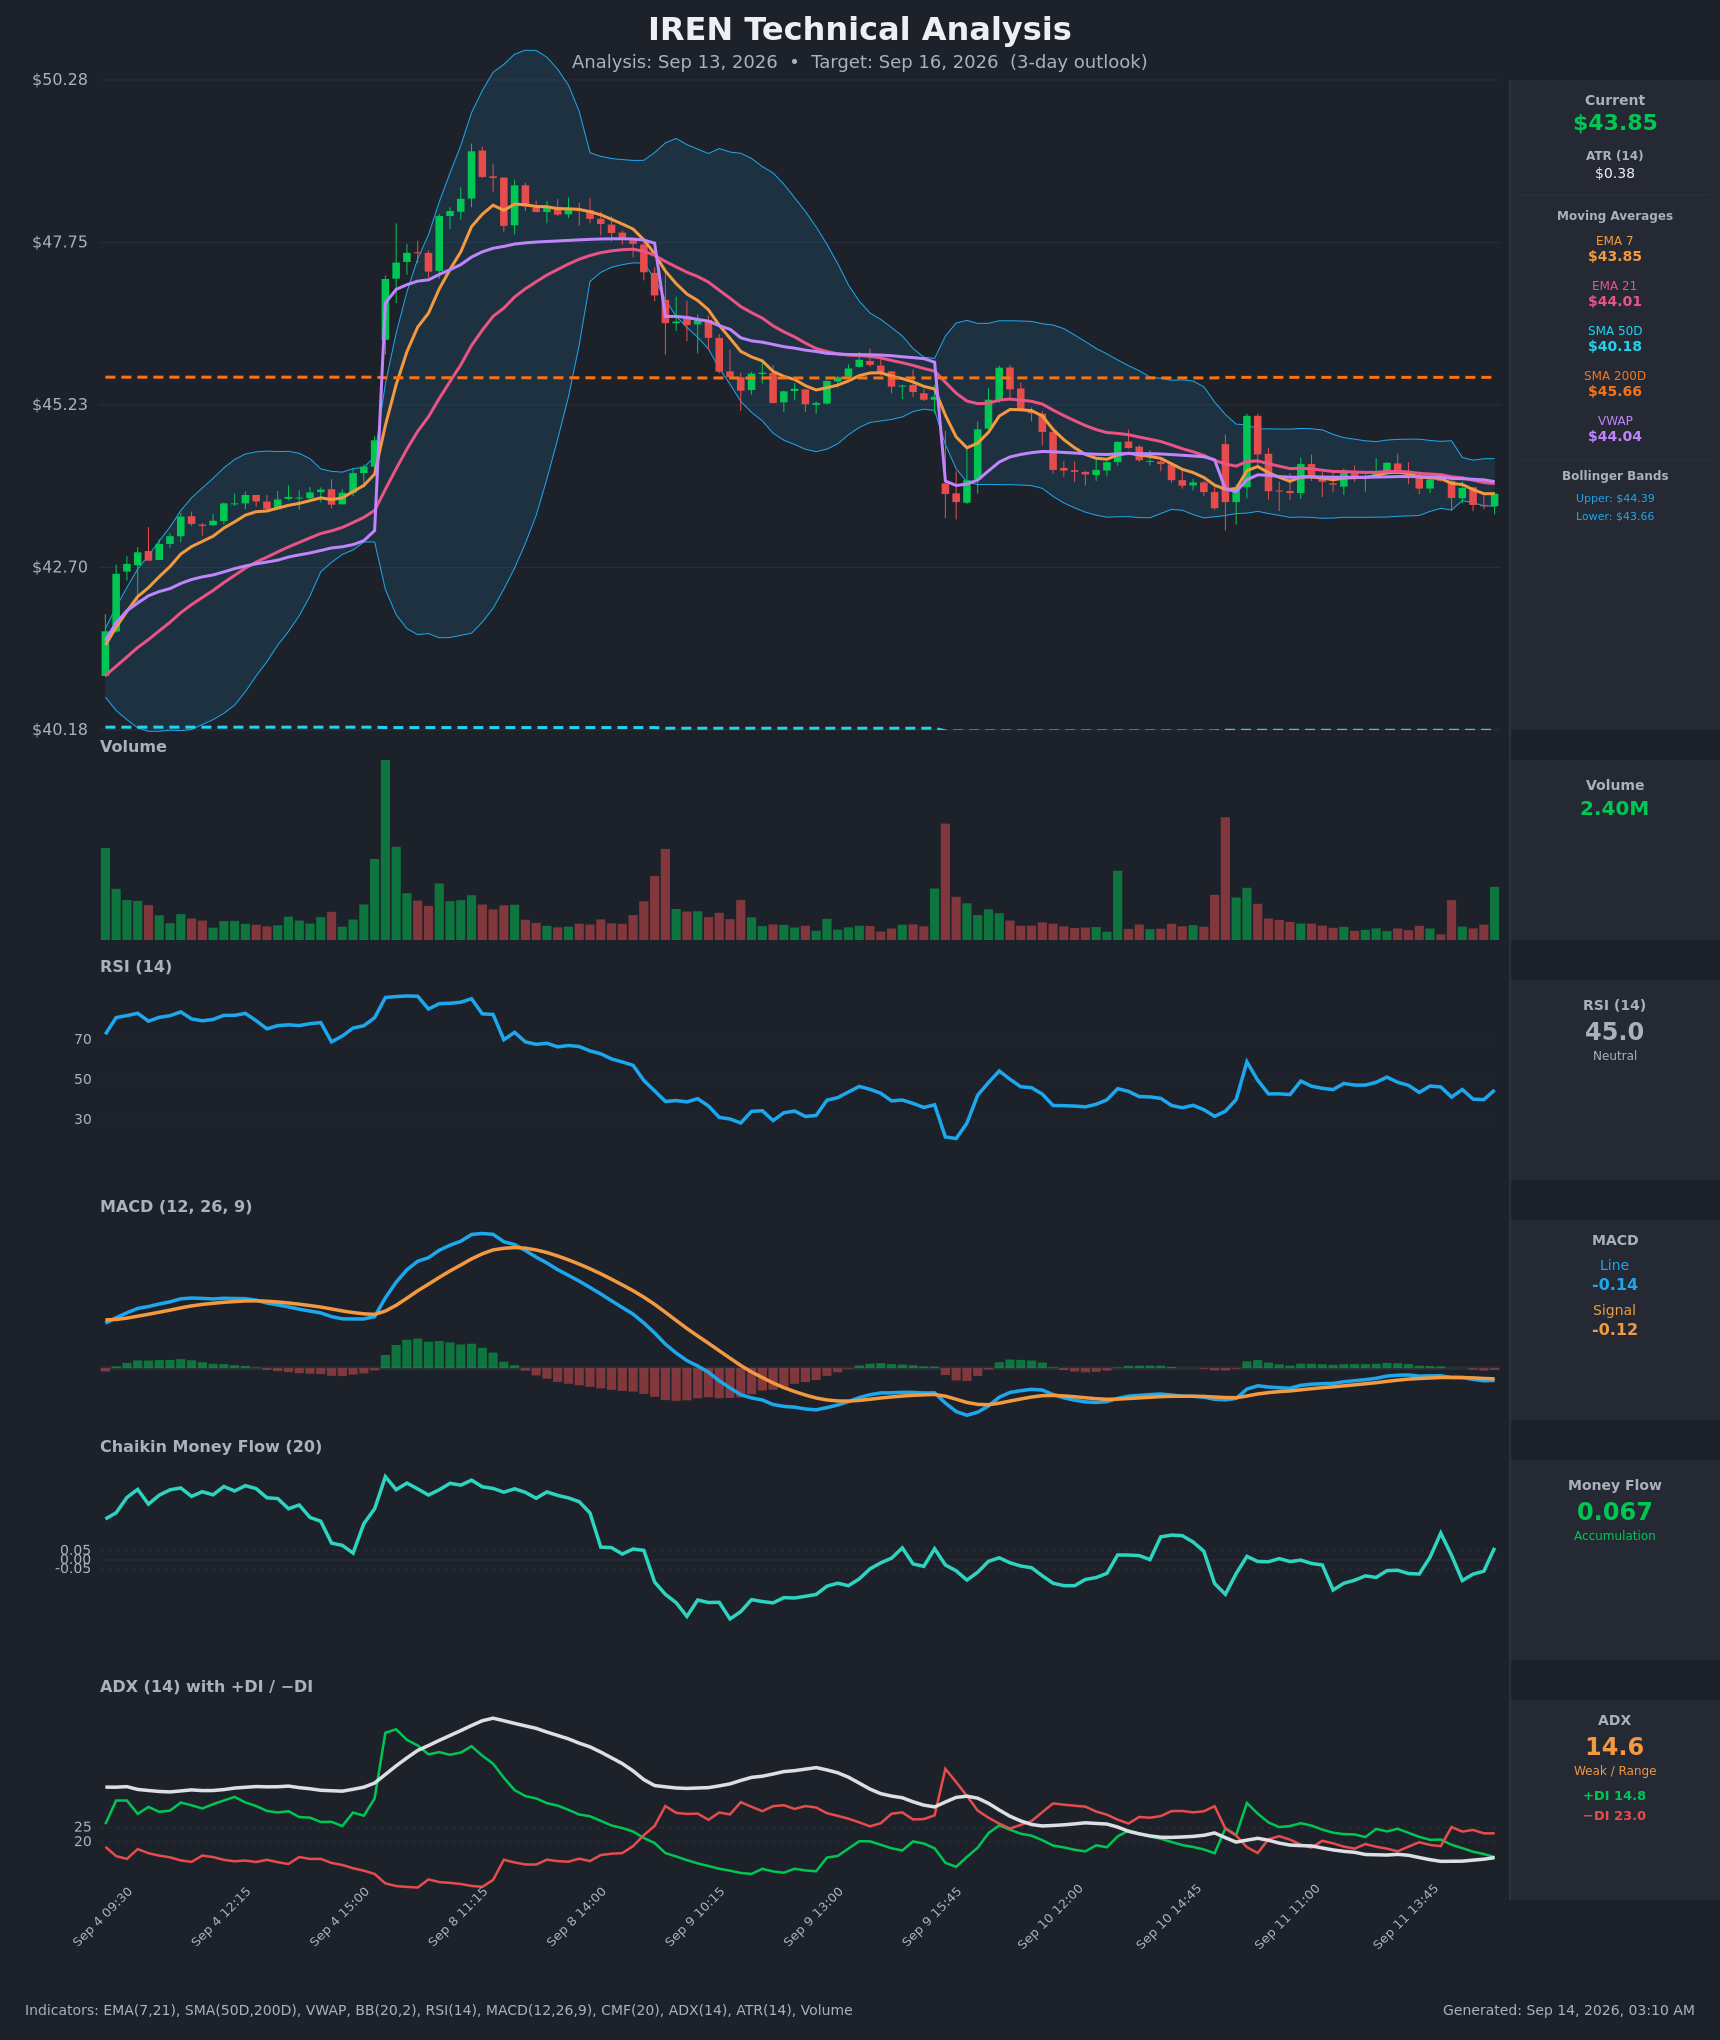
Model vs. Market: The options market implies $39.30–$48.36 into September 18; the 4-day technical model targets $43.20 inside a $42.30–$44.60 band. The technical read is directionally opposed to the options lean but magnitudinally tiny — both models agree the next four days are more likely to be a grind than a gap, and the question that resolves it is simply whether $44.30 gets reclaimed or $43.20 gets lost.
Practically, the divergence did two things to the structures below: it kept the bullish strike selection close to the money rather than reaching for the $50 wall, and it earned the bearish structure a full place in the lineup rather than a footnote.
Full technical write-ups: 2-day report → · 4-day report →
4 · Three ways the next four days can go
If IREN pushes above $48.36 (the top of the implied range) toward the $50 call wall: the heaviest call open interest in the chain sits at $50, and strikes like that tend to act as magnets on the way up and barriers once reached. Between $45 and $50 the September 18 chain is stacked with calls — 15,824 at $45, 25,317 at $50 — so rallies through that zone typically meet hedging supply. The expiration's own $65 call wall is irrelevant at these prices.
If IREN drifts between $42 and $46: this is the base case the positioning map supports. Max pain for September 18 sits at $43.00, only 83 cents under Friday's close, and the estimated positive-gamma regime implies hedging flows that lean against extension in either direction. A four-day chop that ends within a dollar of where it started would surprise nobody holding this chain.
If IREN breaks below $42.24: the next shelf is the 50-day moving average at $40.18 and the heaviest near-money put strike at $40.00, where 12,398 September 18 puts are held open and hedging demand concentrates. That zone also brackets the lower implied-move rail at $39.30. The estimated gamma flip at $22.00 is far enough away that the amplification scenario — where hedging accelerates selling instead of cushioning it — is not on this week's menu.
5 · Three defined-risk structures
Prices are end-of-day midpoints as of September 11, 2026. All structures are hypothetical. Verify live prices before trading — these will be stale by the open.
If you lean bullish: September 18 $44/$47 call debit spread
- Trade: Buy the September 18 $44 call, sell the September 18 $47 call. You pay a debit up front; the spread pays off if IREN finishes above $44 and maxes out above $47.
- Debit: $1.01 · Max profit: $199 per spread · Max loss: $101 per spread · Break-even: $45.01
- Why it fits: with IV rank at 3/100 and options priced about 5.7 vol points below delivered movement, buying premium is the structurally cheap side of this market. The spread's upper strike sits under the $48.36 implied-move rail and well under the $50 call wall, so it is not asking for a level the positioning map fights.
- Makes sense only if: you think the five-day price momentum and the call-tilted flow carry another leg, and you accept that both technical reads currently point the other way.
- Invalidated if: IREN closes below $42.24.
- Managing it: take profit at roughly 60–70% of maximum value rather than holding for the full spread — the short-term trend is fighting a flat two-month picture, which argues for early exits. Close by Thursday, September 17 if the stock has not cleared $44.90; expiration-day gamma on a 4-day spread is not a friend.
- Liquidity note: the $44 calls traded 8¢ wide (4.6% of mid) and the $47 calls 5¢ wide; both were among the most-traded contracts in the chain. Fills are easy.
- Analyze this position →
If you expect the range to hold: September 18 $38/$40/$48/$50 iron condor
- Trade: Sell the $40 put and buy the $38 put; sell the $48 call and buy the $50 call, all September 18. You collect a credit and keep it if IREN finishes between the short strikes.
- Credit: $0.49 · Max profit: $49 per condor · Max loss: $151 per condor · Break-evens: $39.51 and $48.49
- Why it fits: the short strikes bracket the implied-move rails ($39.30 and $48.36) almost exactly, max pain at $43.00 sits in the middle of the tent, and the estimated positive-gamma regime suggests hedging flows that resist extension. The $40 put and $50 call strikes are also the two heaviest near-money open-interest piles in this expiration.
- Health warning: you are selling premium that has not been rich lately — the implied-versus-delivered gap has been negative for most of the past two weeks and IV rank is 3/100. Risking $151 to collect $49 with no volatility edge is the weakest risk/reward in this article, and it is here for completeness, not conviction.
- Makes sense only if: you specifically want a pin trade into a four-day expiration and are sizing it small.
- Invalidated if: IREN closes outside $39.51–$48.49; manage well before then.
- Managing it: close at roughly 50% of max credit, and close the threatened side rather than hoping if either short strike is breached intraday.
- Liquidity note: the $40 puts traded 4¢ wide, the $38 puts 5¢, the $48 calls 2¢ and the $50 calls 1¢ — tight, but the credit is thin enough that slippage matters a lot here.
- Analyze this position →
If you lean bearish: September 18 $43/$40 put debit spread
- Trade: Buy the September 18 $43 put, sell the September 18 $40 put. You pay a debit; the spread pays off below $43 and maxes out below $40.
- Debit: $0.95 · Max profit: $205 per spread · Max loss: $95 per spread · Break-even: $42.05
- Why it fits: this is the structure that expresses both technical reads directly — the 4-day model's $43.20 target and $42.00–$42.50 downside zone sit inside the spread's payoff. Cheap implied volatility makes the long put the efficient way to hold that view, and the short $40 strike rests on the heaviest near-money put open interest in the expiration, where hedging demand tends to slow descents anyway.
- Makes sense only if: you weight the chart structure above the flow lean and accept you are trading against a slightly bullish positioning read.
- Invalidated if: IREN closes above $44.30 — the 4-day technical model's own invalidation level.
- Managing it: take profit near $40.50 rather than waiting for the full spread width; exit by Thursday, September 17 if the stock is still above $43.00, since max pain at $43.00 works against the last dollar of this trade.
- Liquidity note: the $43 puts traded 10¢ wide (7.1% of mid) on 1,444 contracts and the $40 puts 4¢ wide on 6,359 contracts — both easily fillable.
- Analyze this position →
If none of these: no trade
There is a legitimate case for standing aside. The options bias is slightly bullish, both technical models are bearish, and the gap between the two is roughly 60 cents of target price — that is not a disagreement worth paying for. Premium is not rich, so the income case is weak; the stock is chopping inside a two-month range, so the directional case is weak; and four days is a short window in which to be right about a name that has moved 25% in a fortnight and given most of it back. If your edge here is "the stock could go either way and options are cheap," a long straddle is the honest expression of that view — and at a ±10.33% break-even requirement, even that is not obviously a bargain. Waiting for a close through $44.30 or $42.24 to pick a side costs nothing but patience.
6 · Quick FAQ
What is IREN's expected move this week? About ±$4.53, or ±10.33%, into the September 18 expiration — a $39.30 to $48.36 range around the $43.83 close, per straddle pricing as of September 11.
Is IREN expected to go up or down over the next four days? Options positioning as of September 11 leans slightly bullish — call-tilted volume and a skew flatter than this stock's own norm — but that is a read of what traders have done, not a forecast. Both technical models point mildly lower. The actionable map is the $39.30–$48.36 range with $40.00 as the practical floor and $50.00 as the practical ceiling.
Are IREN options expensive right now? No. IV rank of 3/100 says option prices are lower than roughly 97% of the past year's readings, and on top of that they are running about 5.7 vol points below the movement IREN has actually delivered — a gap sitting at about the 51st percentile of this stock's own recent readings. That combination favors owning premium over collecting it.
Where is IREN's biggest options support and resistance? For the September 18 expiration, the largest open-interest clusters that matter are $40.00 on the put side (12,398 contracts) and $50.00 on the call side (25,317 contracts). The expiration's technical put and call walls sit far out at $24.00 and $65.00 and are not live levels this week.
What invalidates this read? A close below $42.24.
Methodology & disclosures. Data: end-of-day options-chain snapshot for IREN, 2026-09-11, generated 2026-09-14T03:10:23.082Z. Prices shown are midpoints and will differ from live markets. Momentum/positioning scores and volatility-premium comparisons are descriptive measurements of past option flow and past price movement — not investment advice, signals, forecasts, or guarantees. All trade structures are hypothetical. Every structure shown has a defined maximum loss; you can lose the entire max-loss amount. Options involve substantial risk and are not suitable for all investors.