IREN Options Outlook: Will the $16 Put Wall Hold Into November 20?
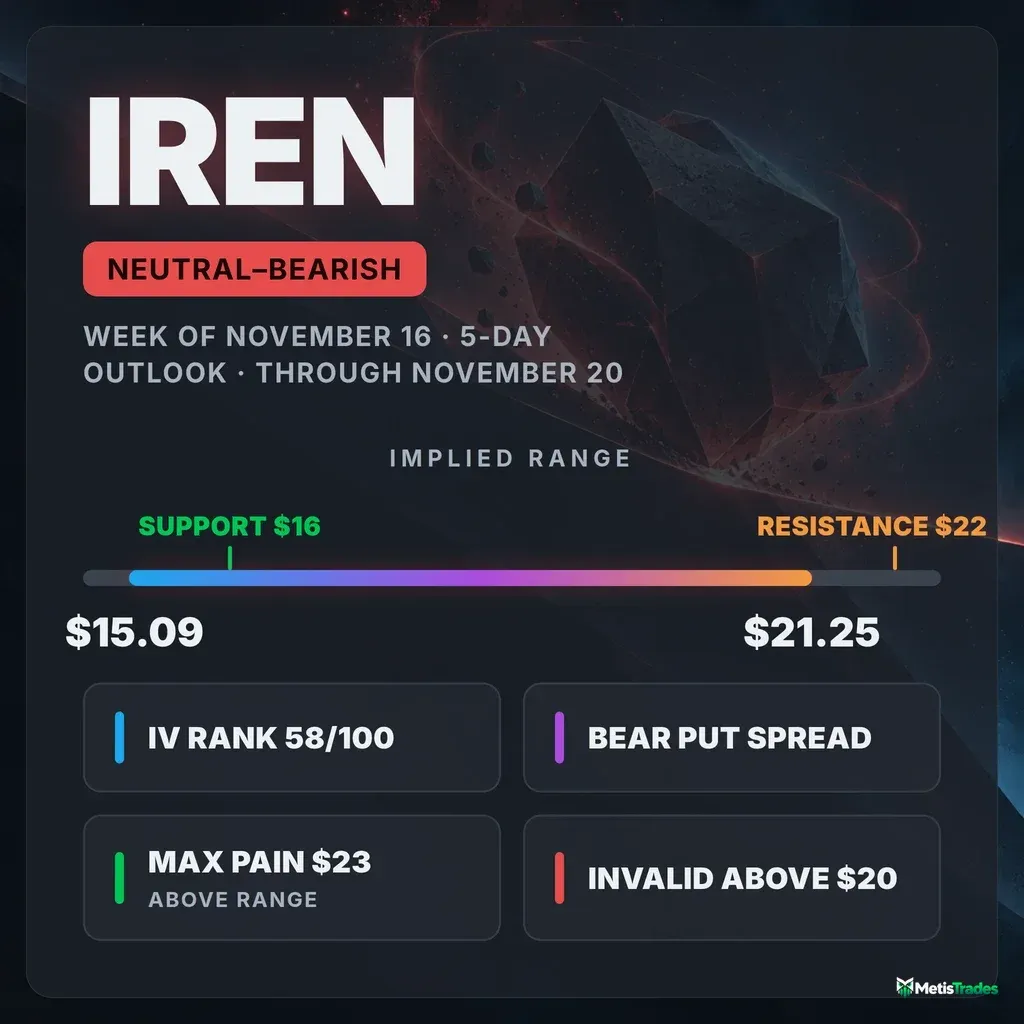
IREN options imply a $15.09–$21.25 range into the November 20 expiration after a 16% slide. Put-heavy flow keeps our read slightly bearish, and cheap premium relative to actual movement favors debit structures over selling options.
Listen to this analysis — prefer audio? This IREN outlook is also available as a podcast episode:
The options market implies a $15.09–$21.25 range into the November 20 expiration. Here is what is driving it, where the walls sit, and three defined-risk ways to trade it.
Published Sunday, November 15, 2026 · Data as of Friday, November 13, 2026 close
Explore the live IREN options data in the Detailed Options Analyzer →
Quick answer
| Item | Answer |
|---|---|
| Market bias | Slightly bearish (neutral with a bearish tilt) |
| Options-implied range (into Nov 20) | $15.09 – $21.25 (±$3.08, ±16.95%) |
| Major support | $16 put wall (Nov 20 expiration); $15 put wall across the whole chain |
| Major resistance | $22 call wall (Nov 20 expiration); $20 call wall across the whole chain |
| Max pain (Nov 20) | $23 |
| Dealer gamma regime (estimate) | Negative: hedging tends to amplify moves. Flip level n/a, because no flip strike could be estimated from this chain. |
| Volatility condition | Neutral, elevated but flat on the week. IV rank 57.77/100 · ATM IV 113.08% · premium thin: options are priced about 28 vol pts below delivered movement. |
| Technical check | Confirms (bearish; 3-day target $17.75, range $17.30–$18.30; 5-day target $17.60, range $16.95–$18.35) |
| Best-fitting strategy | Bear put spread (Nov 20 $18/$16), only if price stays below $19 |
| Analysis invalidated if | IREN closes above $20 |
1 · What matters today
IREN closed Friday, November 13 at $18.17, down 16% in five sessions and barely a dollar above its 52-week low. Our read of the options market is slightly bearish. The main reason is that traders keep adding put protection: for every call contract held open, there are now 1.55 puts. The options market is pricing a move of about $3.08 either way into the November 20 expiration, a range of roughly $15.09 to $21.25.
The level that matters most is the $16 put wall. That strike holds the biggest pile of put contracts below the price, and a break of it removes the nearest cushion. If IREN instead closes above $20, the bearish lean is off.
Options are also unusually cheap relative to how violently the stock has actually been moving, so this setup favors buying defined-risk spreads over selling premium. Both technical models point the same way, with targets in the mid-$17s.
2 · What the options market is pricing
What changed this week
The stock fell 16.0% over the past five sessions to $18.17, and the options market leaned harder into protection along the way:
- Put/call open interest. This compares contracts currently held open; above 1 means puts outnumber calls. It climbed from 1.37 to 1.55 over five days, well above its 14-day average of 1.28.
- Put/call volume. Friday's ratio was 0.92 against a 7-day average of 0.76. That is unusually put-heavy for IREN versus its own recent history.
- Friday's new positions. Call open interest shrank by about 17,300 contracts while put open interest grew by about 22,900.
- Implied volatility. Overall IV actually dipped 3.2% on the week, but it remains 56.6% higher than a month ago.
- Skew collapsed. Over the past week, puts ran an average of 17 vol points over calls. By Friday that premium had all but vanished. Traders were still buying puts, but they stopped paying crash-level prices for them.
The short- and long-term trend reads all agree: the stock is down 16% over the past week, 33% over about a month, and 56% over roughly two and a half months. Near-term flow is not fighting the bigger picture.
Expected move
The expected move is the move the options market is pricing in, derived from what straddles cost. For the November 20 expiration it is ±$3.08, or ±16.95% around $18.17. That gives a range of $15.09 to $21.25. That expiration's own at-the-money options carry about 122% implied volatility, a bit above the 113.08% headline reading, because the nearest contracts are priced for the most turbulence.
| Expiration | Implied move | Range around $18.17 |
|---|---|---|
| November 20 | ±16.95% | $15.09 – $21.25 |
| November 27 | ±22.21% | $14.13 – $22.21 |
| December 4 | ±27.01% | $13.26 – $23.08 |
| December 11 | ±31.37% | $12.47 – $23.87 |
The rungs widen roughly with the square root of time, with no sudden step between them. The market is not bracing for any single dated event in this window, just persistent, large daily swings.
Volatility
Implied volatility (IV) is the market's estimate of how much IREN will move, baked into option prices. At-the-money IV sits at 113.08%, above both its 30-day average (104.5%) and its 90-day average (101.8%).
- IV rank is 57.77/100. This shows where today's IV sits versus the past year: options are pricier than about 58% of the past year's range. The IV percentile of 75 says today's level beat three-quarters of the past year's daily readings.
- Front-month read unavailable. The November 13 weekly expired Friday, so the front-month slope can't be computed. Earlier in the week, front-dated options were priced well above longer-dated ones, the classic stress shape.
- Realized movement is extreme for this name. Twenty-day realized volatility is about 141%, well above this stock's own recent norm. ("Unusually high" here means unusual for IREN, not versus the broader market.) The past five sessions, however, have been calmer than the month as a whole.
Premium rich or cheap? The volatility risk premium is the gap between how much movement options are priced for and how much IREN has actually delivered. When it is positive, option sellers have been collecting more than realized movement cost them. Right now it is negative:
- Options are priced about 28 vol points below what IREN has actually delivered over the past 20 sessions (roughly 113% implied vs. 141% realized). That is an unusually deep discount for this name.
- On percentile, today's gap sits at 28/100. It is richer than only 28% of this stock's own recent readings.
- The gap flipped from positive to negative on November 6, as the early-November whipsaws filled the realized-volatility window. These included a 17.3% gap up on November 6. The gap has narrowed slightly since, from about 36 points below on November 11.
The combination of IV rank near 58 and a premium running well below delivered movement favors owning premium through debit spreads rather than selling it this week.
Skew and sentiment
Skew captures the fact that puts and calls the same distance from the stock price don't cost the same. When puts are pricier, traders are paying up for crash protection.
- Skew is now almost flat. 25-delta puts trade at 114.2% IV versus 114.7% for calls, a skew of about −0.5 vol points against a 60-day norm of −1.5. The fact that matters is the speed of the change: skew flattened by more than 21 vol points in five sessions. Put buyers are no longer paying a panic premium even as they keep buying.
- Short-dated options lean bullish. Options expiring within a week score +35 (calls building) and the 8–30 day window scores +23. The overall regime reads "broadly bullish" today, versus a mixed picture on its 7-day average.
That bullish short-dated reading sits awkwardly beside the put-heavy volume and open interest. We read it as dip-buyers dabbling in short calls inside an intact downtrend, not as a turn.
The key levels map
| Level | Price | Why it matters |
|---|---|---|
| 50-day moving average | $34.05 | Price is 47% below it, a measure of how stretched the downtrend is |
| Largest call open interest anywhere | $25 | 63,489 contracts; a leftover from higher prices, context only |
| Swing resistance | $23.72 | Nearest price-structure ceiling |
| 20-day moving average | $23.60 | Price sits 23% below it |
| Max pain (Nov 20) | $23 | Where the most Nov 20 option value would expire worthless; it sits outside the implied range |
| Call wall (Nov 20) | $22 | 11,205 calls; the heaviest overhead pile for this expiration |
| Implied range high (Nov 20) | $21.25 | Upper edge of the priced-in move |
| Whole-chain call wall / largest gamma strike | $20 | 60,498 calls and the biggest gamma concentration in the chain; also the invalidation level |
| Spot (Nov 13 close) | $18.17 | Where the week starts |
| 52-week low / swing support | $17.16 | The last price-structure floor before the walls |
| Put wall (Nov 20) | $16 | 10,556 puts; the nearest options-derived cushion |
| Implied range low (Nov 20) | $15.09 | Lower edge of the priced-in move |
| Whole-chain put wall | $15 | 60,546 puts across all expirations; the deeper floor |
A few terms in the map, defined:
- Call wall / put wall: the strike with the biggest pile of open call or put contracts. These often act like magnets or barriers.
- Max pain: the price where the most option value would expire worthless. Expirations sometimes gravitate toward it.
The November 20 walls ($16/$22) are wider than the whole-chain walls ($15/$20). For the next five days, the $16/$22 pair is the one that applies. Max pain at $23 sits above the call wall and outside the implied range, so it is unlikely to act as much of a magnet this week.
Positioning and unusual flow
One rough estimate of dealer positioning puts IREN in a negative-gamma regime, both for the November 20 expiration and across the chain. Market makers hedge the options they've sold, and in this regime their hedging tends to amplify moves rather than dampen them. That is consistent with the outsized daily swings. No gamma-flip level could be estimated from today's chain.
The flow worth noting, all in non-expired contracts:
- Nov 20 $18 puts: 13,719 contracts traded, about $1.54 million in premium. This was the most dollars spent on any IREN contract, with the last print at the ask, a sign of buyers paying up for at-the-money protection.
- Nov 20 $18.50 puts: open interest jumped by 7,325 contracts to 8,443, fresh positioning right at the money.
- Nov 20 $25.50 calls: open interest rose by 7,383 to 8,177. These are far out-of-the-money lottery tickets, roughly 40% above spot.
- Nov 20 $11 puts: 6,200 contracts traded against 316 open. This is cheap disaster insurance at about 3.5¢.
The money is concentrated in near-the-money puts. The call activity is small-dollar and far away.
3 · Technical check
Near-term (3-day) model: confirms. It is bearish with a $17.75 target and a $17.30–$18.30 projected range for November 18, comfortably inside the options market's priced move. It names support at $17.69 and resistance at $18.59, and its dominant bearish-continuation scenario is invalidated by a close above $19.00. The model flags a moving-average stack firmly pointed down and a strengthening downtrend reading (ADX rising toward 25 with sellers dominant). It also notes money flow turning slightly positive, its main argument for a short relief bounce.
5-day model: confirms. It is also bearish, targeting $17.60 by November 20 with a $16.95–$18.35 range. It names support at $17.65 and resistance at $18.59, describes the tight base near $17.90 as a bearish flag, and is invalidated by a close above $18.60.
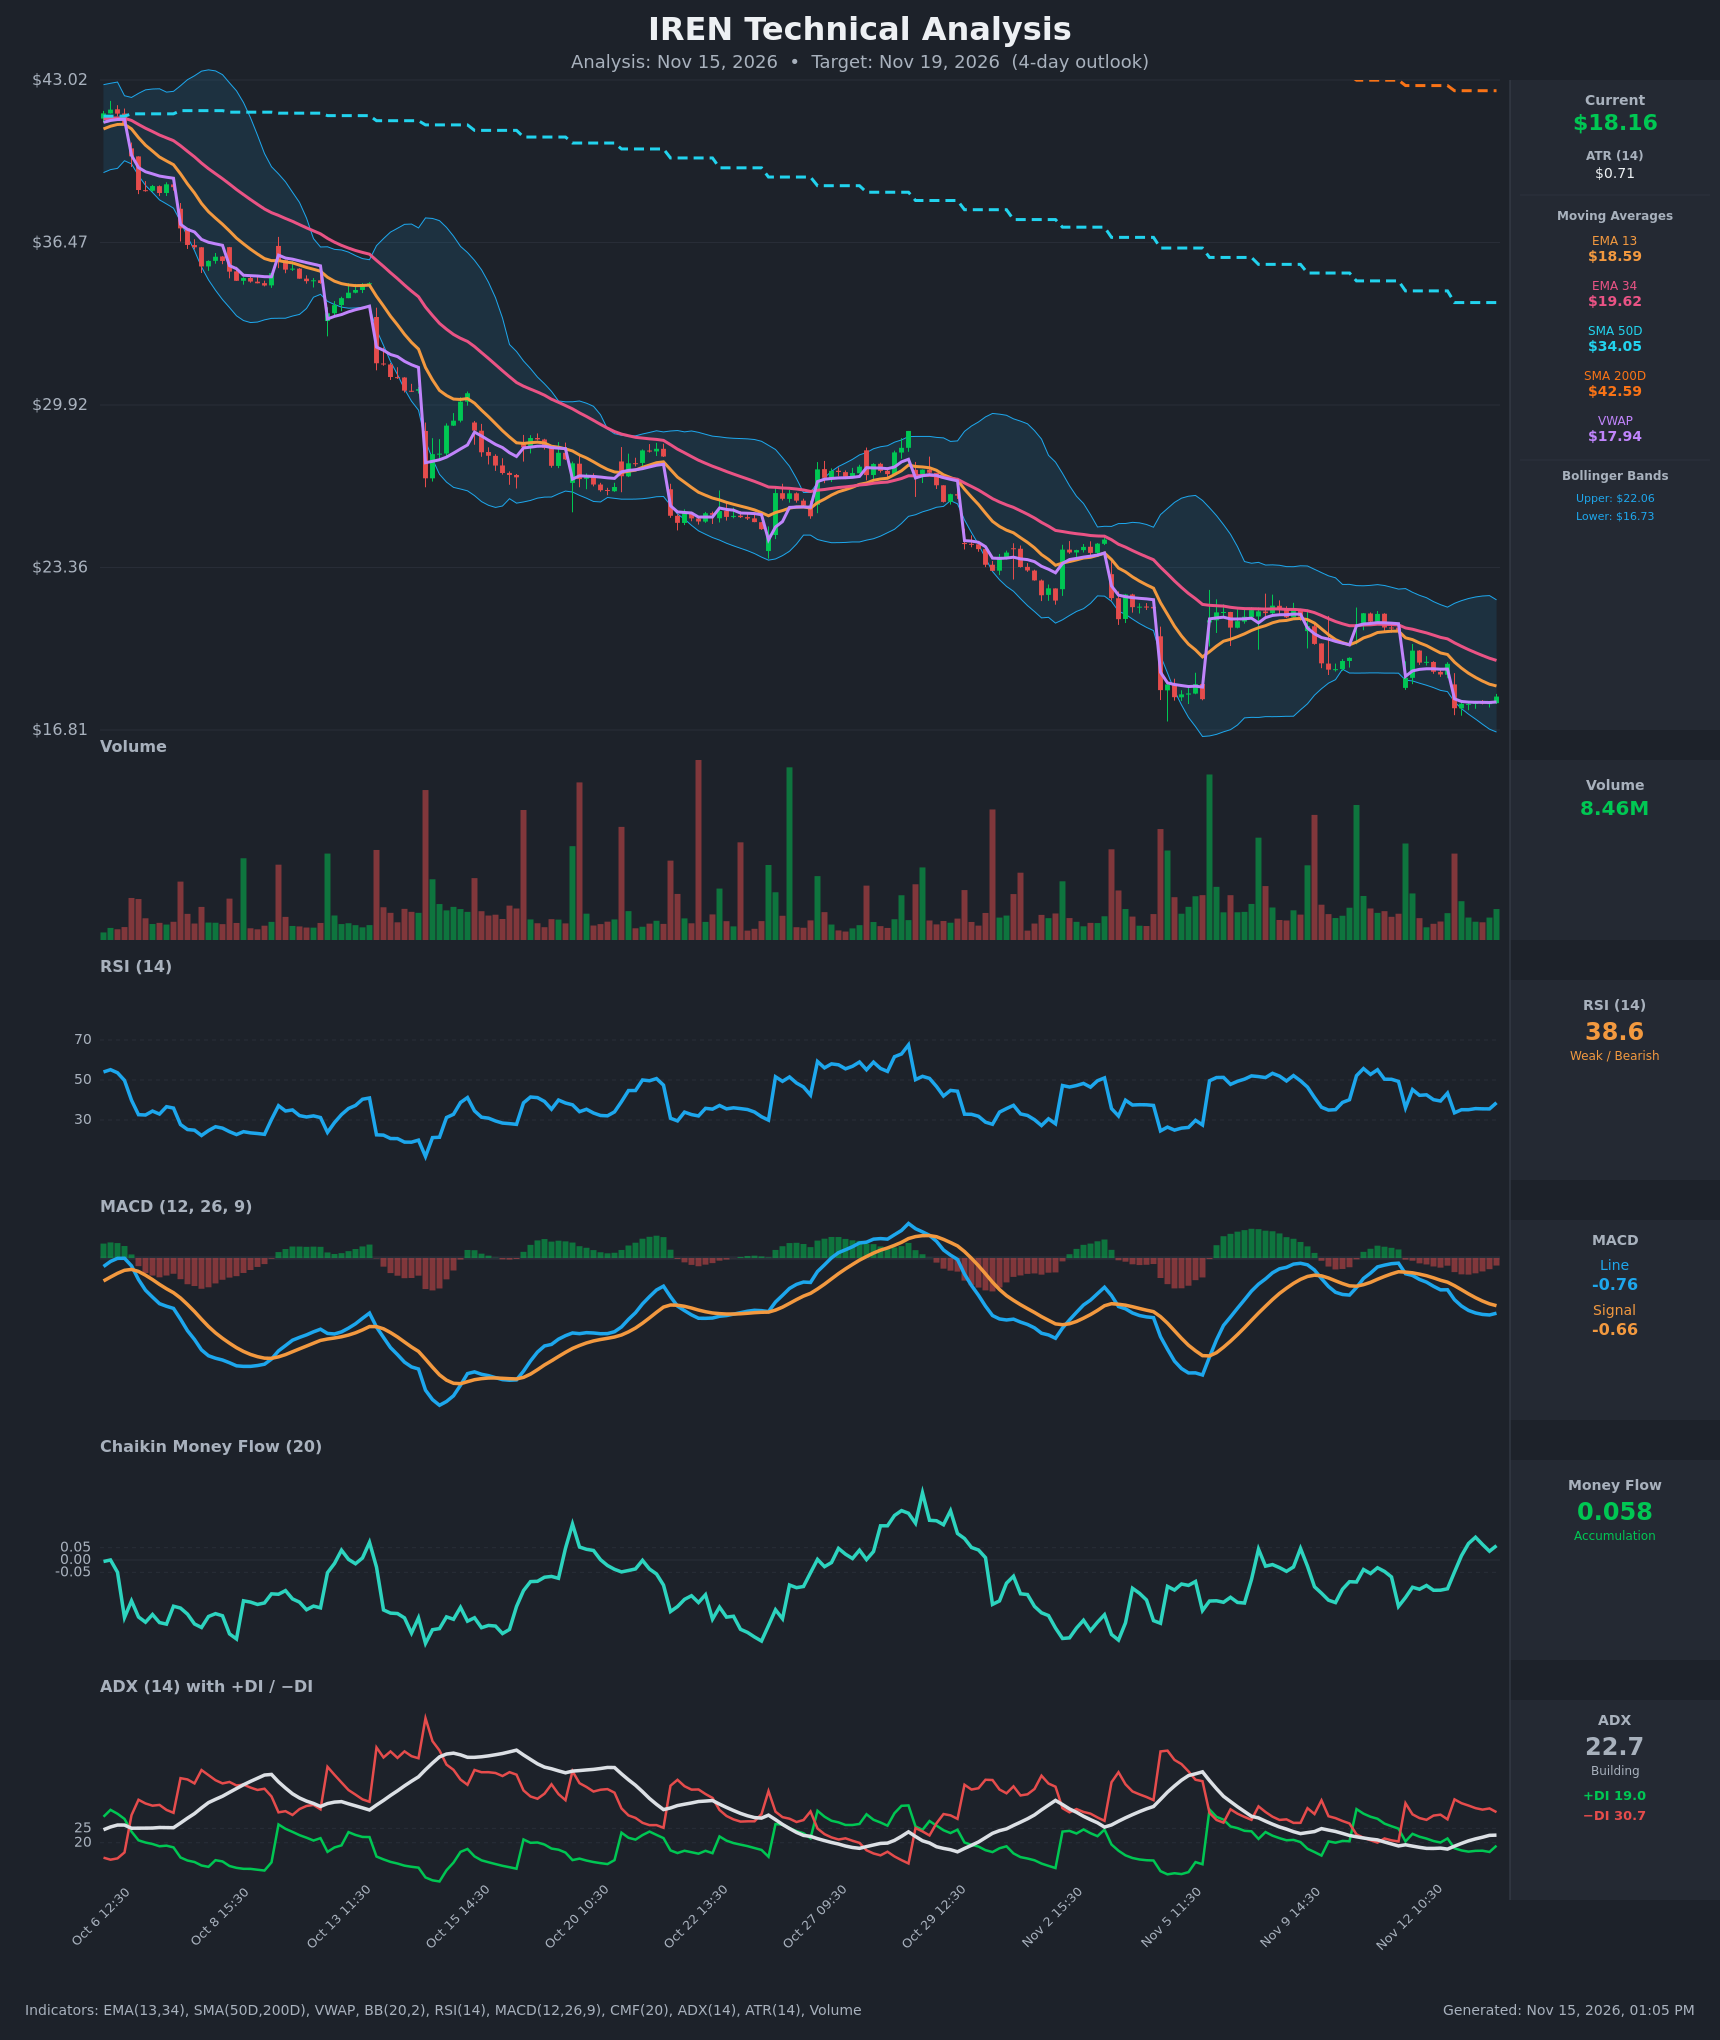
Model vs. Market: The options market implies $15.09 – $21.25 into November 20; the 5-day technical model targets $17.60 within a much tighter $16.95–$18.35 band. The chart model expects a grind lower, while options are priced for a $3-a-side swing. A close below $16.95 or above $18.35 by November 20 would show which view was too narrow.
The TA's $17.30 low and $18.59 resistance shaped the bearish spread below: its break-even sits at $17.30, and its exit trigger lives just above $19.
Full technical write-ups: 3-day report → · 5-day report →
4 · Three ways the week can go
If IREN pushes above the call wall ($22): The $20 whole-chain call wall, the chain's biggest gamma strike, sits in the way first. Clearing both would mean the lean failed and short-dated call buyers won. In a negative-gamma regime, a break can extend quickly toward the $23 max-pain strike and the $23.60–$23.72 zone.
If IREN drifts between the walls: This is the base case, chop between $16 and $22. The $17.16 52-week low and the TA's $17.65–$18.59 band define the inner box. Heavy put building near $18 and $18.50 shows where traders expect the fight, and max pain at $23 is too far away to pull price meaningfully.
If IREN breaks below the put wall ($16): With no flip level to lean on and the whole chain estimated in negative gamma, one rough estimate suggests hedging would add to selling rather than cushion it. The next options floor is the $15 whole-chain wall, with the implied-range low at $15.09 right beside it.
5 · Three defined-risk structures
Prices are end-of-day midpoints as of November 13, 2026. All structures are hypothetical. Verify live prices before trading — these will be stale by the open.
Because options are priced well below the movement IREN has actually delivered, debit structures lead this week. In a debit spread you pay up front and profit if the stock moves your way.
If you lean bearish: Nov 20 $18/$16 bear put spread
- Trade: Buy the Nov 20 $18 put ($1.125), sell the Nov 20 $16 put ($0.425).
- Debit: $0.70 ($70 per spread) · Max profit: $1.30 ($130) at or below $16 · Max loss: $0.70 ($70) · Break-even: $17.30
- Why it fits: Put/call open interest is at 1.55 and climbing, and the money is concentrated in at-the-money puts. Options are also cheap relative to realized movement, so owning premium is the better side. The short leg sits on the $16 put wall, and the break-even matches the near-term TA's $17.30 range low.
- Makes sense only if: IREN fails to reclaim $18.59 early in the week.
- Invalidated if: IREN closes above $19.00.
- Managing it: Take profits around $1.00–$1.10 if the stock tags $16.50. If IREN is still above $18 at the November 18 checkpoint, cut it. Exit by November 19 rather than holding through expiration.
- Liquidity note: The $18 puts traded 3¢ wide (about 2.7%), so fills are easy. The $16 puts were also 3¢ wide, but that is about 7% of their price; work the order at mid.
- Analyze this position →
If you expect the range to hold: Nov 20 $15/$16/$22/$23 iron condor
- Trade: Sell the Nov 20 $16 put ($0.425) and buy the $15 put ($0.255). Sell the Nov 20 $22 call ($0.245) and buy the $23 call ($0.17).
- Credit: $0.245 ($24.50) · Max profit: $24.50 if IREN expires between $16 and $22 · Max loss: $0.755 ($75.50) · Break-evens: $15.755 and $22.245
- Why it fits: The short strikes sit exactly on the November 20 put and call walls. Here you collect a credit and win if IREN stays between the short strikes. One honest warning: you're selling premium that hasn't been rich lately. The short strikes are also inside the $15.09–$21.25 expected move, which is why the credit-to-risk ratio is only about 1:3.
- Makes sense only if: Daily swings keep cooling, as the past five sessions suggest.
- Invalidated if: IREN closes below $16 or above $22.
- Managing it: Close at about 50% of max credit. Close immediately on a close through either short strike, and do not hold into the November 20 session.
- Liquidity note: The $16 puts and $22 calls each traded 3¢ wide. The $15 puts were 3¢ wide on a $0.255 mark, about 12%. With four legs, expect to give up a cent or two of an already-thin credit.
- Analyze this position →
If you lean bullish: Nov 20 $18/$20 bull call spread
- Trade: Buy the Nov 20 $18 call ($1.30), sell the Nov 20 $20 call ($0.56).
- Debit: $0.74 ($74) · Max profit: $1.26 ($126) at or above $20 · Max loss: $0.74 ($74) · Break-even: $18.74
- Why it fits: This is the relief-bounce case. Put skew has bled off, short-dated sentiment reads bullish, and money flow ticked positive. The short leg sits at the $20 whole-chain call wall, where a bounce would likely stall.
- Makes sense only if: IREN reclaims $18.59 on rising volume.
- Invalidated if: IREN closes below $17.16.
- Managing it: This trade fights a downtrend that is aligned across every horizon, so keep it short. Take profits near $19.50, and exit at the November 18 checkpoint if the bounce hasn't started.
- Liquidity note: The $18 calls traded 2¢ wide (1.5%). The $20 calls were 4¢ wide (about 7%), so use a limit at mid.
- Analyze this position →
If none of these: no trade
Standing aside is a real option this week. Each of the setups above has a weak point:
- Swing size. IREN has been moving 140%-annualized, and a 17% overnight gap happened inside the last two weeks. A $3 swing in either direction can blow through any of these strikes in a single session.
- Premium selling. Premium is thin relative to delivered movement, so there is no edge in selling it.
- Direction. The bearish lean is a tilt, not a conviction call, and the leading positioning read already shows the kind of price-down, positioning-improving divergence that has preceded turns.
If you can't stomach a full-max-loss day, the cleanest choice is to wait for a decisive close below $16 or above $20 before committing.
6 · Quick FAQ
What is IREN's expected move into November 20? About ±$3.08 (±16.95%), a range of $15.09–$21.25 based on straddle pricing as of the November 13 close.
Is IREN expected to go up or down over the next five days? Options positioning as of November 13 leans slightly bearish, because put open interest and put volume keep building. That is a read of what traders have done, not a forecast. The actionable map is the $15.09–$21.25 range and the $16/$22 walls.
Are IREN options expensive right now? By IV rank (57.77/100), options are pricier than about 58% of the past year's range. But they are running about 28 vol points below the movement IREN has actually delivered, richer than only 28% of this stock's own recent readings. Relative to realized swings, premium is cheap, which favors buying spreads over selling them.
Where is IREN's biggest options support and resistance? For the November 20 expiration: the $16 put wall and the $22 call wall. Across the whole chain they are $15 and $20.
What invalidates this week's read? A close above $20.
Methodology & disclosures. Data: end-of-day options-chain snapshot for IREN, 2026-11-13, generated 2026-11-15T13:05:48.121Z. Prices shown are midpoints and will differ from live markets. Momentum/positioning scores and volatility-premium comparisons are descriptive measurements of past option flow and past price movement — not investment advice, signals, forecasts, or guarantees. All trade structures are hypothetical. Every structure shown has a defined maximum loss; you can lose the entire max-loss amount. Options involve substantial risk and are not suitable for all investors.