IWM Options Are Pricing a $9.30 Move Into November 13. Can the $272 Put Wall Hold?
After a sharp selloff, IWM options imply a $264.37–$282.97 range into the November 13 expiration, with positioning leaning slightly bearish. Here is what's driving that read, the levels that matter, and three defined-risk ways to trade it.
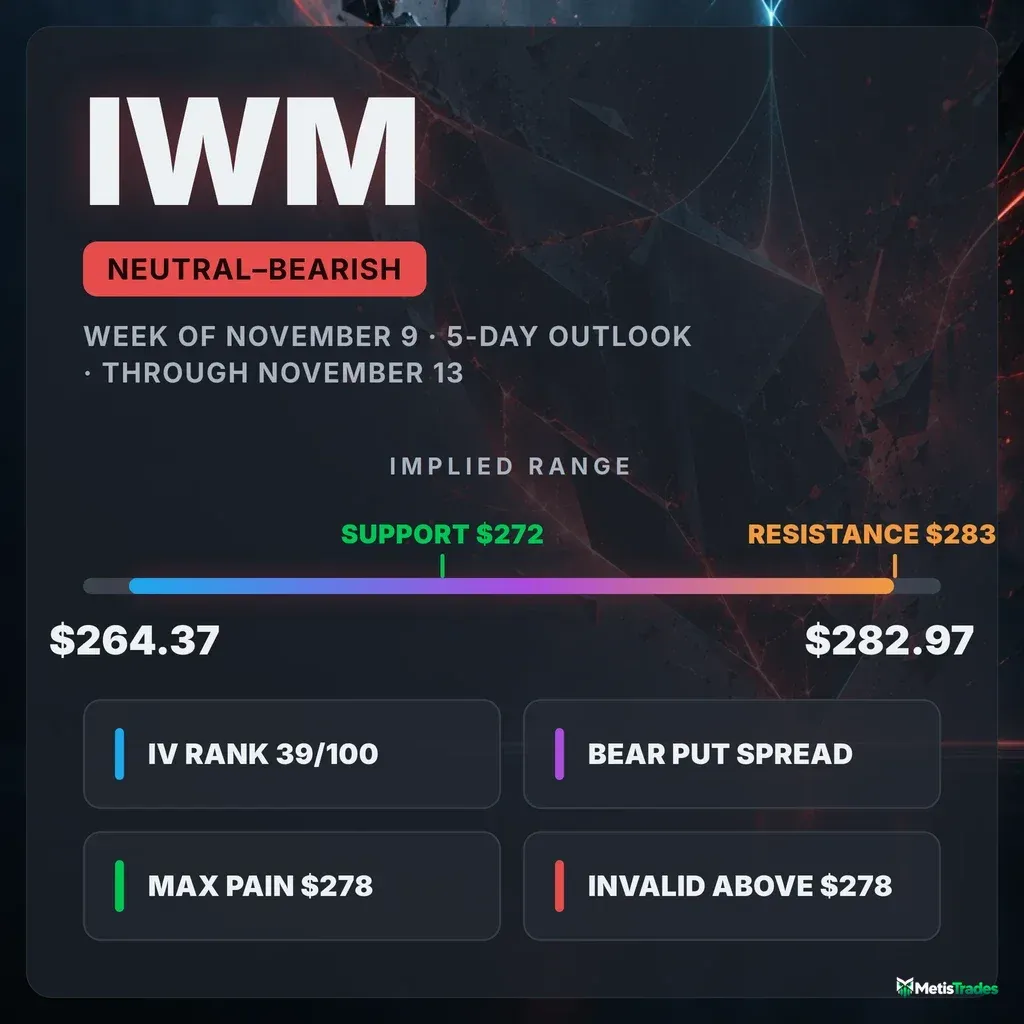
The options market implies a $264.37–$282.97 range into the November 13 expiration. Here's what's driving it, and three defined-risk ways to trade it.
Published Sunday, November 8, 2026 · Data as of Friday, November 6, 2026 close
Explore the live IWM options data in the Detailed Options Analyzer →
Quick answer
| Item | Answer |
|---|---|
| Market bias | Slightly bearish (neutral with a bearish tilt) |
| Options-implied range (into Nov 13) | $264.37 – $282.97 (±3.40%, ±$9.30) |
| Major support | $272 put wall (Nov 13 expiration); $270 is the whole chain's heaviest put strike |
| Major resistance | $283 call wall (Nov 13 expiration) |
| Max pain (Nov 13) | $278 |
| Dealer gamma regime (estimate) | Negative: hedging tends to amplify moves; flip level ≈ $259 |
| Volatility condition | Rising over the week. IV rank 38.84/100 · premium thin: options are priced ~0.6 vol pts below delivered movement |
| Technical check | Confirms (bearish, 3-day target $272.00 and 5-day target $271.00) |
| Best-fitting strategy | Nov 13 $272/$265 bear put spread (a debit structure, because premium is thin) |
| Analysis invalidated if | IWM closes above $278 |
1 · What matters today
IWM closed Friday, November 6 at $273.67. That is about 2% lower on the week, after one sharp down day knocked it off $284. Our read of the options market is slightly bearish. Traders are paying well above normal for downside protection, and short-dated sentiment has turned negative across the board.
The options market is pricing a move of about $9.30 either way by the November 13 expiration, which gives a range of roughly $264 to $283. The one level that matters most is $272, the strike with the biggest pile of open put contracts for that expiration. IWM is sitting just above it. A break below $272 opens the lower half of the range. A close back above $278 would undo the bearish lean.
Both chart-based technical models also lean bearish, with targets near $271–$272.
2 · What the options market is pricing
What changed this week
IWM fell 2.03% over the past five sessions. Almost all of that came from a single selloff that took the price from about $284 to $271. Implied volatility (IV), which is the market's estimate of how much IWM will move, baked into option prices, rose 15.8% over the five days. It then eased 8.5% on Friday as the price steadied.
The bigger shift is in open interest (contracts currently held open). The put/call open-interest ratio climbed from 1.71 to 2.55 in five days, meaning there are now about 2.5 puts held open for every call. Its 7-day average is 1.91 and its 14-day average is 1.83, so traders have been stacking downside protection at a fast pace.
The single biggest open-interest change was a roll down in protection on the November 20 expiration:
- The $270 puts shed 34,338 contracts.
- The $259 puts added 32,961 contracts on 44,701 traded.
That pattern looks like hedgers moving their floor lower rather than abandoning it. The short- and long-term trend reads both point down (the past week and the past two-plus months, with the month-long read flat), so the near-term weakness is not fighting a bigger uptrend.
Expected move
The expected move is the move the options market is pricing in, derived from what straddles cost. Into November 13 it is ±3.40%, or ±$9.30, around the $273.67 spot price.
| Expiration | Implied move | Range around $273.67 |
|---|---|---|
| Nov 11 (midpoint checkpoint) | ±2.81% | $265.98 – $281.36 |
| Nov 13 (target) | ±3.40% | $264.37 – $282.97 |
| Nov 20 | ±4.80% | $260.53 – $286.81 |
| Dec 4 (~1 month) | ±6.34% | $256.32 – $291.02 |
The rungs scale smoothly with time. There is no bump at any single date, so the market isn't bracing for one specific event inside this window.
Volatility
At-the-money IV sits at 23.09%. IV rank shows where today's IV sits versus the past year. At 38.84/100, today's IV is cheaper than about 61% of the past year's range. The IV percentile is 75, however, so today's level is still higher than most individual days of the past year.
IV is well above its own recent averages: 19.49% over 30 days and 18.75% over 90 days. It is up 27% over the past 30 sessions. The term-structure read, which compares option prices across expiration dates, is unavailable today because Friday was an expiry day. The ~60-day IV of 22.35% sits close to the front of the curve.
Realized movement explains the jump. IWM's 10-day realized volatility is 29.3% and its 20-day is 23.7%. That 20-day figure is far above this name's own recent norm, and short-term movement is accelerating relative to the past month at an unusually fast clip for IWM. "Unusual" here means unusual for IWM compared with its own history, not versus the broader market.
Is premium rich or cheap? The volatility risk premium is the gap between how much movement options are priced for and how much IWM has actually delivered. When it's positive, option sellers have been collecting more than realized movement cost them.
- Right now it is slightly negative: options are priced about 0.6 vol points below what IWM has actually delivered over the past 20 days.
- Its percentile (where today's gap sits versus this stock's own recent readings) is just 3/100, so the premium is thinner than almost every reading in recent months. That is an unusually depressed reading for this name.
- Only a week ago the gap was a healthy ~5 points positive. The selloff's realized movement simply outran the repricing in options.
An IV rank in the high 30s combined with a 3rd-percentile premium over delivered movement favors owning premium over selling it this week.
Skew and sentiment
Skew describes the fact that puts and calls the same distance from the stock price don't cost the same. When puts are pricier, traders are paying up for crash protection. Today:
- 25-delta puts carry an IV of 26.6% versus 19.8% for calls, a gap of 6.8 vol points.
- IWM's 60-day norm is 4.0 points, and the 14-day average is 4.5.
- That makes skew stretched well beyond its own recent history. Traders are paying a clear premium to protect against a further drop.
The put/call ratio measures how much put activity there is relative to calls; above 1 means puts dominate. Friday's put/call volume ratio was 1.19, below its 7-day average of 1.33 and close to the 14-day average of 1.16. Friday's trading itself was calmer, but the inventory of open puts kept growing.
Sentiment in short-dated options reads broadly bearish:
- The 0–7 day bucket scores −7, a mild reading, because fresh call open interest offset rich put pricing.
- The 7–30 day bucket scores −37, more firmly negative.
- Both 7-day averages (−18 and −32) confirm the lean has persisted rather than spiking for one day.
Our broader flow read sits at −29, against a 7-day average of −8. Flow turned sharply put-heavy over the last three sessions after two broadly neutral-to-bullish weeks.
The key levels map
| Level | Price | Why it matters |
|---|---|---|
| 52-week high | $305.18 | IWM is 10.3% below it |
| Whole-chain call wall | $300 | Heaviest call open interest across all expirations (88,083 contracts); far out of reach this week |
| 100-day moving average | $289.65 | Longer-term trend marker well overhead |
| Swing resistance | $287.34 | Prior pivot cluster |
| Call wall (Nov 13) | $283 | Biggest pile of open calls for the target expiration; tends to cap rallies |
| Implied range high (Nov 13) | $282.97 | Top of the 1-standard-deviation expected move |
| Swing resistance | $282.84 | Pivot that lines up with the call wall |
| 50-day moving average | $282.11 | Lost in the selloff |
| Large-gamma strike | $280 | Heavy combined options exposure, a potential magnet |
| 200-day moving average | $279.00 | Major trend line, now overhead |
| Max pain (Nov 13) | $278 | Where the most option value would expire worthless; also this article's invalidation level |
| 20-day moving average | $276.84 | Nearest overhead average |
| Large-gamma strike / swing resistance | $275 / $274.99 | First ceiling above spot |
| Spot | $273.67 | Friday's close |
| Put wall (Nov 13) | $272 | Biggest pile of open puts for the target expiration (12,959 contracts) |
| Whole-chain put wall / largest-gamma strike | $270 | 308,532 open puts across all expirations |
| Swing support | $269.88 | The selloff low area |
| Large-gamma strike | $265 | Heavy put open interest |
| Implied range low (Nov 13) | $264.37 | Bottom of the expected move |
| Gamma flip (estimate) | $259 | One rough estimate; also where Nov 20 put open interest just built |
| 52-week low | $228.90 | Far below |
A note on the walls: the November 13 walls ($272 put, $283 call) are tighter than the whole chain's heaviest strikes ($270 put, $300 call). For the next five days, the November 13 levels are the ones in play. The November 4 gap up from $279.79 has already been fully reversed.
Positioning and unusual flow
Market makers hedge the options they've sold. One rough estimate puts IWM in a negative-gamma regime, both for the whole chain and for the November 13 expiration specifically. In that regime, hedging tends to amplify moves rather than dampen them. That fits the oversized realized volatility this week.
The same estimate places the flip level, below which hedging tends to accelerate selling rather than cushion it, far down at about $259. Treat both figures as loose estimates, not observed dealer books.
Flow worth noting:
- Nov 27 $267 puts: 30,439 contracts traded against only 1,972 open, about $10.8 million in premium. That is a large, fresh downside bet or hedge sitting just below the expected-move floor.
- Dec 18 $275 puts: the day's biggest money line at roughly $32.6 million in premium (36,705 contracts). Institutions are protecting at the money into year-end.
- Nov 9 $279 calls: 14,098 traded versus 537 open. Cheap lottery-ticket calls on a quick snapback show there's a speculative bounce crowd too.
Peer-relative unusual activity skewed to puts on Friday: 22 put contracts cleared the unusual bar versus 13 calls.
For index context, IWM's implied volatility has tracked the VIX closely over the past 60 sessions, and the VIX sits in the upper third of its 52-week range.
3 · Technical check
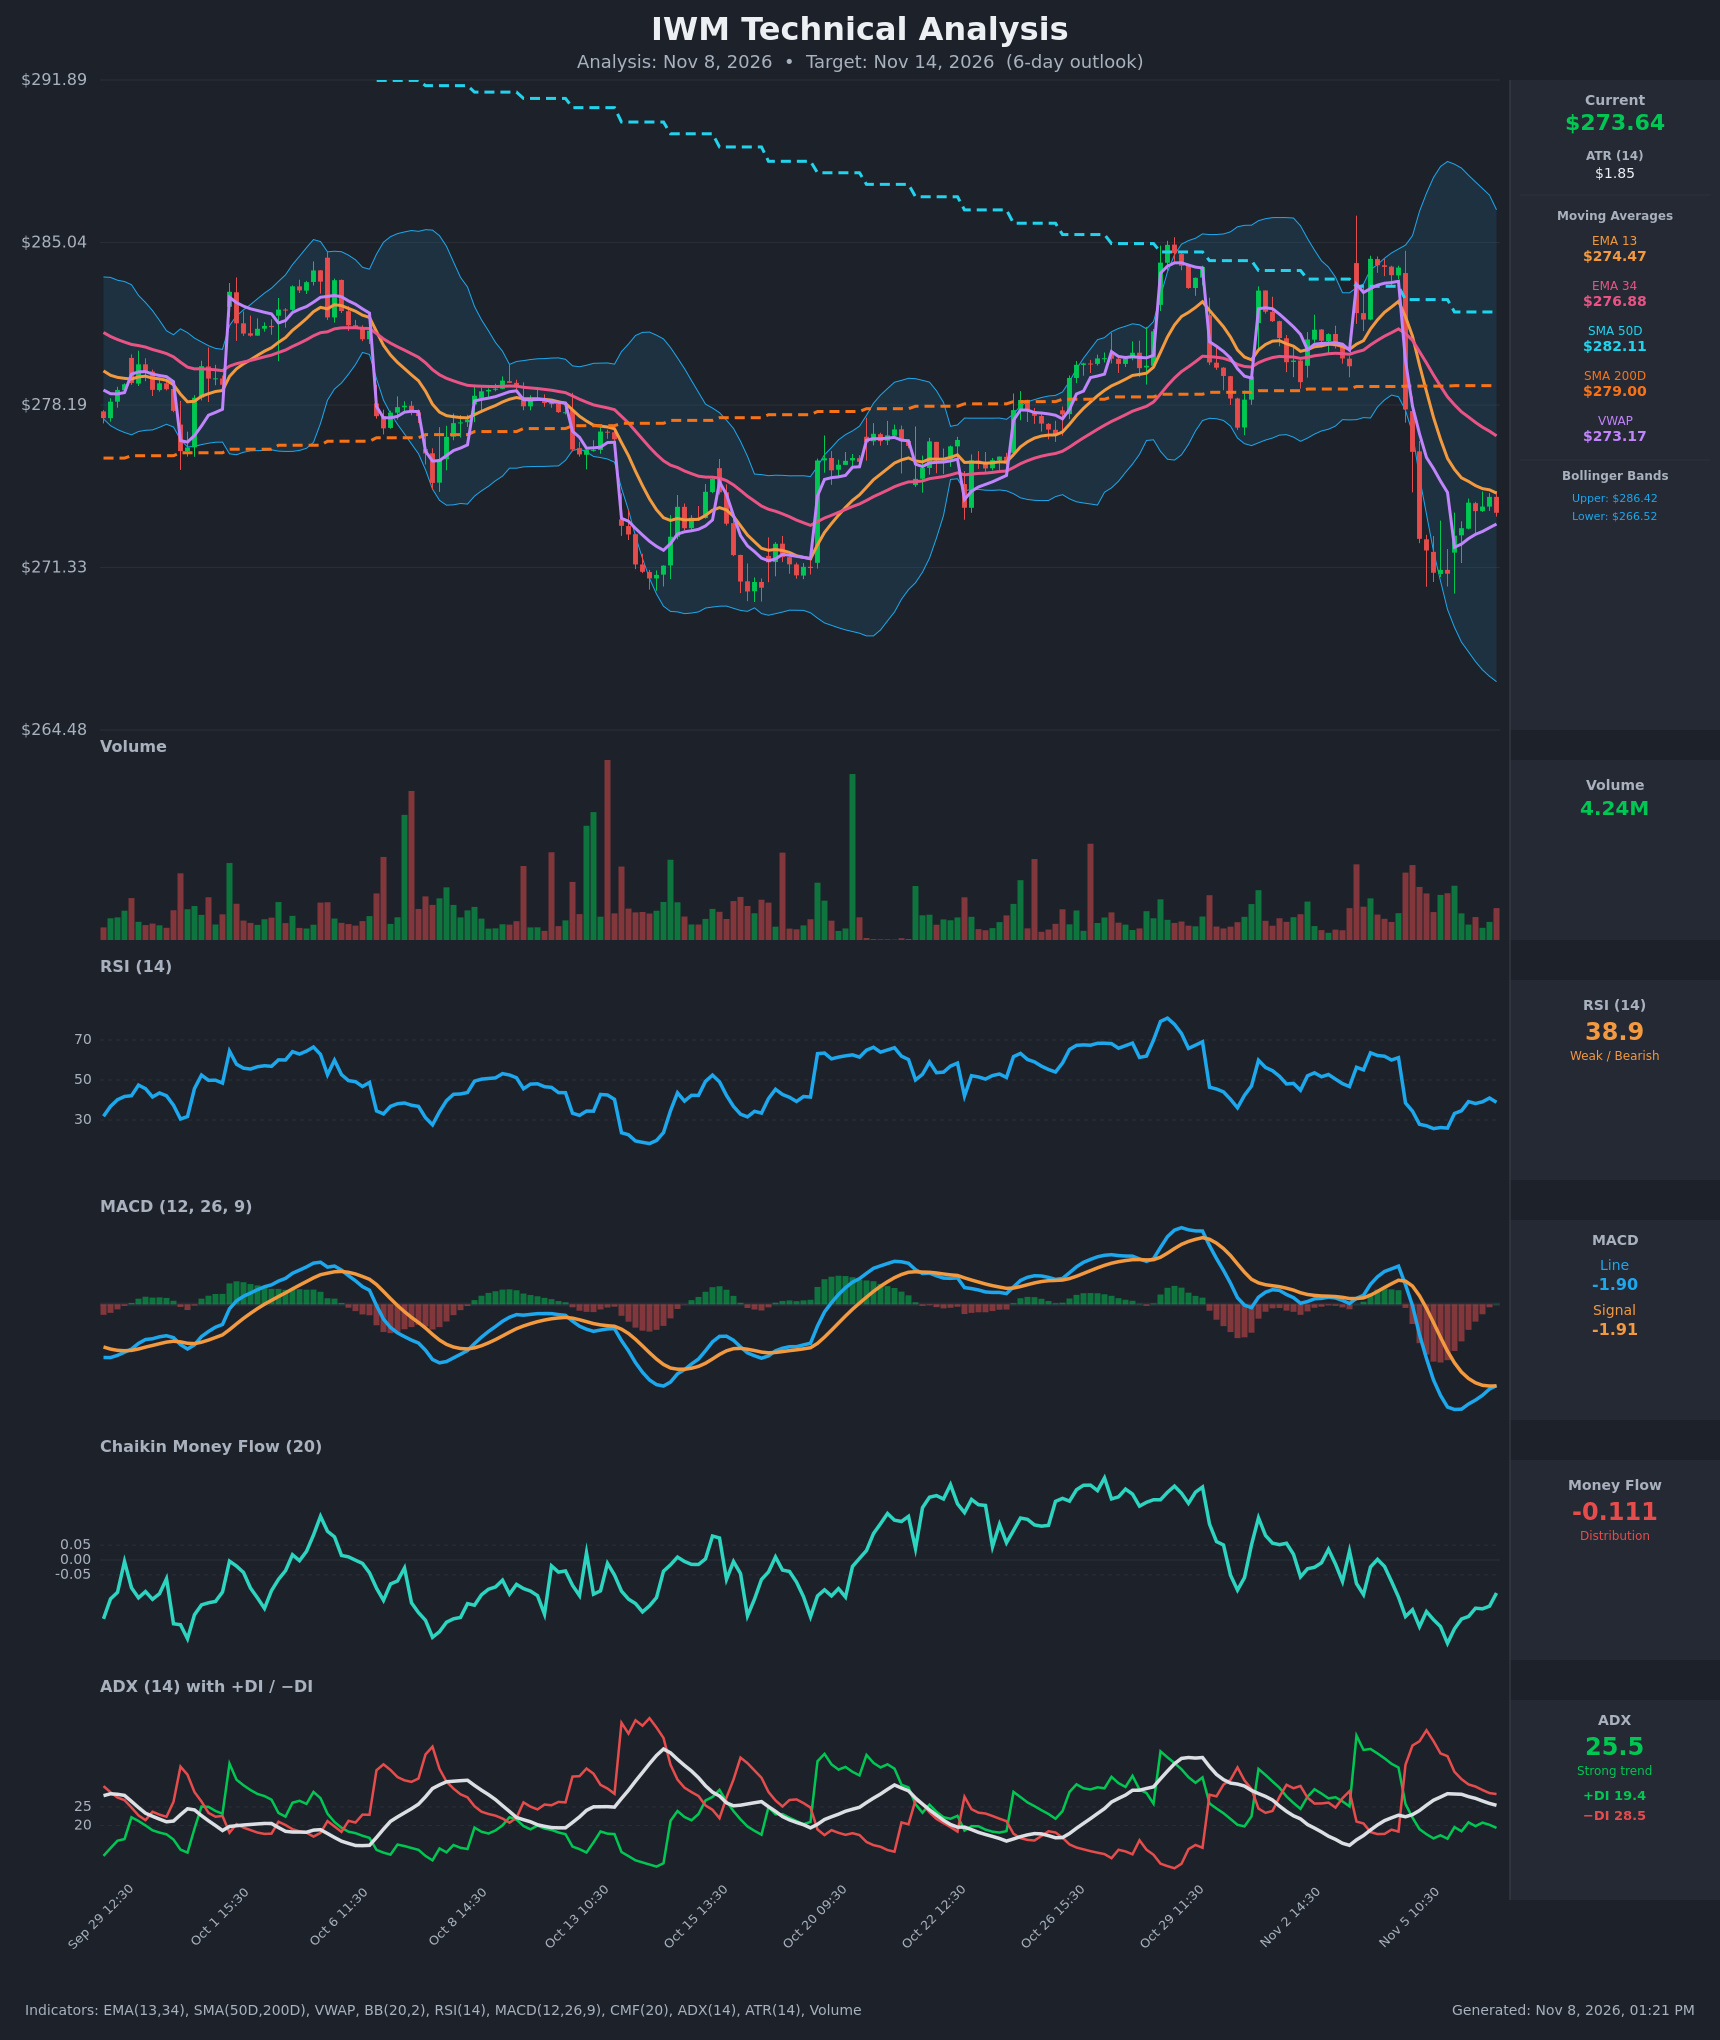
Both chart models lean bearish, and both targets fall inside the options-implied range. That classifies them as Confirms.
- 3-day model: targets $272.00 by its November 11 checkpoint, with a projected range of $267.00–$277.50. That fits inside the November 11 implied range of $265.98–$281.36.
- 5-day model: targets $271.00 for November 13, with a projected range of $265.50–$278.50, inside the options' $264.37–$282.97.
The two most decisive indicator reads are a still-bearish trend-strength reading and negative money flow. The downtrend's strength gauge sits around 25 with sellers in control, but it is fading. Money flow remains in distribution even as it improves. Both models flag the post-selloff bounce as low-volume and resembling a bearish flag. Their dominant scenario breaks below $271 and is invalidated by a close above $277, just under our $278 line.
Model vs. Market: The options market implies $264.37–$282.97 into November 13; the 5-day technical model targets $271.00. The chart model sees a modest drift below the $272 put wall, well inside what options are pricing. The disagreement is about whether the put wall holds, not about the size of the move.
Full technical write-ups: 3-day report → · 5-day report →
The confirming TA nudged strike selection. The bearish spread's short leg sits at $265, near the models' lower projections ($267.00 and $265.50).
4 · Three ways the week can go
If IWM pushes above the call wall ($283): The heaviest November 13 call open interest sits overhead. It lines up with $282.84 swing resistance and the top of the implied range, which together tend to slow rallies. Getting there first means reclaiming the 20-, 200- and 50-day averages ($276.84, $279.00 and $282.11). A clean break would leave thinner positioning until the $285 strikes on later expirations.
If IWM drifts between the walls: Max pain at $278 sits above spot. Expiring open interest tends to pull price toward it into November 13, which is the main counterweight to the bearish lean. A drift into the $272–$278 band would bleed both short puts and short calls, and it is where long-premium positions struggle most.
If IWM breaks below the put wall ($272): Below $272 sit the whole chain's $270 put wall and the $269.88 swing low, then little until $265. In an estimated negative-gamma regime, hedging tends to add to selling rather than absorb it, so a break can travel toward the $264.37 implied low. The estimated flip level sits much lower at ~$259, so the acceleration case doesn't require reaching it.
5 · Three defined-risk structures
Prices are end-of-day midpoints as of November 6, 2026. All structures are hypothetical. Verify live prices before trading, because these will be stale by the open.
Because the premium over delivered movement is unusually thin, debit structures lead here. The bearish spread comes first because it matches the bias.
If you lean bearish: Bear put spread (featured)
- Trade: Buy the Nov 13 $272 put, sell the Nov 13 $265 put. You pay a debit and profit if IWM falls toward $265.
- Debit: $1.70 ($2.96 − $1.265) · Max profit: $530 · Max loss: $170 · Break-even: $270.30
- Why it fits: Skew is stretched, put inventory is building (put/call open interest is 2.55), and sentiment in the 7–30 day bucket is firmly negative. Option premium is thin, so buying it is reasonable. The $265 short leg sits near both chart models' lower projections.
- Makes sense only if: IWM can't reclaim the $275–$277 ceiling.
- Invalidated if: IWM closes above $278.
- Managing it: Take profits at ~50–60% of max value if the $270 area gives way. With the short- and long-term trend both pointing down, there's no need to rush, but exit by the November 12 session rather than holding into expiration-day gamma.
- Liquidity note: The $272 puts quoted 4¢ wide ($2.94/$2.98) and the $265 puts 3¢ wide ($1.25/$1.28). Fills should be easy.
- Analyze this position →
If you lean bullish: Bull call spread
- Trade: Buy the Nov 13 $275 call, sell the Nov 13 $280 call. You pay a debit and profit if IWM rallies toward max pain and the averages overhead.
- Debit: $1.99 ($3.125 − $1.14) · Max profit: $301 · Max loss: $199 · Break-even: $276.99
- Why it fits: Max pain at $278 and the November 13 put wall just under spot are the supportive side of the ledger. Cheap premium makes a debit structure the efficient way to express a relief bounce.
- Makes sense only if: IWM holds $272 and breaks above $275 on improving volume.
- Invalidated if: IWM closes below $271.
- Managing it: This trade fights the prevailing trend, so take profits early, around $278–$279, and close if the $272 put wall fails.
- Liquidity note: The $275 calls quoted 3¢ wide ($3.11/$3.14) and the $280 calls 2¢ wide ($1.13/$1.15). This is very liquid.
- Analyze this position →
If you expect the range to hold: Iron condor
- Trade: Sell the Nov 13 $266/$261 put spread and the Nov 13 $283/$288 call spread. You collect a credit and keep it if IWM stays between the short strikes.
- Credit: $1.04 ($0.62 put side + $0.42 call side) · Max profit: $104 · Max loss: $396 · Break-evens: $264.96 and $284.04
- Why it fits: The short call sits on the $283 call wall, and the short put sits just above the $264.37 implied low. Max pain at $278 is well inside the tent. One caveat: you're selling premium that hasn't been rich lately, because options are priced below what IWM has actually delivered.
- Makes sense only if: Realized volatility cools from its recent spike.
- Invalidated if: IWM closes below $266 or above $283.
- Managing it: Close at ~50% of the credit. If either short strike is touched, close rather than hope, since negative gamma can extend moves.
- Liquidity note: The $266 puts are 3¢ wide ($1.41/$1.44) and the $283 calls 2¢ wide ($0.50/$0.52). The $288 call wing ($0.08/$0.10) is only 2¢ wide in dollars but large relative to its tiny price, so expect a cent or two of slippage there.
- Analyze this position →
If none of these: no trade
Standing aside is a legitimate call this week. The bearish lean is modest. Max pain pulls one way while flow pushes the other, and IWM is parked almost exactly on the $272 put wall, the level where it decides.
Credit structures are swimming against a thin premium, and debit structures need a move that a choppy, negative-gamma tape can deliver in either direction. Waiting until the November 11 checkpoint is also reasonable. A decisive close below $271 or above $277 would clarify which half of the range is in play, at the cost of a few days' worth of premium.
6 · Quick FAQ
What is IWM's expected move this week? About ±$9.30 (±3.40%) into the November 13 expiration, a range of $264.37 to $282.97, per straddle pricing as of November 6.
Is IWM expected to go up or down over the next week? Options positioning as of November 6 leans slightly bearish, driven by rich put pricing and rising put inventory. That's a read of what traders have done, not a forecast. The actionable map is the $264.37–$282.97 range, with the $272 put wall and the $283 call wall as the key levels.
Are IWM options expensive right now? IV rank of 38.84/100 says options sit in the lower-middle of the past year's range. They're also priced about 0.6 vol points below the movement IWM has actually delivered, thinner than roughly 97% of this ETF's recent readings. That favors buying premium over selling it.
Where is IWM's biggest options support and resistance? For November 13, the put wall is at $272 and the call wall at $283. Across all expirations, the heaviest strikes are $270 (puts) and $300 (calls).
What invalidates this week's read? A close above $278.
Methodology & disclosures. Data: end-of-day options-chain snapshot for IWM, 2026-11-06, generated 2026-11-08T13:20:56.547Z. Prices shown are midpoints and will differ from live markets. Momentum/positioning scores and volatility-premium comparisons are descriptive measurements of past option flow and past price movement — not investment advice, signals, forecasts, or guarantees. All trade structures are hypothetical. Every structure shown has a defined maximum loss; you can lose the entire max-loss amount. Options involve substantial risk and are not suitable for all investors.