IWM Expected Move Into September 18: ±$7.25, the Key Levels, and Three Defined-Risk Trades
The options market implies a $281.64–$296.14 range for IWM into the September 18 expiration, with the heaviest put open interest parked at $285 and max pain at $293. Positioning leans slightly bearish, and both chart models agree — here's the level map and three defined-risk ways to trade it.

The options market implies a $281.64–$296.14 range into the September 18 expiration; here's what's driving it and three defined-risk ways to trade it.
Published Sunday, September 13, 2026 · Data as of Friday, September 11, 2026 close
Explore the live IWM options data in the Detailed Options Analyzer →
Quick answer
| Item | Answer |
|---|---|
| Market bias | Slightly bearish |
| Options-implied range (into September 18) | $281.64 – $296.14 (±2.51%, about ±$7.25) |
| Major support | $285.00 (September 18 put wall) |
| Major resistance | $315.00 (September 18 call wall — far overhead; the whole chain's heaviest call strike sits nearer, at $300.00) |
| Max pain (September 18) | $293.00 |
| Dealer gamma regime (estimate) | Negative — one rough estimate suggests market-maker hedging tends to amplify moves rather than cushion them; no flip-level estimate was available in this snapshot |
| Volatility condition | Falling day-over-day, higher over five days — IV rank 10/100 · premium rich: options are priced about 4.9 vol points above delivered movement |
| Technical check | Confirms (bearish; 3-day target $285.75, 5-day target $286.00) |
| Best-fitting strategy | Short call spread above the $293 pin (credit structure) |
| Analysis invalidated if | IWM closes above $293.00 |
1 · What matters today
IWM closed Friday, September 11 at $288.89, down 2.1% over five sessions and 4.8% over twenty. Options positioning leans slightly bearish into the September 18 expiration, and the clearest reason is where traders have been putting their money: for every call contract held open across the chain there are now 2.08 puts, up from 1.85 on the two-week average, and 25-delta puts cost about 5.9 vol points more than the equivalent calls — richer than this ETF's own 4.8-point norm.
The options market is pricing a move of roughly ±$7.25, or a $281.64–$296.14 range, through that expiration. The level that changes the picture is $293.00 — the max pain strike, meaning the price where the most option value would expire worthless. A close above it says the pressure has drained out of this read. Two chart models, run at 3-day and 5-day horizons, also point lower, which raises confidence without changing the map.
2 · What the options market is pricing
What changed this week
Money moved to the downside in a hurry. Put/call open interest went from 1.80 to 2.08 over five sessions — a 16% build — against a 14-day average of 1.85, so this is a genuine step up in hedging, not the usual background level. Put/call volume came in at 1.75 on Friday versus a 14-day average of 1.49 and a 60-day median of 1.44. Total option volume was only 1.10× its 20-day average, so this was not a panic day; it was a steadily put-tilted one.
The single biggest change in contracts held open (excluding anything that settled into Friday's expiry) was the October 2 $283 put, which added 67,078 contracts to finish at 69,581 open — a position that barely existed a day earlier. Closer in, the September 18 $280 put gained 20,296 contracts on 47,734 traded, while the September 18 $290 put shed 46,559, consistent with traders rolling protection down and out rather than carrying it into expiration week at the money.
Implied volatility told a two-speed story: at-the-money IV finished at 17.9%, down 11.1% on the day as Friday's bounce took hold, but still 7.3% higher than five sessions earlier and 8.3% below where it sat a month ago. Our short- and long-term trend reads agree here rather than conflict — momentum and price have both leaned bearish over the past week and the past month, while the ~50-day read is flat.
Expected move
Into September 18, the options market is pricing a move of about ±2.51%, or ±$7.25 around the $288.89 spot — that's the move implied by what at-the-money straddles cost, the standard one-standard-deviation approximation. In dollar terms: $281.64 to $296.14.
| Expiration | Implied move | Range around $288.89 |
|---|---|---|
| September 14 | ±0.93% | $286.20 – $291.58 |
| September 18 (our horizon) | ±2.51% | $281.64 – $296.14 |
| September 25 | ±3.41% | $279.04 – $298.74 |
| October 16 | ±5.59% | $272.74 – $305.04 |
The ladder climbs smoothly with time, with no step-function jump between rungs — there is no scheduled-event bump priced into any single expiration here, which is what you'd expect for a broad small-cap index fund. (Three mid-week expirations — September 15, 16 and 17 — had call and put quotes too far apart to price an honest at-the-money volatility, so they're left off the ladder.)
Volatility
At-the-money IV of 17.9% carries an IV rank of 10/100 — meaning today's implied volatility is cheaper than roughly 90% of the past year's readings — and a 52-week percentile of 11.9. It sits fractionally above its 30-day average of 17.5% and well below its 90-day average of 20.2%. The 60-day tenor prints 19.0%, so the curve still slopes gently upward into later dates. The front-month term-structure comparison is unavailable in this snapshot: Friday was an expiry day for the nearest contract, and front-month IV can't be interpolated from something expiring that afternoon.
Against its own recent history, IWM has actually been calm: 20-day realized volatility is 12.95%, below this ETF's own recent norm, and the 5-day-versus-20-day realized ratio of 0.96 says movement is running about typical, not accelerating. For the index-ETF crowd, the VIX overlay says the same thing — it closed at 15.84, a 13/100 rank on its own 52-week range, and it has tracked IWM's at-the-money IV tightly (0.88 correlation over 60 days).
Premium rich or cheap: the volatility risk premium — the gap between how much movement options are priced for and how much IWM has actually delivered — sits at about 4.9 vol points in favour of sellers. Where today's gap sits versus this ETF's own recent readings: the 73rd percentile, richer than about three-quarters of them. The path matters too: the premium widened from roughly 4.1 points on September 4 to about 7.3 points on September 10 as IV spiked on the selloff, then compressed back to 4.9 on Friday as IV fell 11% in a session. That combination — an IV rank of 10 but a 73rd-percentile premium over delivered movement — is the crux of the week: options are cheap by year-long standards, yet still priced for more movement than this fund has been producing. It favours collecting premium over owning it, so long as the structure is defined-risk and the short strikes respect the walls.
Skew and sentiment
Puts and calls the same distance from the price don't cost the same here. At 25 delta, put IV is 21.2% against call IV of 15.3% — a 5.9 vol-point gap, versus a 4.8-point median over the prior 60 days and a 5.5-point average over the past week. Traders are paying up for crash protection, and they're paying up more than they usually do for this name; measured against its own history, that skew reading is unusually stretched.
Sentiment in short-dated options is leaning the same way. The 0–7 day bucket scores −36 and the 7–30 day bucket −61, with the overall regime reading "broadly bearish" — every directional bucket on the curve tilts the same direction. That's a fresh development in the front end: the 0–7 day bucket averaged roughly flat over the past seven sessions before Friday's print. One more "versus its own norm" reading worth noting: 10 call contracts versus 18 put contracts cleared the 95th-percentile volume bar against their peer groups, an unusually put-tilted sweep mix even for this ETF.
The key levels map
| Level | Price | Why it matters |
|---|---|---|
| Call wall (September 18) | $315.00 | Heaviest call open interest for this expiration (60,732) — but far above the implied range; largely leftover quarterly positioning, not a near-term ceiling |
| 52-week high | $305.18 | Price sits 5.3% below it; range position 79/100 |
| Swing resistance | $303.11 | Heuristic swing-pivot cluster (estimate) |
| Whole-chain heaviest call strike | $300.00 | 91,087 calls open across all expirations — the nearest genuinely dense call shelf overhead |
| Swing resistance | $298.29 | Heuristic swing-pivot cluster (estimate) |
| 20-day / 50-day moving averages | $296.60 / $296.28 | Price is 2.6% and 2.5% below them — both now overhead |
| Top of implied range | $296.14 | Upper rail of the ±2.51% move priced into September 18 |
| Max pain (September 18) | $293.00 | Where the most option value would expire worthless; expirations sometimes gravitate toward it |
| Swing resistance | $292.52 | Nearest heuristic pivot above spot (estimate) |
| 100-day moving average | $291.20 | Price 0.8% below — the first real trend line to reclaim |
| Largest total gamma strike | $290.00 | Biggest gamma-weighted open interest on the board; hedging activity concentrates here |
| Spot | $288.89 | Friday's close |
| Swing support | $288.63 | Immediate heuristic support, effectively at the money (estimate) |
| Put wall (September 18) | $285.00 | Heaviest put open interest for this expiration (102,288) — the key downside shelf for the week |
| Bottom of implied range | $281.64 | Lower rail of the priced move |
| Whole-chain heaviest put strike | $280.00 | 286,412 puts open across all expirations — the chain's single densest level |
| Swing support | $277.62 | Next heuristic shelf below (estimate) |
| 200-day moving average | $273.83 | Price still 5.5% above it — the long-term uptrend is intact |
Note the disagreement worth naming: the September 18 expiration's own walls are $285 (puts) and $315 (calls), while the whole chain combined puts its heaviest strikes at $280 and $300. For this week's trading, the $285 put wall is the live level; $280 and $300 are where the longer-dated crowd is positioned.
Positioning and unusual flow
One rough estimate of dealer gamma reads negative both for the chain as a whole and for the September 18 expiration specifically — in that regime, market makers' hedging tends to amplify moves rather than dampen them, so a break of either rail can extend further than the implied range suggests. Treat it as an estimate built on an assumed dealer sign convention, not observed inventory; no flip-level estimate could be computed from Friday's data.
Three flow items stood out, all on the put side:
- October 16 $277 put — 64,604 contracts traded against 15,050 held open, roughly $17.9 million of premium, the single largest dollar line on the board. That's a large, far-out-of-the-money hedge being established about five weeks out, not a day-trade.
- October 9 $281 put — 9,900 traded against just 156 open, about $3.0 million of premium. A turnover ratio that high means the position is brand new.
- October 2 $283 put — the largest single build in contracts held open anywhere in the chain, +67,078 to 69,581.
The common thread: protection is being bought roughly 2–4% below spot, dated three to five weeks out. That is hedging behaviour, not a directional stampede — but it is what is keeping put prices rich.
3 · Technical check
Both chart models point the same way the options positioning does. The 3-day model (target date September 16) is bearish, targeting $285.75 within a projected $282.50–$292.50 band, with key levels at support $286.50 and resistance $291.00. Its most decisive reads: ADX at 36.4 with −DI (32.6) clearly above +DI (21.7), signalling a strong and still-strengthening downtrend, and Chaikin Money Flow at −0.200, well into distribution territory.
The 5-day model (target date September 18 — the same date our options thesis is anchored to) is also bearish, targeting $286.00 within a projected $282.50–$295.00 band, support $286.00 and resistance $291.00. Its dominant scenario is bearish continuation with invalidation on a sustained close above $291.80. Both flag the same caveat: a mild positive turn in the MACD histogram off a deeply negative base, unconfirmed by money flow or by price reclaiming its short-term moving averages.
Model vs. Market: The options market implies $281.64–$296.14 into September 18; the 5-day technical model targets $286.00. That target sits inside the implied range and below spot, so this is confirmation rather than tension — the chart is simply picking the lower half of the move the options are already pricing.
Because the technical read confirms rather than diverges, it didn't move the strikes below — it just gave more confidence in placing the short call strike above $293 rather than hugging spot.
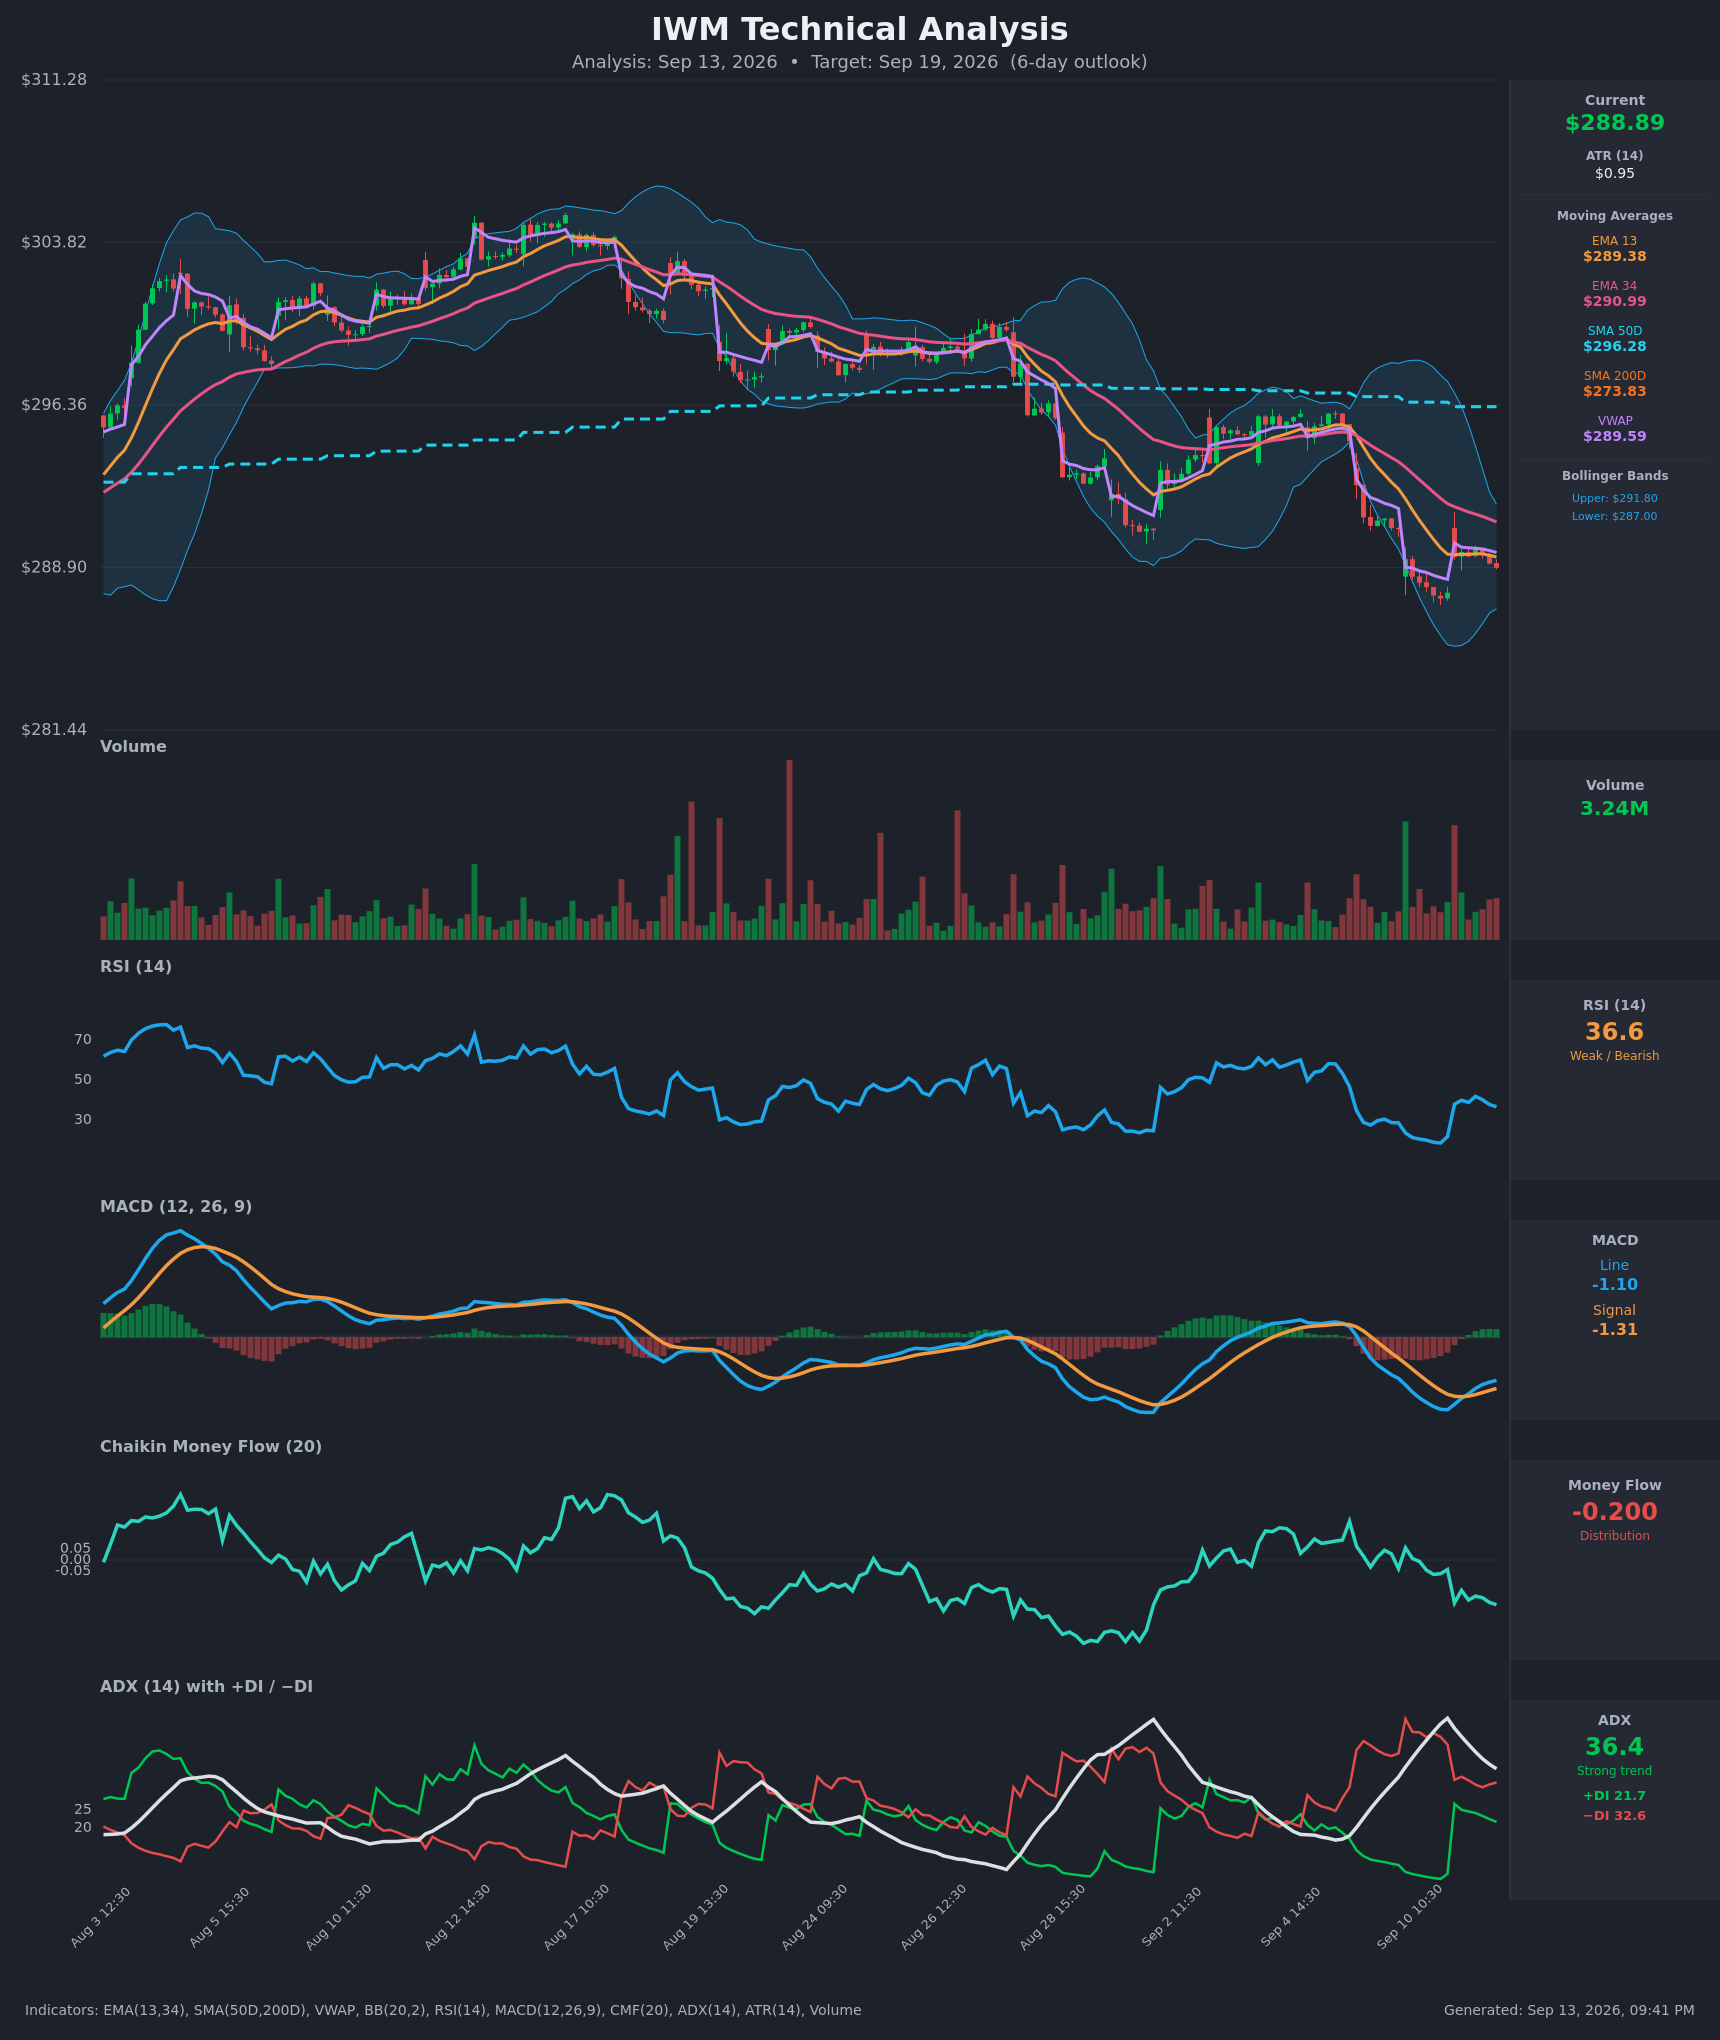
Full technical write-ups: 3-day report → · 5-day report →
4 · Three ways the next five days can go
If IWM pushes back above $293: the max pain strike for September 18 sits right there, and the nearest heavy call positioning above it is the $300 strike (91,087 calls open across the chain). Positioning above $293 thins out quickly until $296–$300, which is why an upside squeeze through the max-pain level has room to run toward the top of the implied range before it meets real resistance. This is the branch that kills the bearish lean.
If IWM drifts between $285 and $293: the pin case, and the one the structure of the chain most supports. The heaviest gamma-weighted open interest sits at $290, $285 and $288 — a dense cluster wrapped around spot — with max pain at $293 just above. Expirations sometimes gravitate toward that kind of cluster as dealers hedge expiring positions, and this is where every credit structure below makes its money.
If IWM breaks below the $285 put wall: the acceleration case. The 102,288 puts open at $285 for this expiration act as a shelf until they don't; below it, the next real pile of open interest is $280 (the chain's densest strike at 286,412 puts), which is also roughly the bottom of the implied range at $281.64. With the dealer-gamma estimate reading negative, one rough estimate suggests hedging flows in that zone would amplify a decline rather than cushion it.
5 · Three defined-risk structures
Prices are end-of-day midpoints as of 2026-09-11. All structures are hypothetical. Verify live prices before trading — these will be stale by the open.
If you lean bearish (the featured structure): short call spread
- Trade: Sell the September 18 $294 / $299 call credit spread (sell the $294 call, buy the $299 call). A credit spread means you collect premium up front and keep it if IWM stays below your short strike.
- Credit: $0.62 · Max profit: $62 · Max loss: $438 · Break-even: $294.62
- Why it fits: the short strike sits above max pain ($293), above the 100-day moving average ($291.20), above both chart models' resistance ($291.00) and above their targets ($285.75 and $286.00) — and it's inside the top rail of the implied range at $296.14. You're being paid by a premium that runs about 4.9 vol points above what IWM has actually delivered, at the 73rd percentile of its own recent readings.
- Makes sense only if: you accept that a low IV rank (10/100) means the absolute dollars collected here are small; this is a high-probability, low-payout trade, not a volatility sale.
- Invalidated if: IWM closes above $293.00.
- Managing it: close at roughly 50% of max credit; with the short-term trend fighting a flat 50-day read, take profits early rather than holding for the last few cents. Exit regardless at the September 16 checkpoint if IWM has reclaimed $291.80 — the 5-day model's own invalidation level.
- Liquidity note: the $294 calls quoted 3¢ wide and the $299 calls 2¢ wide on Friday; fills are straightforward, though on a contract priced at $0.14 that 2¢ is 10%+ of the mark, so work the spread as a package rather than legging in.
- Analyze this position →
If you expect the range to hold: iron condor
- Trade: Sell the September 18 $282 / $279 put spread and the $296 / $299 call spread — four legs, one net credit, profitable if IWM finishes between the short strikes.
- Credit: $0.64 · Max profit: $64 · Max loss: $236 · Break-evens: $281.36 and $296.64
- Why it fits: the break-evens sit just outside the options-implied rails of $281.64 and $296.14, and the short strikes bracket both the $285 put wall and the $293 max-pain magnet. The premium's richness versus delivered movement is the entire edge here.
- Makes sense only if: you genuinely expect chop. The dealer-gamma estimate reads negative, which argues that breakouts extend rather than fade — this structure is the one that suffers most if that estimate proves right.
- Invalidated if: IWM closes outside $281.64–$296.14, i.e. beyond the implied range in either direction.
- Managing it: take it off at ~50% of credit; close the threatened side rather than hoping if either short strike trades through, and don't carry a tested condor into the final session.
- Liquidity note: the $282 puts quoted 4¢ wide on 42,176 contracts of volume (about $4.5 million of premium) and the $296 calls 3¢ wide; the $279 put wing is 3¢ wide. All four legs are executable, but four-leg slippage adds up on a $64 max profit — use a limit at the mid.
- Analyze this position →
If you lean bullish: short put spread
- Trade: Sell the September 18 $285 / $280 put credit spread (sell the $285 put, buy the $280 put) — you collect premium and keep it if IWM holds above $285.
- Credit: $0.91 · Max profit: $91 · Max loss: $409 · Break-even: $284.09
- Why it fits: the short strike is the put wall itself — 102,288 contracts of open interest at $285 for this expiration — and the long wing sits at $280, the densest strike in the entire chain. The steep skew means you're being paid more for this side than for the equivalent call spread.
- Makes sense only if: you read the heavy put building as hedging into an intact long-term uptrend (IWM is still 5.5% above its 200-day average) rather than as conviction selling. It fights our stated bias, so size it accordingly.
- Invalidated if: IWM closes below $285.00.
- Managing it: close at ~50% of credit; if IWM trades through $285 intraday with the dealer-gamma estimate still negative, close rather than hope — that's precisely the level below which hedging flows are estimated to accelerate selling.
- Liquidity note: the $285 puts traded 5¢ wide on 24,445 contracts (about $4.1 million of premium) and the $280 puts 3¢ wide on 47,734 contracts — the two most heavily traded lines in the expiration. Fills are easy.
- Analyze this position →
If none of these: no trade
Premium is rich relative to delivered movement, which normally argues for selling it — so why stand aside? Two honest reasons. First, the absolute dollars are thin: with an IV rank of 10/100, a five-point-wide spread pays $62–$91, meaning a single bad fill or one round trip of slippage eats a meaningful slice of the edge. Second, the dealer-gamma estimate reads negative on both the aggregate chain and this specific expiration, which is the environment where short-premium structures get hurt most — moves extend instead of mean-reverting, and a $438 max loss arrives faster than a $62 credit accumulates. If you can't monitor the position through the September 16 checkpoint, waiting for either a higher IV rank or a cleaner break of $285 or $293 is a perfectly good trade.
6 · Quick FAQ
What is IWM's expected move into September 18? About ±$7.25, or ±2.51% — a $281.64 to $296.14 range around the $288.89 close, per the options market's straddle pricing as of September 11.
Is IWM expected to go up or down over the next five days? Options positioning as of September 11 leans slightly bearish — put/call open interest at 2.08, 25-delta puts running 5.9 vol points over calls, and short-dated sentiment broadly negative — but that's a read of what traders have already done, not a forecast. The actionable map is the $281.64–$296.14 range with $285 as support and $293 as the level that flips the read.
Are IWM options expensive right now? Two lenses, two answers. An IV rank of 10/100 says option prices are lower than about 90% of the past year's readings. But they're also running roughly 4.9 vol points above the movement IWM has actually delivered over the past 20 days — richer than about 73% of this ETF's own recent readings. Cheap in absolute terms, rich relative to realized movement: that favours defined-risk premium selling, in small size.
Where is IWM's biggest options support and resistance? For the September 18 expiration, the put wall is $285.00 (102,288 contracts open) and the call wall is $315.00 (60,732) — the latter far above the implied range. Across the whole chain, the densest strikes are $280 on the put side and $300 on the call side.
What invalidates this week's read? A close above $293.00, the max-pain strike for September 18.
Methodology & disclosures. Data: end-of-day options-chain snapshot for IWM, 2026-09-11, generated 2026-09-13T21:41:08.220Z. Prices shown are midpoints and will differ from live markets. Momentum/positioning scores and volatility-premium comparisons are descriptive measurements of past option flow and past price movement — not investment advice, signals, forecasts, or guarantees. All trade structures are hypothetical. Every structure shown has a defined maximum loss; you can lose the entire max-loss amount. Options involve substantial risk and are not suitable for all investors.