KWEB Options Are Pricing a $1.26 Move, and Positioning Leans Back Toward $24
After a 9.4% one-week rally, KWEB options price a $23.62–$26.14 range into the November 13 expiration. Traders are paying up for puts against an unusually heavy call build, and our positioning read tilts slightly bearish beneath the $25.50 call wall.
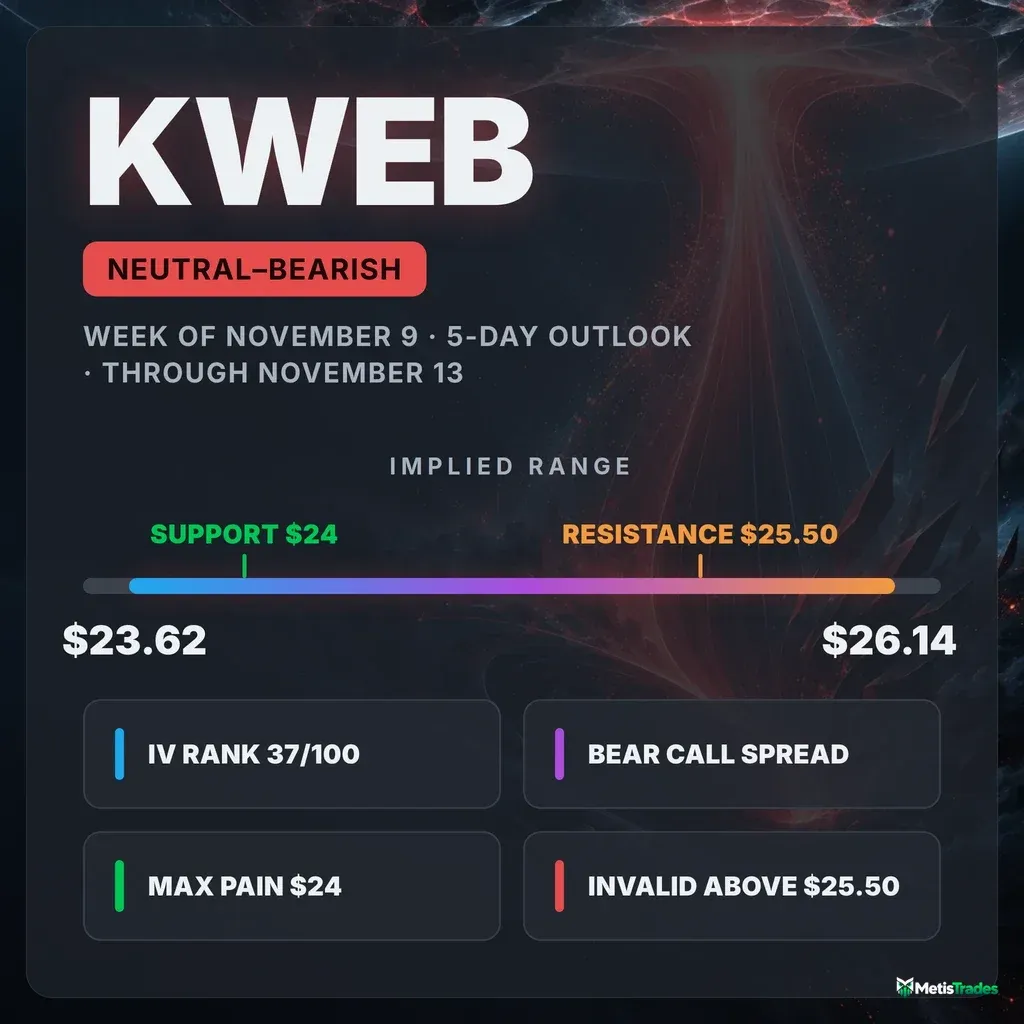
The options market implies a $23.62–$26.14 range into the November 13 expiration. Below is what's driving it and three defined-risk ways to trade it.
Published Sunday, November 8, 2026 · Data as of Friday, November 6, 2026 close
Explore the live KWEB options data in the Detailed Options Analyzer →
Quick answer
| Item | Answer |
|---|---|
| Market bias | Slightly bearish (neutral with a bearish tilt) |
| Options-implied range (into Nov 13) | $23.62 – $26.14 (±5.05%, ±$1.26) |
| Major support | $24.00 (Nov 13 put wall and max pain) |
| Major resistance | $25.50 (Nov 13 call wall) |
| Max pain (Nov 13) | $24.00 |
| Dealer gamma regime (estimate) | Positive, so hedging tends to dampen moves. Flip level ≈ $25, with spot sitting just below it. |
| Volatility condition | Rising. IV rank 37/100. Premium is rich: options are priced about 8 vol points above delivered movement. |
| Technical check | Mixed. The 5-day model is bearish (target $24.55) and confirms; the 3-day model is bullish (target $25.00) and diverges. |
| Best-fitting strategy | Nov 13 $25.50/$26 bear call spread, if you're comfortable selling premium into a capped week |
| Analysis invalidated if | KWEB closes above $25.50 |
1 · What matters today
KWEB's options market leans slightly bearish over the next five days. Call it neutral with a bearish tilt.
The biggest reason is what happened after the fund's 9.4% one-week rally. Traders kept chasing calls, but they are also paying far more for downside puts than is normal for this ETF. That mix usually means hedging into strength, not conviction that the rally continues.
Options are pricing a move of about $1.26 either way into the November 13 expiration. That works out to a range of roughly $23.62 to $26.14.
- Ceiling: the heaviest stack of call contracts for that expiration sits at $25.50.
- Floor and magnet: the $24 strike holds both the biggest put stack and the max-pain level, the price where the most option value would expire worthless.
- Kill switch: a close above $25.50 would undercut the bearish lean.
The 5-day chart model agrees, with a target of $24.55.
2 · What the options market is pricing
What changed this week
KWEB closed at $24.88 on Friday, up 9.41% over five sessions. It is still essentially flat over the past month (−0.2%) and down 4.7% over roughly two and a half months. The short-term trend read is firmly up, while the longer reads are flat, so the week's pop has not yet turned the bigger picture.
Implied volatility (IV) is the market's estimate of how much KWEB will move, baked into option prices. It climbed 11.3% over the five days, then eased 10.1% in Friday's session alone. The market bid for movement during the breakout and backed off slightly as price stalled near $24.90.
Flow was lopsided toward calls. The put/call volume ratio measures how much put activity there is relative to calls; above 1 means puts dominate.
- Friday's put/call volume ratio was 0.17, against a 7-day average of 0.35. Calls outnumbered puts roughly six to one.
- The put/call open interest ratio (open interest = contracts currently held open) slipped to 0.36, from a 7-day average of 0.39.
- Net new call positioning reached +121,077 contracts versus +7,456 on the put side. That is unusually heavy for this name compared against KWEB's own recent history; "unusual" here means unusual for KWEB, not versus the broader market.
The single biggest change was in the January 15, 2027 $27 calls. Open interest jumped by 100,751 contracts, from 13,595 to 114,346. Meanwhile the December 18 $29 calls shed 63,328 contracts. That pattern looks like traders rolling or rebalancing upside bets to a nearer, lower strike, not brand-new money alone.
Expected move
The expected move is the move the options market is pricing in, derived from what straddles cost. Into the November 13 expiration it is ±5.05%, or about ±$1.26 around the $24.88 snapshot price.
| Expiration | Implied move | Range around $24.88 |
|---|---|---|
| Nov 13 | ±5.05% | $23.62 – $26.14 |
| Nov 20 | ±6.80% | $23.19 – $26.57 |
| Nov 27 | ±8.19% | $22.84 – $26.92 |
| Dec 4 | ±9.03% | $22.63 – $27.13 |
The rungs widen smoothly, roughly with the square root of time. There's no single expiration where the market is pricing a special event, just a steady ±$1–$2 band per week or two.
Volatility
At-the-money IV stands at 32.52%, above both its 30-day average (30.1%) and its 90-day average (30.4%). It is up 23.3% over the past 30 sessions.
IV rank shows where today's IV sits versus the past year. At 37/100, KWEB options are cheaper than 63% of the range of the past year's readings. The IV percentile of 61.5 adds nuance: today's level is higher than about 61% of individual days. The yearly range has been stretched by a few spikes, while most days were quieter than now.
Term structure compares option prices across different expiration dates. The front-month read is unavailable today because Friday was an expiry day. Realized movement is also accelerating: KWEB's last five days have been livelier than its 20-day pace, a bit above this ETF's norm.
Premium is rich. The volatility risk premium is the gap between how much movement options are priced for and how much KWEB has actually delivered. When it's positive, option sellers have been collecting more than realized movement cost them.
- Options are priced about 8 vol points above KWEB's 20-day realized volatility of 24.5%.
- That gap sits at the 80th percentile of this fund's own recent readings, meaning it is richer than about 80% of them.
- The gap briefly dipped negative on November 4 as the breakout bars fed into realized volatility. It snapped back to about 8 points the next day, so the richness is not a one-day blip.
An IV rank in the high 30s plus an 80th-percentile premium over delivered movement favors collecting premium rather than owning it, as long as the structure caps the risk.
Skew and sentiment
Skew means puts and calls the same distance from the stock price don't cost the same. When puts are pricier, traders are paying up for crash protection.
On Friday, 25-delta puts were running about 26 vol points over comparable calls. The 60-day norm for KWEB is roughly −5, meaning calls are usually the pricier side here. Even the 7-day average skew was close to flat, so this is a sharp, recent steepening that is stretched well beyond this name's own history.
Traders were buying calls hand over fist while simultaneously paying a hefty premium to protect against a drop. That's the signature of hedging a counter-trend rally, not of a market that trusts it.
Sentiment in short-dated options reads constructive:
- Positioning across the 0–7 day and 8–30 day windows leans bullish, with calls building in both.
- The overall pattern is best described as a "bullish recovery," with positioning extending further out the curve.
- The 30–60 day window leans bearish, driven by expensive puts and call open interest being unwound.
Our leading positioning read has also slipped below zero even as price rose about 8% over the past two weeks. Price and positioning pulling apart like this are conditions that have historically preceded a turn for KWEB. That divergence, plus the extreme skew, is why we read the call chase cautiously.
The key levels map
| Level | Price | Why it matters |
|---|---|---|
| 200-day moving average | $27.70 | The longer-term trend line. The rally is still well beneath it. |
| Swing resistance | $27.29 | Prior pivot cluster above the aggregate call wall. |
| Whole-chain call wall | $27.00 | The heaviest call strike across all expirations (250,468 contracts); a major gamma strike. |
| Top of implied range (Nov 13) | $26.14 | The upper edge of the 1σ expected move. |
| Swing resistance | $26.12 | Prior pivot, nearly on top of the implied-range ceiling. |
| Gamma strike | $26.00 | Heavy call open interest across near-dated expirations. |
| Swing resistance | $25.63 | The next structural hurdle above the call wall. |
| 100-day moving average | $25.51 | Sits a penny above the call wall, which reinforces the ceiling. |
| Call wall (Nov 13) | $25.50 | The biggest pile of open calls for this expiration (8,773 contracts). Strikes like this often act as barriers. |
| Swing resistance | $25.02 | The nearest overhead pivot. |
| Gamma flip (estimate) | $25.00 | One rough estimate puts the hedging pivot here. Below it, market-maker hedging tends to accelerate selling rather than cushion it. It is also the largest gamma strike. |
| Friday close | $24.88 | Reference price. |
| 50-day moving average | $24.46 | First moving-average support. |
| Nov 5 gap base | $24.32 | The prior close before the November 5 gap up. The gap is only partly filled. |
| Swing support | $24.16 | Prior pivot just above the put wall. |
| Put wall and max pain (Nov 13) | $24.00 | The largest put stack (1,741 contracts) and the level where the most Nov 13 option value expires worthless. It is also the whole-chain put wall (82,440 contracts). |
| 20-day moving average | $23.86 | Short-term trend support. |
| Swing support | $23.83 | Pivot cluster just under the 20-day average. |
| Bottom of implied range (Nov 13) | $23.62 | The lower edge of the 1σ expected move. |
| 52-week low and swing support | $22.54 | The floor of the past year. |
The November 13 expiration's call wall ($25.50) sits well below the whole chain's heaviest call strike ($27). For the next five days, $25.50 is the ceiling that matters. Both views agree on $24 as the put wall.
Positioning and unusual flow
Market makers hedge the options they've sold. In a positive-gamma regime, their hedging tends to dampen moves.
One rough estimate puts both the whole chain and the November 13 expiration in that regime. The catch is that the estimated flip level is about $25, and KWEB closed about half a percent below it. The cushion exists on paper but is thin, and a slip lower is where it stops helping.
Three non-expired items stand out:
- Dec 4 $26 calls: 6,568 contracts traded against only 620 open, about $378,000 in premium. That is a sizable bet on a push through $26 within a month, roughly ten times the existing position in one session.
- Nov 13 $26 calls: open interest jumped from 333 to 6,472. Fresh upside lottery tickets cluster just above the $25.50 wall.
- Nov 13 $24.50 puts: 1,003 contracts traded against 104 open, about $35,000 of premium. This is the downside hedge showing up in this week's expiration, right between spot and the $24 put wall.
For context, into Friday's expiration the November 6 $25 calls had added 4,556 contracts of open interest. Those have now settled and are history, not a live level.
3 · Technical check
The 5-day technical model lines up with this outlook window: it covers the same stretch as the November 13 expiration. It is bearish, with a $24.55 target and a projected range of $23.95–$25.35.
That confirms the options read. The direction matches our bearish tilt, and the target sits comfortably inside the $23.62–$26.14 implied range, near the $24 max-pain magnet. The model's case rests on an overbought RSI that is fading from an extreme and a fresh bearish MACD crossover while price stalls near $24.90. Its dominant scenario is a pullback toward the 50-day average, invalidated by a close above $25.07.
The 3-day model, the halfway checkpoint at November 11, diverges. It reads bullish, targets $25.00 within a $24.40–$25.35 range, and cites a very strong ADX trend reading with bulls in control and a possible bull-flag consolidation. Its dominant scenario is invalidated by a close below $24.70.
Taken together, the near-term chart still has upside momentum to burn off before the bearish case can play out. That timing fits a fade-the-ceiling trade better than an outright short.
Model vs. Market: The options market implies $23.62–$26.14 into November 13. The 5-day technical model targets $24.55. Both point to the lower half of the range, so the question is whether KWEB can hold above the $24.72 short-term support the chart flags or slides toward $24.
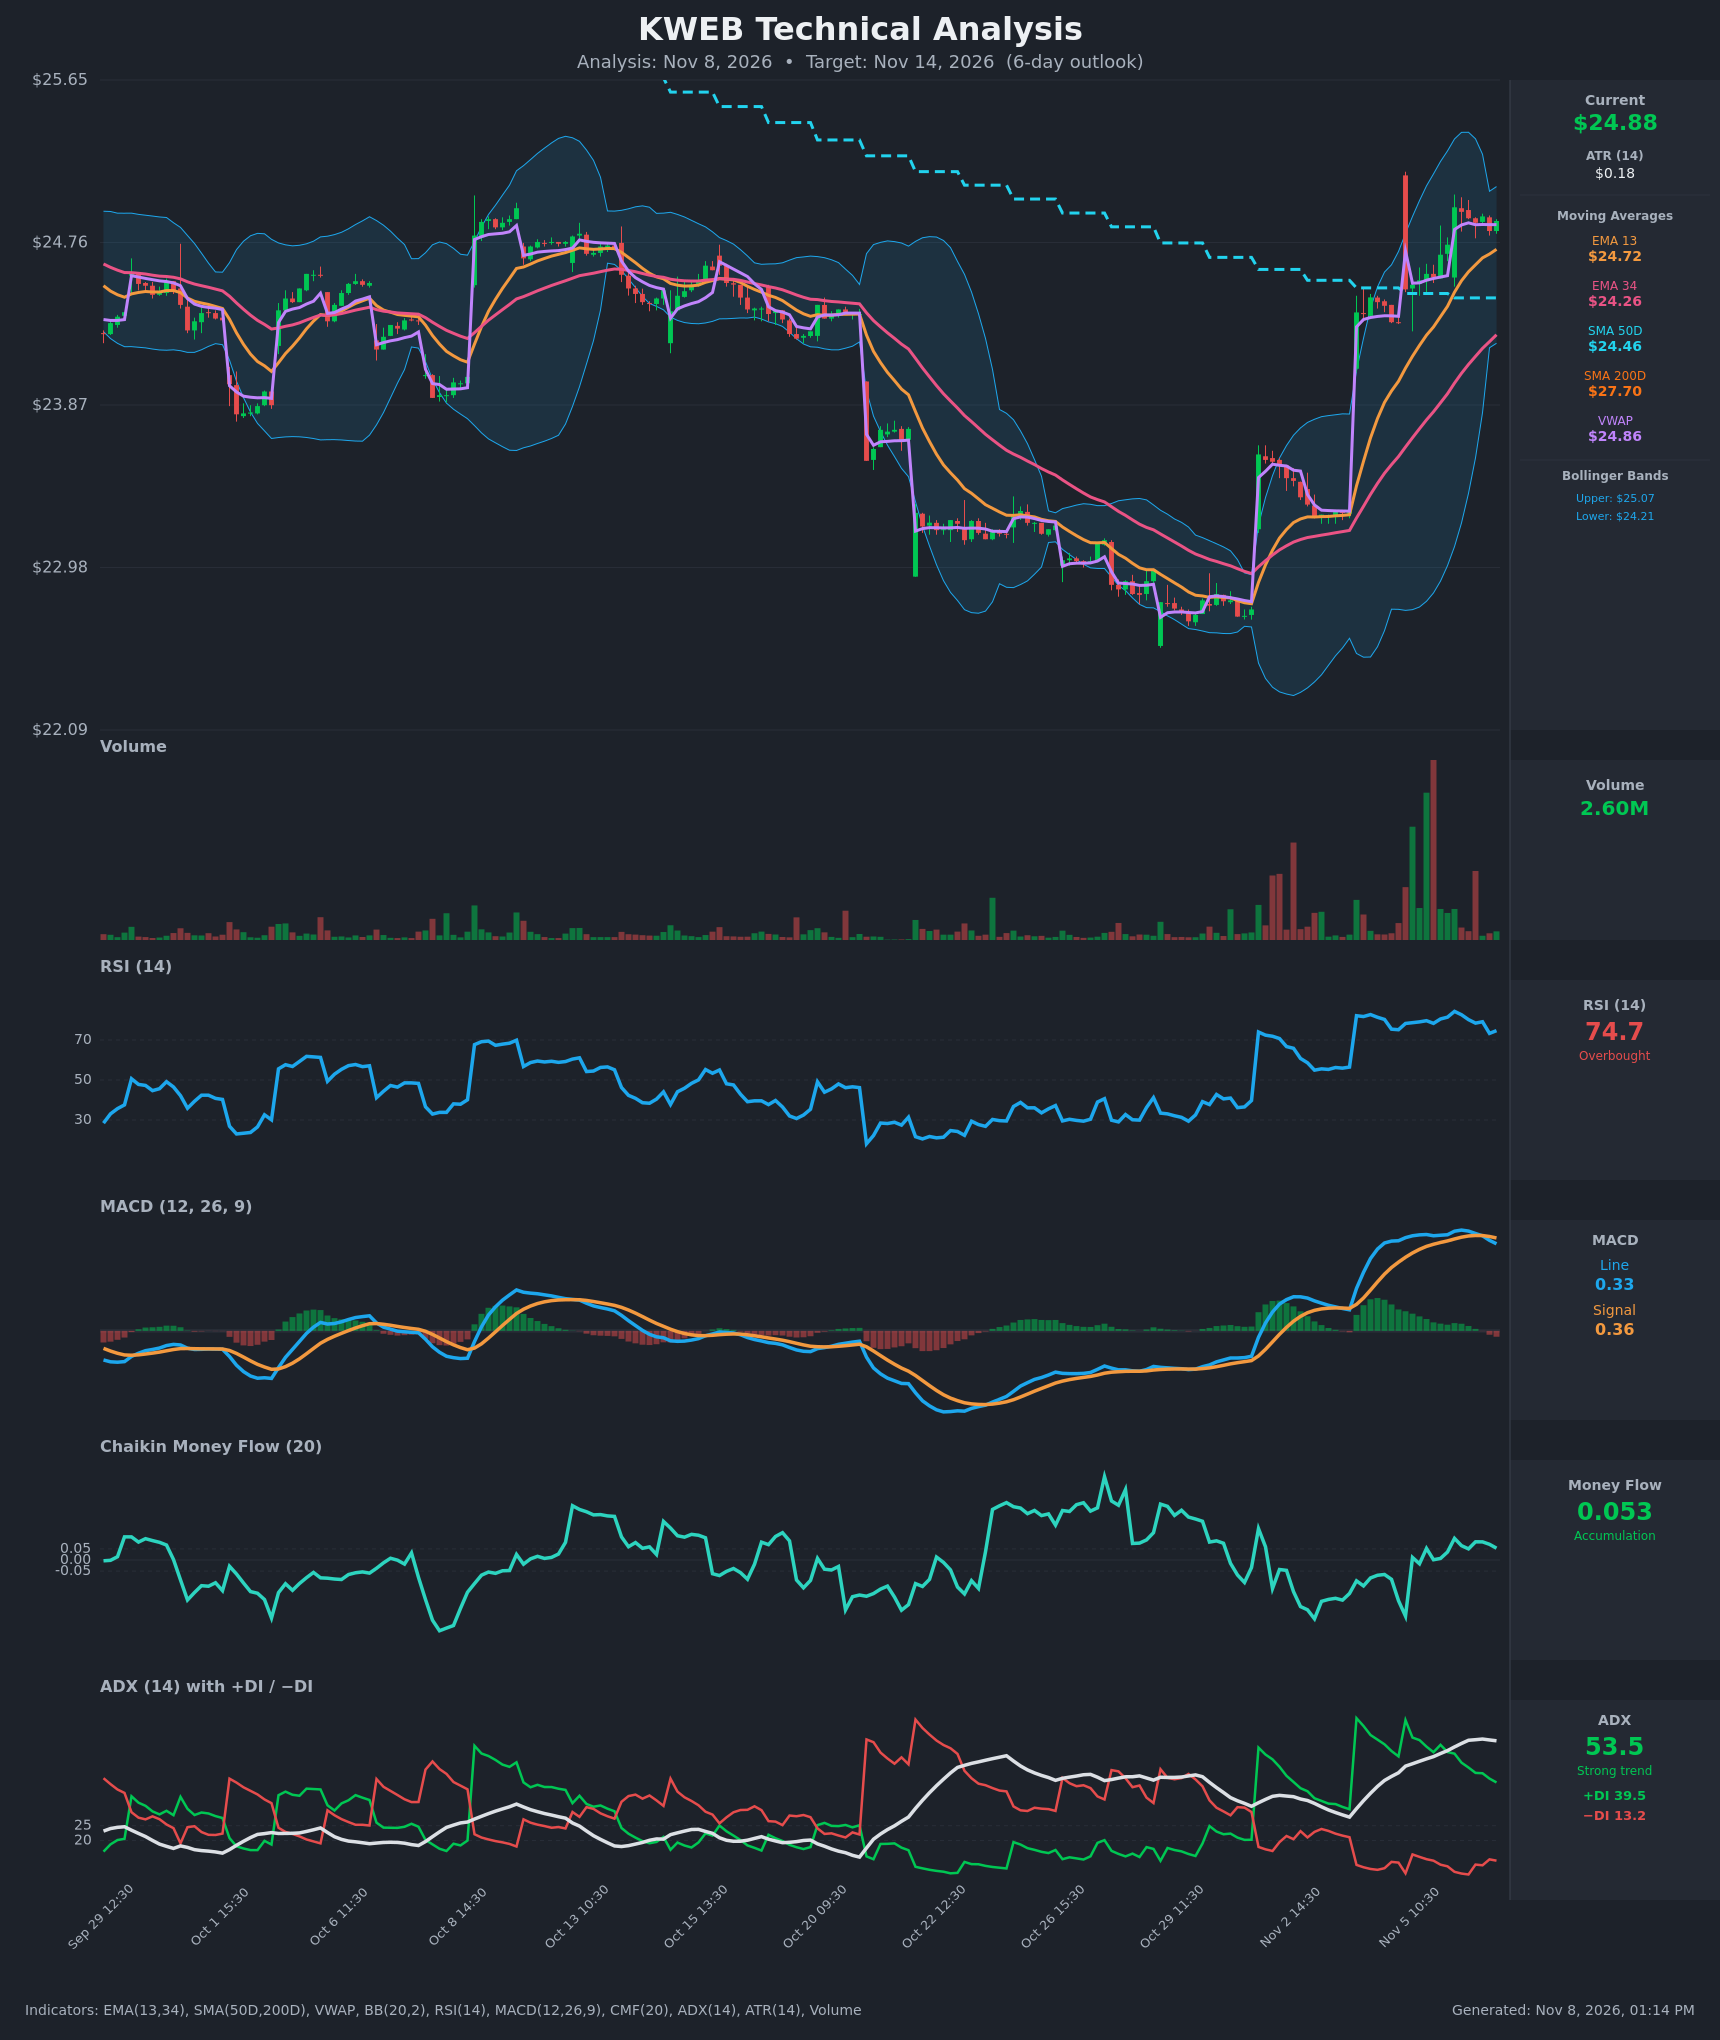
Both technical models put resistance at about $25.07 and cap their ranges at $25.35, below the $25.50 call wall. That reinforced placing the short call strikes below at $25.50.
Full technical write-ups: 3-day report → · 5-day report →
4 · Three ways the next five days can go
If KWEB pushes above the call wall ($25.50): The 100-day average at $25.51 and the swing level at $25.63 sit right there. Heavy call positioning overhead tends to slow rallies as hedges are adjusted. A clean close through it leaves the newly built $26 calls and then the $27 whole-chain wall as the next layers. That would also invalidate this article's bearish lean.
If KWEB drifts between the walls: This is the pin case. With max pain at $24 and the gamma estimate in dampening mode, expiring open interest tends to pull price toward the lower half of the $24–$25.50 corridor into November 13. Spot is sitting about as close to the $25 flip estimate as is typical for this name. Reclaiming $25 would firm up the cushion; staying under it leaves moves freer to run.
If KWEB breaks below the put wall ($24): The November 13 put wall is thin, only 1,741 contracts, so it offers less support than the label implies. Below it, the 20-day average at $23.86 and swing support at $23.83 come next, followed by the $23.62 bottom of the implied range. One rough estimate suggests hedging stops cushioning once price is well beneath the $25 flip, which can let a slide extend.
5 · Three defined-risk structures
Prices are end-of-day midpoints as of November 6, 2026. All structures are hypothetical. Verify live prices before trading, because these will be stale by the open.
Premium is rich (80th percentile over delivered movement), so credit structures lead. A credit spread means you collect premium upfront and are betting price stays on the right side of your short strike. Your maximum loss is the spread width minus the credit.
If you lean bearish: Bear call spread
- Trade: Sell the Nov 13 $25.50 call and buy the Nov 13 $26 call.
- Credit: $0.095 ($9.50 per spread) · Max profit: $9.50 · Max loss: $40.50 · Break-even: $25.595
- Why it fits: The short strike sits on the November 13 call wall, a penny below the 100-day average. Premium is running about 8 vol points over delivered movement. Both technical models cap their ranges below $25.50.
- Makes sense only if: KWEB keeps stalling under $25.07–$25.50 rather than breaking out on volume.
- Invalidated if: KWEB closes above $25.50.
- Managing it: Close at about 50% of the credit. Exit no later than the November 12 close to avoid expiration-day pin risk. If KWEB closes through $25.50, close rather than hope. The short-term trend is still strongly up, so take profits early.
- Liquidity note: The $25.50 calls traded 7¢ wide ($0.16/$0.23) and the $26 calls 10¢ wide ($0.05/$0.15). On a credit this small, a few pennies of slippage is a big share of the trade, so work a limit at mid.
- Analyze this position →
If you expect the range to hold: Iron condor
- Trade: Sell the Nov 13 $24/$23.50 put spread and sell the Nov 13 $25.50/$26 call spread.
- Credit: $0.175 ($17.50 per condor) · Max profit: $17.50 · Max loss: $32.50 · Break-evens: $23.825 and $25.675
- Why it fits: The short strikes sit on the two November 13 walls ($24 and $25.50), inside the $23.62–$26.14 implied range. Rich premium and a dampening gamma estimate favor a pin. Put skew is steep, so the put side pays more than it normally would.
- Makes sense only if: KWEB settles into the $24–$25.50 corridor. Note that max pain sits exactly on the short put, so this structure wins at $24 but has no margin below it.
- Invalidated if: KWEB closes above $25.50 or below $24.00.
- Managing it: Close at 50% of the credit. Close the tested side if either short strike is breached on a closing basis. Exit by the November 12 close.
- Liquidity note: The $24 puts are 2¢ wide ($0.15/$0.17) and the $23.50 puts 2¢ wide ($0.07/$0.09), so fills are easy on that side. The call legs are wider, as noted above.
- Analyze this position →
If you lean bullish: Bull put spread
- Trade: Sell the Nov 13 $24 put and buy the Nov 13 $23.50 put.
- Credit: $0.08 ($8 per spread) · Max profit: $8 · Max loss: $42 · Break-even: $23.92
- Why it fits: It sells the steeply priced downside skew at the put wall. It also lines up with the 3-day model's bullish read and the strong short-term trend.
- Makes sense only if: KWEB holds the $24.46 50-day average and the $24.32 gap base. This runs against our tilt, so size it small.
- Invalidated if: KWEB closes below $24.00.
- Managing it: Close at 50% of the credit. Exit by the November 12 close. Close immediately on a close below $24.
- Liquidity note: Both legs trade 2¢ wide ($0.15/$0.17 and $0.07/$0.09), the tightest quotes in this expiration.
- Analyze this position →
If none of these: no trade
Premium is rich, but standing aside can still beat selling it here.
- Poor payoff ratio. All three structures collect only $8–$17.50 against $32.50–$42 of risk, so they need a high win rate to pay off.
- Short-dated gamma risk. With seven days to expiration, gamma risk dominates time decay. KWEB just moved 9.4% in a single week.
- Price sits on the pivot. Spot is right at the estimated $25 gamma flip, where the dampening effect is weakest.
- Puts may be rich for a reason. The extreme put skew could be pricing a real downside risk rather than offering free premium.
If you can't watch the position daily, or the wide call-side quotes would eat your edge, sitting out costs nothing.
6 · Quick FAQ
What is KWEB's expected move this week? About ±$1.26 (±5.05%) into the November 13 expiration, a $23.62–$26.14 range based on straddle pricing as of November 6, 2026.
Is KWEB expected to go up or down over the next week? Options positioning as of November 6 leans slightly bearish, because traders are paying an unusually steep premium for puts after a sharp rally. That's a read of what traders have done, not a forecast. The actionable map is the $23.62–$26.14 range with $24 support and $25.50 resistance.
Are KWEB options expensive right now? IV rank of 37/100 says option prices are below the middle of their past-year range. On top of that, they're running about 8 vol points above the movement KWEB has actually delivered, richer than 80% of this fund's own recent readings. That favors defined-risk premium selling over buying.
Where is KWEB's biggest options support and resistance? For the November 13 expiration, the put wall is at $24.00 (also max pain) and the call wall is at $25.50. Across all expirations, the heaviest call strike is $27.
What invalidates this week's read? A KWEB close above $25.50.
Methodology & disclosures. Data: end-of-day options-chain snapshot for KWEB, 2026-11-06, generated 2026-11-08T13:13:56.878Z. Prices shown are midpoints and will differ from live markets. Momentum/positioning scores and volatility-premium comparisons are descriptive measurements of past option flow and past price movement — not investment advice, signals, forecasts, or guarantees. All trade structures are hypothetical. Every structure shown has a defined maximum loss; you can lose the entire max-loss amount. Options involve substantial risk and are not suitable for all investors.