KWEB Options Are Pricing a ±$1.10 Move Into September 25 — and Positioning Keeps Pointing at $25
The options market implies a $23.73–$25.93 range for KWEB into the September 25 expiration, with the put wall and max pain both sitting at $25.00 and premium running richer than almost any reading of the past three months. Here's the level map and three defined-risk ways to trade a genuinely neutral setup.
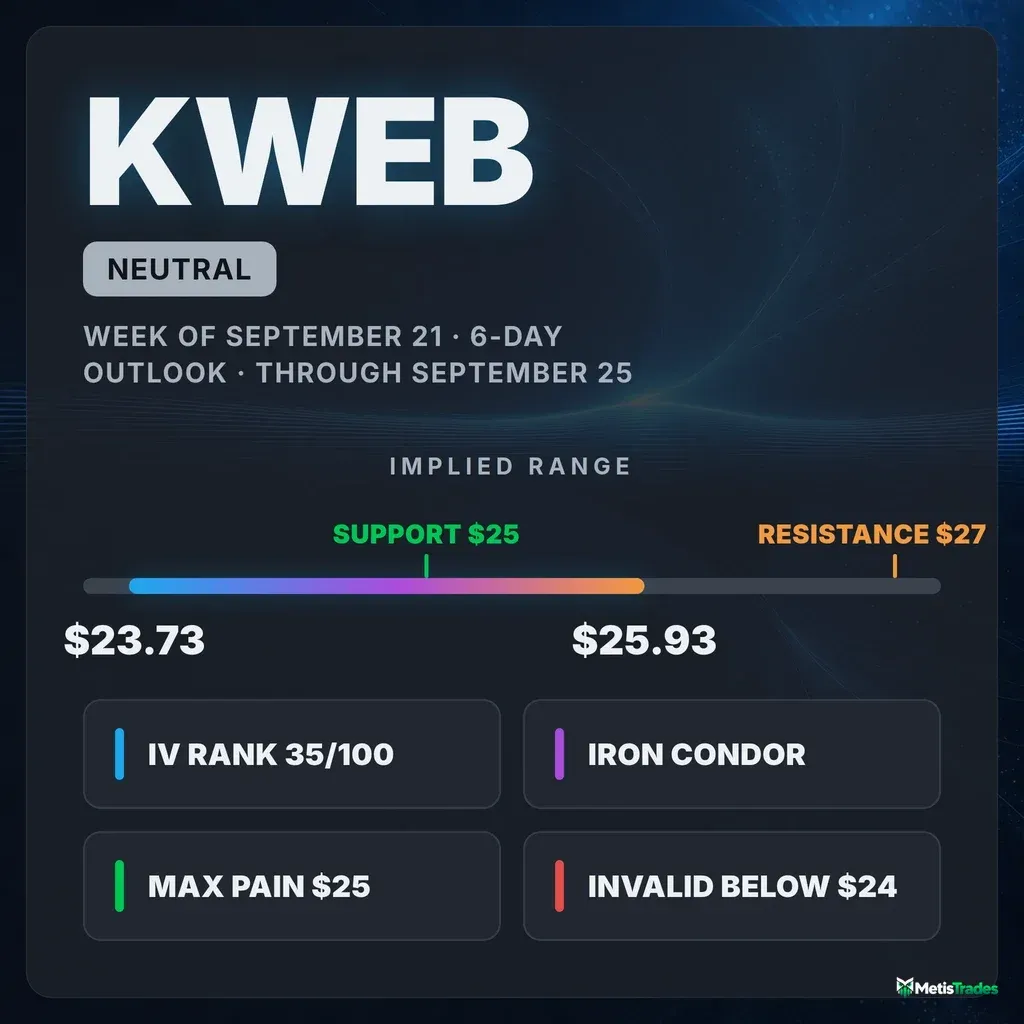
The options market implies a $23.73–$25.93 range into the September 25 expiration; here's what's driving it and three defined-risk ways to trade it.
Published Saturday, September 19, 2026 · Data as of Friday, September 18 close
Explore the live KWEB options data in the Detailed Options Analyzer →
Quick answer
| Item | Answer |
|---|---|
| Market bias | Neutral |
| Options-implied range (into September 25) | $23.73 – $25.93 (±4.4%, about ±$1.10) |
| Major support | $25.00 (put wall, September 25 expiration) |
| Major resistance | $27.00 (call wall, September 25 expiration) |
| Max pain (September 25) | $25.00 |
| Dealer gamma regime (estimate) | Negative for the September 25 expiration — hedging tends to amplify moves; whole-chain flip level ≈ $27.00 |
| Volatility condition | Rising — IV rank 35/100 · premium rich: options priced about 11.7 vol points above delivered movement |
| Technical check | Mixed (both chart models bullish, 3-day and 6-day, target $25.15) |
| Best-fitting strategy | Short iron condor around the $25 pin — conditional on the range holding |
| Analysis invalidated if | KWEB closes below $24.00 |
1 · What matters today
KWEB closed Friday, September 18 at $24.83 after a sharp one-day bounce, and the options market is pricing roughly $1.10 up or down between now and the September 25 expiration — a $23.73 to $25.93 band. Our read of the flow lands squarely neutral: short-dated sentiment leans mildly positive, the momentum read leans mildly negative, and relative put demand has jumped. They cancel.
The one number that organises everything is $25.00. That strike is simultaneously the put wall (the biggest pile of open put contracts for this expiration), the max-pain strike, and the largest gamma strike in the whole chain. Price is sitting seventeen cents beneath it. Both chart models point up, toward $25.15 — inside the implied range and essentially at that same magnet. A close below $24.00 kills this read.
2 · What the options market is pricing
What changed this week
Two things moved. First, volatility: at-the-money implied volatility — the market's estimate of how much KWEB will move, baked into option prices — jumped 13.1% in a single session and 17.9% over five days, to 31.9%. That lifted IV rank to 35/100 against a 7-day average of 25.5, so option prices are noticeably firmer than they have been all month. Second, protection: for every call contract held open there are now 0.36 puts, up from 0.26 five days ago — a 39% build in relative put open interest, and above the 7-day average of 0.30. Traders added downside hedges at a quick clip even as the shares rose.
Day-to-day volume told the opposite story. Put volume ran at just 0.29 per call traded on Friday, against a 7-day average of 0.80 — unusually call-tilted for this name. Total option volume was 0.96× its 20-day average, so nothing was unusual about the size, only the direction. The largest still-live change in contracts held open was at the October 16 $26 call, which added 9,934 contracts to 72,457 open on 11,957 traded and roughly $490,000 of premium — upside positioning being built a month out, not this week. (Into Friday's now-settled expiration, the $25 calls added 12,423 contracts of open interest on 6,377 traded; that is history, not a live level.)
The horizons disagree about what this bounce means. Over the past week price is up 0.9%; over the past twenty sessions it is down 7.0%, and the flow read turned from bullish to bearish on September 15. In plain terms: a sharp relief pop inside an intact multi-week decline. That argues for shorter-dated structures and earlier profit-taking than usual.
Expected move
The expected move is the move the options market is pricing in — derived from what straddles cost. For the September 25 expiration, the chain's overall ATM implied volatility of 31.89% scaled to the seven days remaining from Friday's snapshot works out to about ±4.4%, or roughly ±$1.10 around $24.83: a $23.73 to $25.93 band. That figure is derived from the chain-level reading because the September 25 row's own call and put sides disagreed too much on volatility to blend into a single number — a quote-quality artifact, not missing data. The October 2 rung has the same problem and is omitted below.
| Expiration | Implied move | Range around $24.83 |
|---|---|---|
| September 25 (derived) | ±4.4% | $23.73 – $25.93 |
| October 9 | ±5.4% | $23.49 – $26.17 |
| October 16 | ±7.6% | $22.95 – $26.71 |
The ladder rises smoothly with time rather than stepping up at any one rung, which is what you'd expect from a chain with no single dated event dominating it — there is nothing in this data pointing at a specific catalyst inside the window.
Volatility
At-the-money IV of 31.9% puts IV rank at 35/100, meaning option prices are cheaper than roughly 65% of the past year's readings — middling in absolute terms but climbing fast. Current IV sits above both the 30-day average (28.3%) and the 90-day average (31.4%), and it is up 11.9% over thirty sessions. The front-month reading and the comparison of prices across different expiration dates are unavailable today: Friday was an expiry day, and a same-day-expiring contract can't be used to interpolate that number. It returns next session.
One "vs its own norm" observation matters here — meaning compared against KWEB's own recent history, not the broader market. Twenty-day realized volatility, how much the shares have actually moved, is running at 20.1%, unusually depressed for this fund. Five-day realized movement against the twenty-day is about typical (a 0.93 ratio), so there was no burst of actual movement behind Friday's IV pop. As a sanity check on the macro backdrop: VIX is near the floor of its own 52-week range and its 60-day correlation with KWEB's ATM IV is only about 0.35, so broad-market volatility isn't explaining much of this.
Premium rich or cheap. The volatility risk premium — the gap between how much movement options are priced for and how much KWEB has actually delivered — stands at about 11.7 vol points (31.9% implied against 20.1% delivered). When that gap is positive, option sellers have been collecting more than realized movement cost them. This reading sits at the 98th percentile versus the fund's own recent readings: richer than roughly 98% of them. It has widened steadily, from about 4.8 vol points at the end of August to 8.9 on September 17 and 11.7 on Friday — implied volatility climbing while realized movement stayed quiet. The gap measurement is also stretched well above its own norm on our snapshot readings. No earnings report is scheduled in this data, so none of that richness is an event premium. The combination — IV rank 35 and a 98th-percentile premium over delivered movement — favours collecting premium rather than owning it this week.
Skew and sentiment
Skew measures whether puts and calls the same distance from the share price cost the same; when puts are pricier, traders are paying up for crash protection. In KWEB, the normal state is the opposite: over the past sixty sessions the 25-delta put has typically traded about 3.8 vol points below the 25-delta call. On Friday that gap had collapsed to essentially zero — 29.0% on the put side against 29.1% on the call side. Relative put demand has steepened by about 5.2 vol points over five sessions, and that shift is more pronounced than this fund's own norm. Traders are paying up for downside protection relative to how they usually price it here, even while trading calls in volume.
Short-dated sentiment reads mildly positive: the 0–7 day bucket scores +17 and the 7–30 day bucket +11, both driven by calls building in open interest and call-side flow dominating, while the 30–60 day bucket sits at −35 on put building. The overall summary phrase is a bullish-recovery regime, with the longest-dated bucket (+34) the strongest of the set — positioning is being built further out on the curve than the week we're covering. Against a 7-day baseline where every bucket leaned bullish, today's read is a touch softer in the middle of the curve.
The key levels map
| Level | Price | Why it matters |
|---|---|---|
| 200-day average | $29.78 | Price sits 16.6% below it — the long-term trend is still down |
| Call wall (September 25) | $27.00 | Heaviest call open interest for this expiration (15,281 contracts); also the whole chain's rough gamma-flip estimate |
| 50-day average | $26.61 | 6.7% overhead; nothing in this week's range reaches it |
| Swing resistance | $26.09 | Nearest heuristic pivot cluster from recent price structure (an estimate) |
| Heavy October call strike | $26.00 | Second-largest gamma strike chain-wide; where October positioning is concentrated |
| Top of the 6-day implied range | $25.93 | The upper rail of what options are pricing into Friday |
| 20-day average | $25.43 | 2.4% overhead — the first moving average a bounce has to clear |
| Put wall + max pain (September 25) | $25.00 | 22,069 puts open here, the largest gamma strike chain-wide, and the strike where the most option value would expire worthless |
| Friday's close | $24.83 | Seventeen cents under the magnet |
| Heaviest put strike chain-wide | $24.00 | 107,241 puts open across all expirations — a shelf of hedges |
| Bottom of the 6-day implied range | $23.73 | Lower rail of what options are pricing |
| 52-week low / only swing support | $23.23 | The single heuristic support level in the price structure (an estimate) |
One caveat on walls: aggregated across every expiration in the chain, the heaviest call strike is $35 with 250,966 contracts — a January-dated pile that is far out of reach and tells you nothing about this week. The September 25 expiration's own call wall at $27.00 is the number that governs the six-day window, and it differs sharply from the aggregate. The put wall happens to agree at $25.00 on both scopes.
Positioning and unusual flow
Market makers hedge the options they've sold, and the direction of that hedging depends on their net position. One rough estimate of that position, scoped to the September 25 expiration alone, comes out negative — in that regime hedging tends to amplify moves rather than cushion them. The same estimate across all expirations combined reads positive, so the two scopes disagree; the expiration-specific one is what applies to this week. Spot also sits about 9% below the chain-wide flip estimate of $27.00, which is unusually far below it for this fund. Treat all of that as an estimate built on an assumed convention, not observed dealer inventory.
Three still-live flow items stood out. The October 16 $25 call traded 13,411 contracts against 8,446 open — about $1.04 million of premium, the largest single line on the board and a 25% build in contracts held open. The September 25 $25.50 call traded 3,086 contracts against just 696 open, a turnover of 4.4× — fresh, short-dated upside speculation right above the pin. On the other side, the September 25 $24.50 put traded 2,144 contracts against 2,373 open, roughly $50,000 of premium, with traders positioning right at the lower edge of a plausible pin range.
3 · Technical check
Both chart-model reports lean bullish and both target $25.15. The 3-day model (through September 22) projects a $24.40–$25.45 band; the 6-day model (through September 25) projects $24.30–$25.75. Their reference price of $24.84 matches our snapshot close within a cent.
The supporting reads are decisive on the short horizon: ADX at 29.7 with +DI (35.3) well above −DI (21.2) after a directional crossover on September 18, and Chaikin Money Flow at 0.099 — flipped from distribution to accumulation over two sessions. Both reports are explicit that this is a counter-trend bounce inside a larger downtrend, with price far below the 50-day ($26.61) and 200-day ($29.78) averages. The dominant scenario's invalidation is a close back below $24.67.
Classification: mixed. The technical direction is more bullish than the options read, but the target sits comfortably inside the implied range and lands one dime from the max-pain strike — the models and the positioning are pointing at the same place by different roads. That agreement is why the structures below are centred on $25.00 rather than shaded lower, and why the bullish spread's invalidation borrows the chart model's $24.40 support.
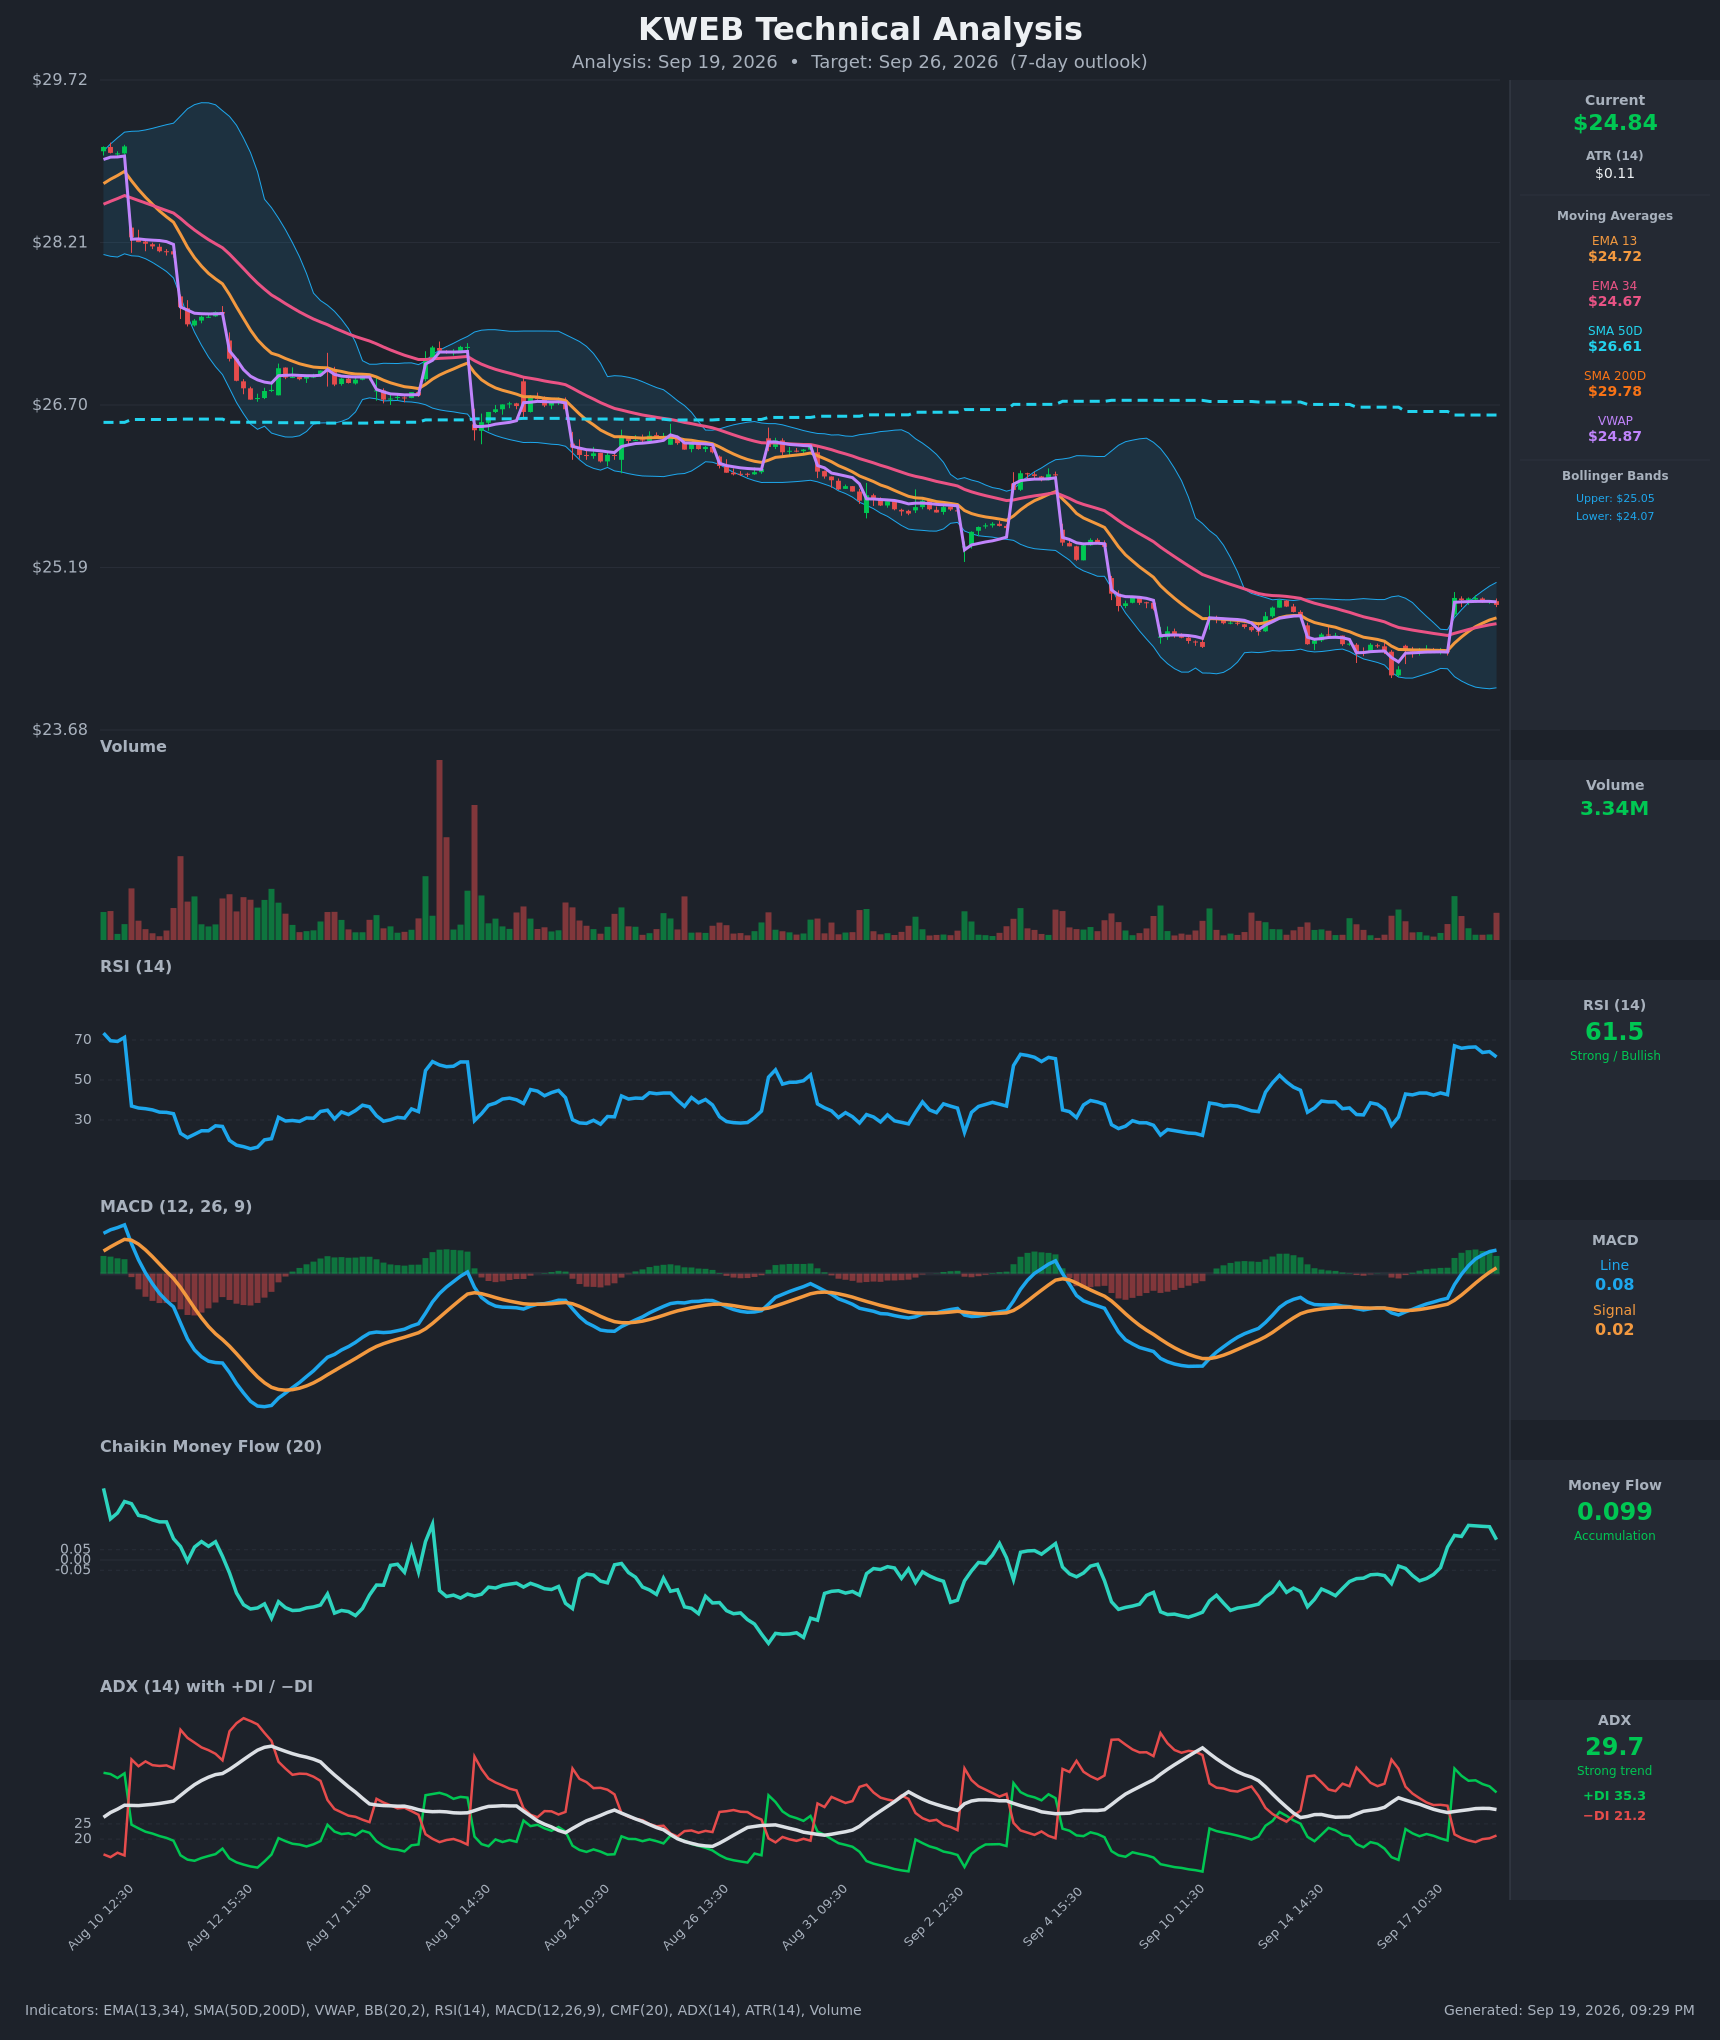
Model vs. Market: The options market implies $23.73–$25.93 into September 25; the 6-day technical model targets $25.15 within a narrower $24.30–$25.75 band. The chart model is asking for less movement than options are charging for — which is the same message the premium-richness read gives, arriving from the other direction.
Full technical write-ups: 3-day report → · 6-day report →
4 · Three ways the next six days can go
If KWEB pushes above the call wall ($27.00): that would require a 8.7% move in six days, roughly double what options are pricing, so treat it as the tail. The heaviest call open interest for this expiration sits there, and dense call OI overhead tends to slow rallies as hedging pressure builds against them. Everything between $25.43 (the 20-day average) and $26.09 (the nearest swing pivot) is thinner positioning that price can travel through quickly.
If KWEB drifts around $25.00: this is the base case the positioning describes. Max pain, the put wall, and the largest gamma strike in the chain all coincide at $25.00, and expirations sometimes gravitate toward the strike where the most option value expires worthless. Price closed seventeen cents below it. A quiet week with realized movement staying as depressed as it has been leaves $24.50–$25.50 as the natural centre of gravity.
If KWEB breaks below $24.00: that strike carries 107,241 open puts across the chain and marks the floor of the recent structure. The September 25 expiration's own dealer-gamma estimate is negative, and spot already sits unusually far below the chain-wide flip estimate of $27.00 — on that side of the estimate, one rough read suggests market-maker hedging amplifies selling rather than cushioning it. Below $24.00 the only heuristic support in the price structure is the 52-week low at $23.23, which is also just above the bottom of the implied range.
5 · Three defined-risk structures
Prices are end-of-day midpoints as of Friday, September 18. All structures are hypothetical. Verify live prices before trading — these will be stale by the open.
If you expect the range to hold: short iron condor (the featured structure)
- Trade: Sell the September 25 $24.50/$24.00 put spread and the $25.50/$26.00 call spread (four legs, $0.50 wings)
- Credit: $0.24 · Max profit: $24 per condor · Max loss: $26 · Break-evens: $24.26 and $25.74
- Why it fits: A credit spread means you collect premium up front and keep it if price stays where you've bet. With premium running 11.7 vol points above delivered movement — richer than 98% of this fund's own recent readings — and a neutral positioning read, selling a band around the $25.00 pin is the structure the data actually supports. The short strikes bracket max pain, the put wall, and the largest gamma strike.
- Makes sense only if: you believe realized movement stays near its current depressed 20.1% rather than catching up to the 31.9% options are charging for.
- Invalidated if: KWEB closes below $24.00 or above $26.00 — either close means one wing is fully in the money.
- Managing it: Close at ~50% of max credit. With the short-term bounce running against a 20-day downtrend, take profits earlier than you normally would rather than holding for the last few cents; exit regardless by Wednesday, September 23. If KWEB closes through either short strike, close rather than hope — the negative gamma estimate for this expiration argues against riding a breach.
- Liquidity note: The $24.50 puts traded five cents wide (21¢/26¢) on 2,144 contracts — the tightest line on this expiration. The $25.50 calls are 17¢ wide on a 16.5¢ mid and the $24.00 puts quote 1¢ bid / 18¢ ask, so the $0.24 midpoint credit is optimistic. Work the order as a package with a limit and expect to give up a few cents.
- Analyze this position →
If you lean bullish: short put spread
- Trade: Sell the September 25 $24.50/$24.00 put credit spread
- Credit: $0.14 · Max profit: $14 · Max loss: $36 · Break-even: $24.36
- Why it fits: You collect premium and keep it as long as KWEB holds above $24.50 at expiration — a bet on the floor, not on a rally. It is the condor's lower half, taken alone if you share the chart models' bullish lean. The $24.00 long leg sits at the heaviest put strike in the chain, so your defined risk is anchored to a real shelf of open contracts, and the premium you're selling is historically rich.
- Makes sense only if: the September 18 bounce holds its base and the 0–7 day sentiment read, which leans mildly positive on call building, keeps its footing.
- Invalidated if: KWEB closes below $24.40 — the swing-low confluence both chart models name as their bearish trigger.
- Managing it: Take 50% of the credit if it comes quickly; with only $14 of maximum profit against $36 of risk, this trade lives or dies on not letting a loser run. Close on a daily close below $24.40 rather than waiting for the break-even.
- Liquidity note: The $24.50 puts trade five cents wide and were the second-most active put on the board Friday; the $24.00 puts are the problem leg at 1¢/18¢. Use a spread limit order, never two market orders.
- Analyze this position →
If you lean bearish: short call spread
- Trade: Sell the September 25 $25.00/$25.50 call credit spread
- Credit: $0.15 · Max profit: $15 · Max loss: $35 · Break-even: $25.15
- Why it fits: You keep the full credit as long as KWEB finishes at or below $25.00 — the max-pain strike itself. This is the trade for readers who think the bounce stalls at the pin rather than pushing through the 20-day average at $25.43, and it is paid for by relative call demand: the 25-delta call's usual 3.8-vol-point premium over the put has vanished, so short-dated calls are no longer the expensive side they normally are here. Note the break-even sits exactly at both chart models' $25.15 target — you are taking the other side of them.
- Makes sense only if: you weight the 20-day downtrend (−7.0%) more heavily than the one-week bounce (+0.9%), and you accept that the pin can be overshot by a dime.
- Invalidated if: KWEB closes above $25.50 — through the short strike and into the upper half of the implied range.
- Managing it: Close at ~50% of credit or on any daily close above $25.15. A short call struck at the max-pain strike is a fine-margin trade; don't carry it into the final session hoping for a precise pin.
- Liquidity note: The $25.00 calls were the single most active contract at this expiration — 5,381 traded, about $169,500 of premium — but quoted 26¢/37¢, roughly 35% of the midpoint. The $25.50 calls traded 3,086 contracts at 8¢/25¢. Both are liquid in volume and ugly in spread; price the spread, not the legs.
- Analyze this position →
If none of these: no trade
Premium here is genuinely rich and not inflated by any scheduled event, so the case for standing aside has to be made on execution and on the size of the prize, not on the volatility read. Both are real. The September 25 board quotes bid-ask spreads of 21% to 133% of the midpoint; on a condor collecting 24 cents, a few cents of slippage on each of four legs eats a quarter of your edge before the trade has done anything. And the shares sit below a rough gamma-flip estimate, in the regime where hedging amplifies rather than dampens — the environment in which tight short strikes get run over fastest. If you cannot get filled near the midpoint as a package, the honest answer is to pass and revisit at the October expirations, where the $25 and $26 strikes trade six to fifteen cents wide instead.
6 · Quick FAQ
What is KWEB's expected move into September 25? About ±4.4%, roughly ±$1.10 around Friday's $24.83 close — a $23.73 to $25.93 range, derived from the chain's 31.89% at-the-money implied volatility scaled to the seven days remaining as of the September 18 snapshot.
Is KWEB expected to go up or down over the next six days? Options positioning as of September 18 reads genuinely neutral — mildly positive short-dated sentiment offset by a build in put open interest and relative put demand — but that is a read of what traders have done, not a forecast. The actionable map is the $23.73–$25.93 range and the $25.00 / $27.00 levels.
Are KWEB options expensive right now? Two lenses. IV rank 35/100 says option prices are higher than 35% of the past year's readings — middling. But they are also running about 11.7 vol points above the movement KWEB has actually delivered, richer than roughly 98% of this fund's own recent readings. That combination favours selling premium over buying it this week, with no earnings event distorting the comparison.
Where is KWEB's biggest options support and resistance? For the September 25 expiration: put wall $25.00 (22,069 contracts open), call wall $27.00 (15,281 contracts). Note the whole chain's heaviest call strike is $35, but that is long-dated positioning and irrelevant to this week.
What invalidates this week's read? A close below $24.00.
Methodology & disclosures. Data: end-of-day options-chain snapshot for KWEB, 2026-09-18, generated 2026-09-19T21:29:22Z. Prices shown are midpoints and will differ from live markets. Momentum/positioning scores and volatility-premium comparisons are descriptive measurements of past option flow and past price movement — not investment advice, signals, forecasts, or guarantees. All trade structures are hypothetical. Every structure shown has a defined maximum loss; you can lose the entire max-loss amount. Options involve substantial risk and are not suitable for all investors.